
DOW Nowhere Close to All Time High!
I've seen a graph of the DJIA perhaps a thousand times and it always looks the same, up (mostly) and to the right. But we all know a dollar today is worth a fraction of what it was in 1950 (11 cents, to be exact.) So when I look at that graph, what exactly am I seeing? Hmm, that is a very good question... Keep reading, there are some startling insights here for every future retiree and stock investor to consider!
Inflation should always be a concern for savers, investors and retirees. Why? Think about your favorite senior with $500K in a safe investment at a yield of 1%. In 2012, they earned $5,000 in interest income. However, with inflation at 3%, their real or nominal rate of return is a negative -2%! This loss is realized through a decrease in the purchasing power of their savings which effectively shrinks to $485K the first year or $429K in 5 years.
The same is true for a stock investor. The market goes up, portfolio values increase and everyone's happy. However, when the effects of inflation are included, the real rate of return can be quite different. Take the 12 year period from 2000 to 2012. The DJIA moved from 11,497 to 13,104 for an increase of 14%. But after inflation of 25% during the same period, the real return was negative with a loss in purchasing power of 13%!
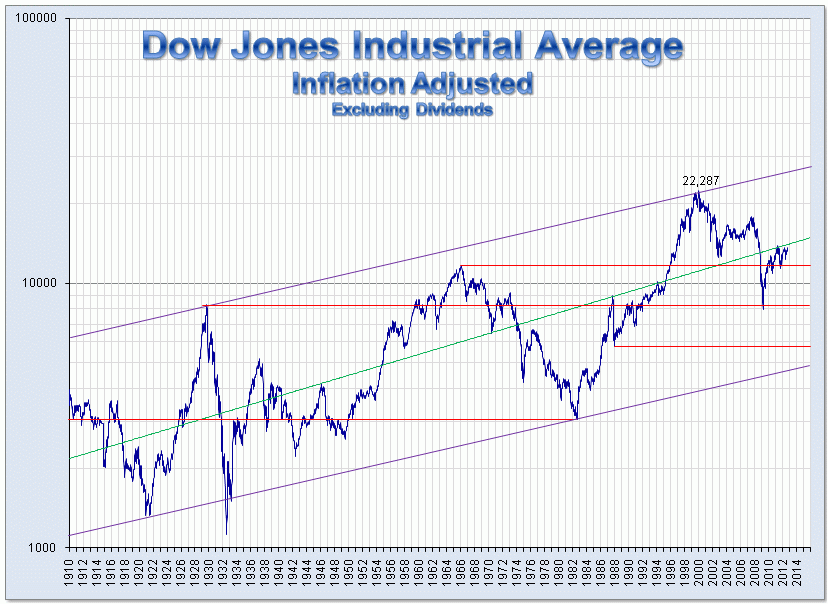
The graph below shows the closing DJIA value each year since 1910, adjusted for inflation, in 2012 dollars. Although the DJIA didn't close at 22,287 in 2000 or 4000 in 1910, adjusting these values for inflation allows us to compare them directly and calculate real returns. For example, a $1000 investment in 1910 would be worth $3,276 on December 31, 2012 (13,104-4000/4000=2.276.) The following data points are particularly interesting:
So where is the stock market going from here? The next 2 decades will be challenging for the US economy and the stock market for several reasons (see 3 Macro Cycles Will Decimate Stock Returns in 2010?s, 20?s). There is plenty of room for the DJIA to decline further in real terms. This could come in big chunks, with the DJIA dropping to 10,000, 8,000 or all the way back to 1982 levels. Or, a longer, slower process with flat or modest market increases and 3-5% annual inflation. In either scenario, real returns after inflation will be negative. Having said this and to provide some perspective, let's go "best case" with the DJIA advancing to 23,000 by 2023. Assuming 3% inflation, the annual growth rate of 5.56% results in a real return of 2.56%. Not bad and slightly above the historical average of 1.9% but nowhere near 10%.
Now that you have all these insights, what should you do? First, the standard disclaimer, if you have a system for investing in the market that consistently beats the DJIA and the target return in your retirement plan after adjusting for inflation, carry on! For everyone else:
- Lower the target return in your retirement plan (and/or increase the inflation rate) so the real rate of return is closer to the 1.9% average. Immediately recalculate and adjust your savings or spending so you have as much time as possible to recover.
- Move at least some of your funds out of the stock market. Find other investments that offer better real returns (like income producing property, IncP) and ask your certified financial planner for suggestions.
- In the future, after the DJIA cycles down in real terms, reinvest and ride what hopefully will be the greatest bull market, ever! If you "stay the course," the 10% returns you'll earn in the next bull market will provide insufficient compensation for the negative real returns you've endured over the last 5, 10 or 20 years!
If you think I’m “cooking” the numbers, Google this article from the Wall Street Journal entitled Adjusted for Inflation, Dow’s Gains Are Puny, which says, “Stock analysts sometimes like to note that the Dow today is worth 27 times its value at its 1929 pre-crash peak, meaning that even if you bought at the worst moment, your stock still would be way up over time. In inflation-adjusted terms, however, the Dow today is only a little over twice its 1929 peak, according to Ned Davis Research.”
If you have a comment or question, please reply below. If this post could be of value to someone you know, please LIKE and email or repost to Facebook, LinkedIn or your favorite social network. I will not share your personal data with anyone for any purpose.
Dividends, transaction costs and other fees are assumed to offset or cancel and were not included in this analysis. The source of the inflation data is US Bureau of Labor Statistics and Robert Schiller. I used an Inflation Calculator for convenience with the calculations which might produce slightly different results. The source of my DJIA closing data is the fedprimerate.com website and the Inflation Adjusted DJIA graph is Fred’s Intelligent Bear.


Comments