
Looking Back at Quincy MA's RE Market 2019-2022
Quincy is a densely populated suburb (~100,000 people) of Boston. It’s also where Dunkin Donuts started. Here’s a look back at Quincy’s RE market over the past 3 years.
About the Data
I'm not a realtor with access to the MLS, so the data behind this post comes from Zillow and may therefore be incomplete and/or compel you to algorithmically overpay for billions of dollars of real estate.
The data is comprised of 2067 properties (e.g. condos, SFH, MFH) sold in Quincy in the last 3 years.
Prices Went Up
First let’s look at the monthly median sale price over this period:
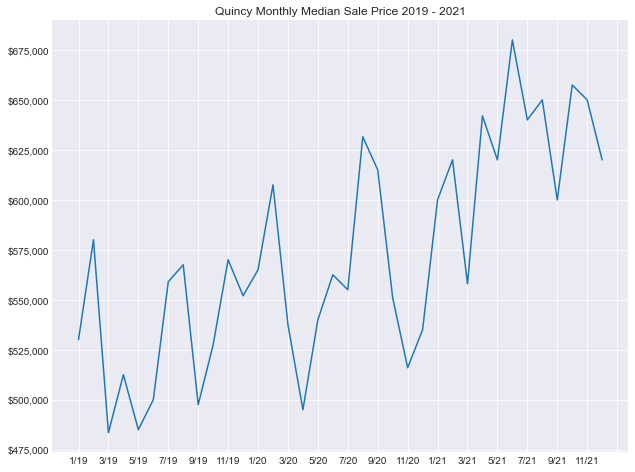
A little choppy, but things are generally up and to the right as you’d expect. I think the chop is due to having a relatively small number of monthly data points. The monthly price per square foot graph is a bit smoother:
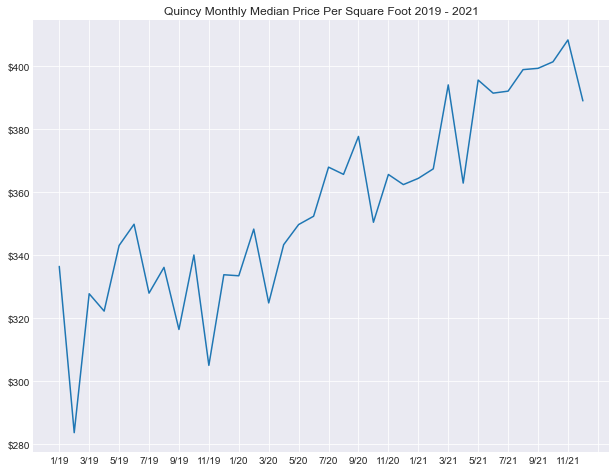
So a square foot goes from costing ~$300 to about ~$400 in 3 years, a 33% increase over that time for a CAGR of just over 10%.
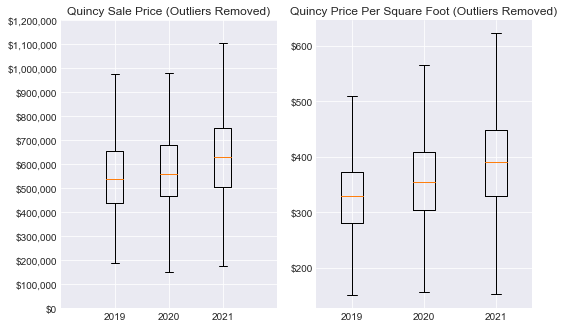
Here are the corresponding yearly box plots:
The Market Got Frothier
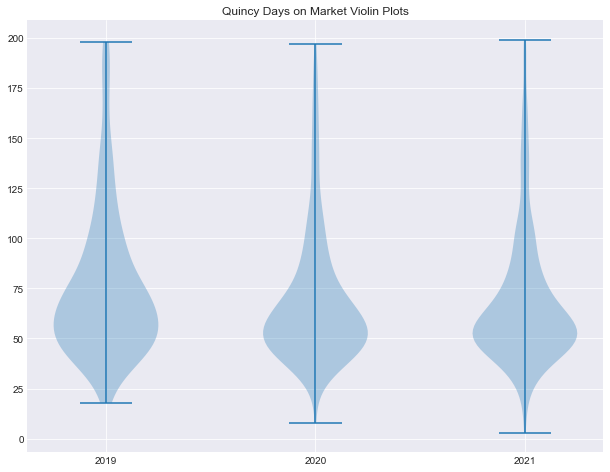
Median days on market of sold properties fell from 67 in 2019 to 59 in 2020 to 57 in 2021. You can see in the violin plot that compared to 2019, the long tail of slow-selling properties gets visibly thinner in 2020 and 2021:
The closing price vs. list price graph further highlights increasing frothiness in the market:
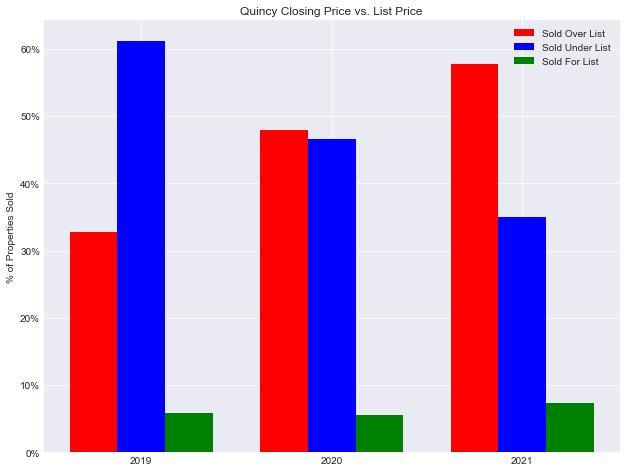
Properties that sold for the highest percentage over list:
Listed 7/17/2021 for $589,000, sold 9/8/2021 for $753,000 (27.8% over list)
Listed 11/4/2021 for $399,900, sold 12/14/2021 for $504,200 (26.1% over list)
Listed 7/16/2021 for $524,900, sold 8/19/2021 for $650,000 (23.8% over list)
Properties that sold for the highest percentage under list:
Listed 7/18/2018 for $539,900, sold 2/1/2019 for $300,000 (44.4% under list)
Listed 7/27/2020 for $1,950,000, sold 11/30/2020 for $1,250,000 (35.9% under list)
Listed 6/20/2019 for $749,900, sold 12.30/2019 for $530,000 (29.3% under list)
Wrap Up
Nothing unexpected fell out of the data; prices increased considerably and the Quincy market got hot during a time of historic asset appreciation nationwide. Nevertheless, it was interesting to quantify this trend for a specific real estate market.
I’d like to do more market data analysis, if you have any ideas for interesting metrics or specific RE markets you’d like me to take a look at let me know!
Happy 2022!