
$990,000
Investment Summary
- Monthly Cash Flow
- -$2,811
- Cap Rate
- 2.7%
- Cash-on-Cash Return
- -14.8%
- Debt Coverage Ratio
- 0.45
- Internal Rate of Return (5 years)
- -10.3%
Cash Flow
Net Operating Income (NOI) minus mortgage payments.
Calculation:
NOI - Mortgage Payments
Cap Rate (Market Value)
Capitalization Rate is a rate of return that compares the yearly Net Operating Income (NOI) to the market value.
Calculation:
NOI / Market Value
Cash-on-Cash Return (CoC)
Annual Cash Flow / Cash Invested
Calculation:
Annual cash flow divided by initial cash invested.
Debt Coverage Ratio (DCR)
Net Operating Income (NOI) divided by total debt payments.
Calculation:
NOI / Total Debt Payments
Internal Rate of Return (IRR)
A metric for assessing profitability over time. IRR is the discount rate at which the net present value (NPV) of all future cash flows (positive and negative) from an investment equals zero — including both periodic cash flow (such as rent) and a projected sale at the end of the holding period. It represents the expected annualized return, accounting for income, expenses, and the recovery of capital through a future sale.
Property Description
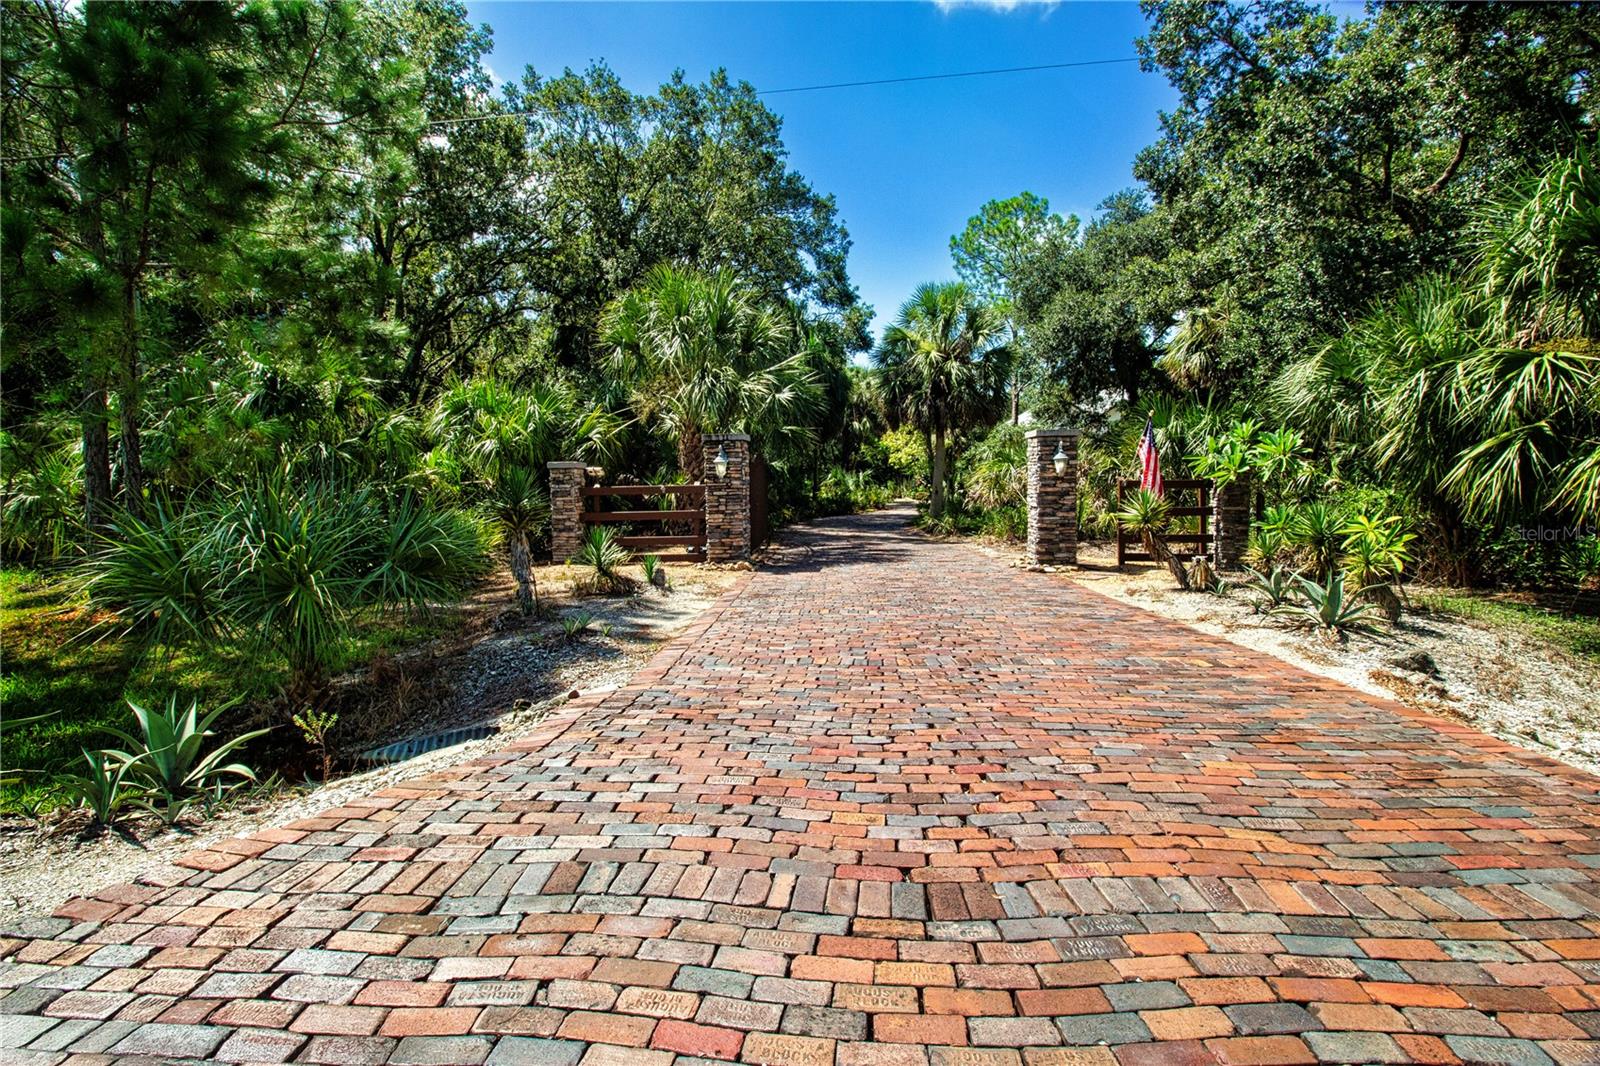
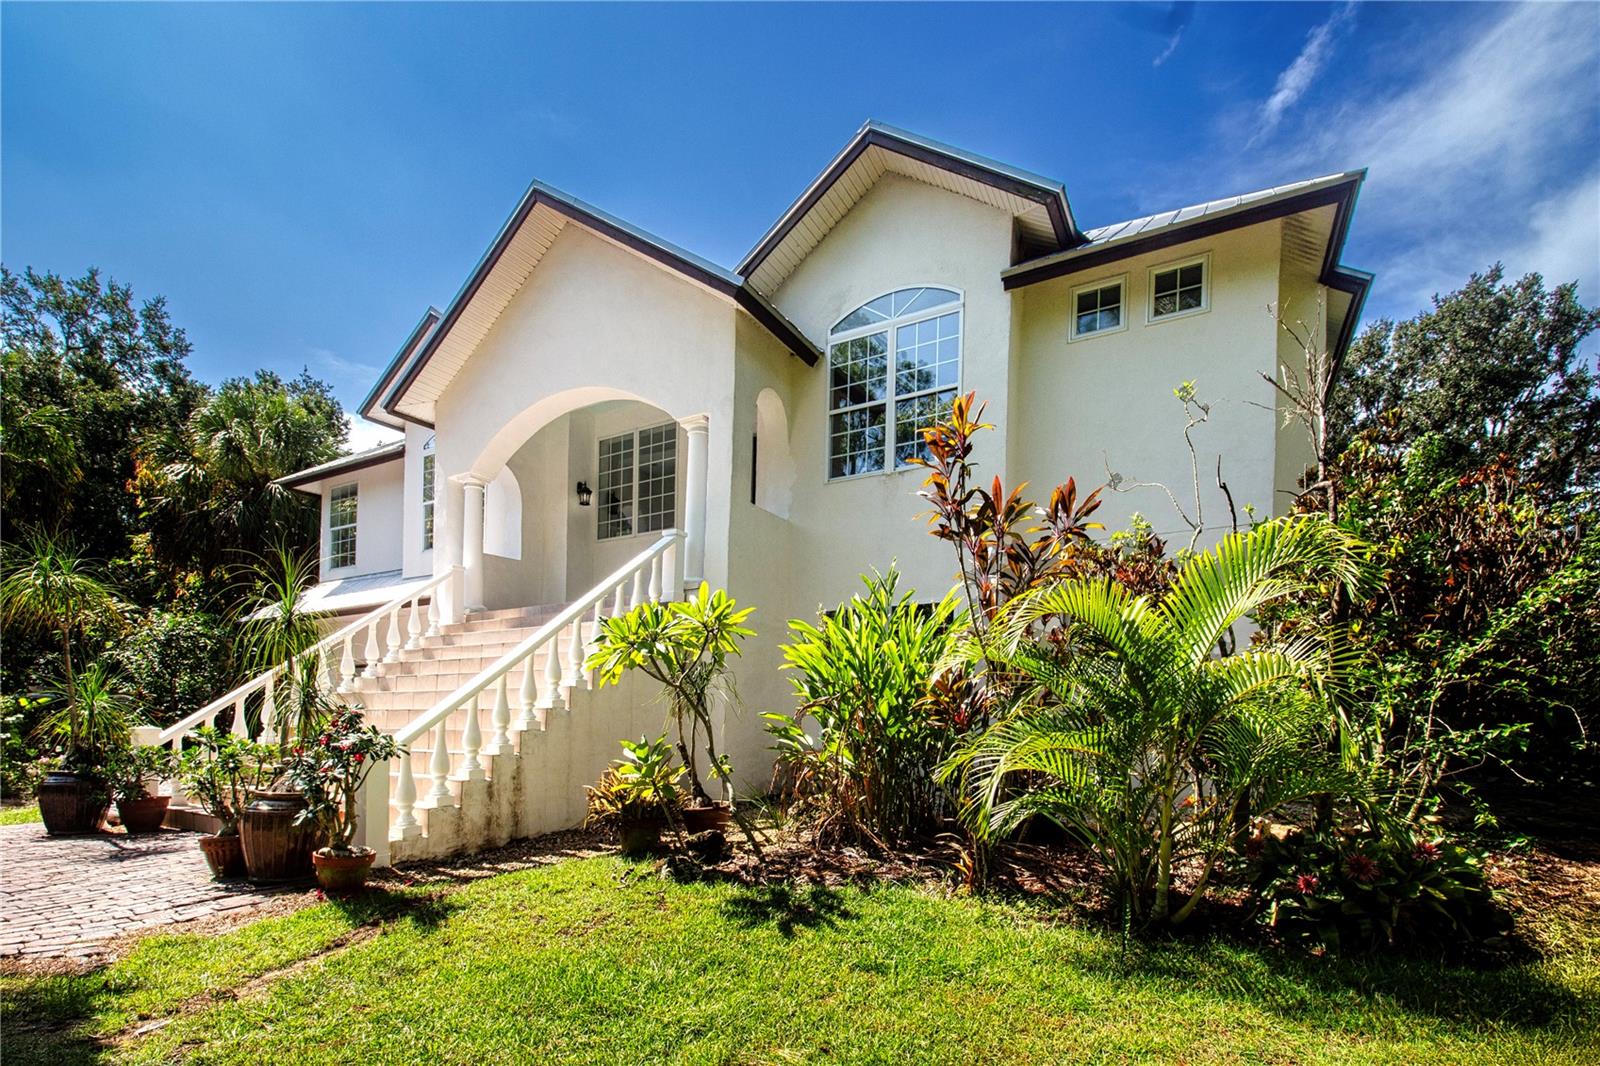
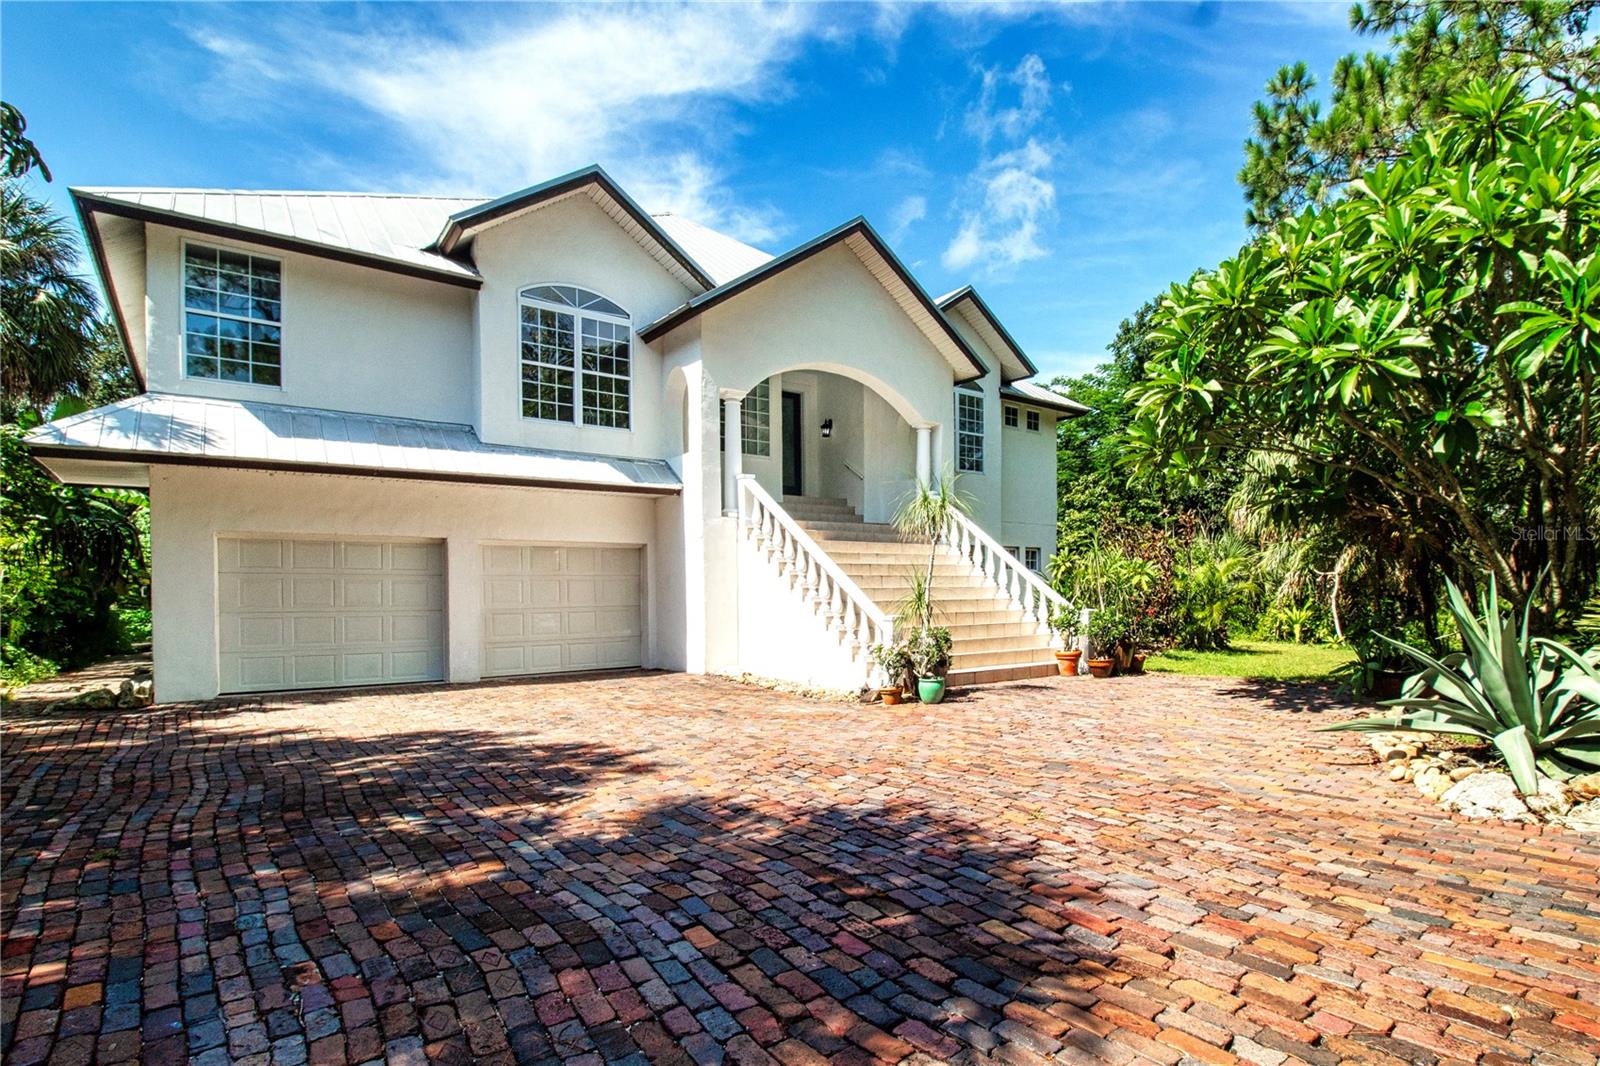
One or more photo(s) has been virtually staged. HONEY! STOP THE CAR! THE PRICE IS REDUCED! Experience the tranquility of this KEY WEST STYLE ESTATE HOME, situated on an expansive FOUR AND A HALF ACRES IN AN X FLOOD ZONE within the sought after COMMUNITY OF SUNDANCE. As you proceed through the stone pillars and GATED ENTRANCE along the paved driveway of this estate, you will be impressed by its distinguished presence. From the stone staircase and beautifully etched front door, which serves as the prominent focal point to the ornate metal roof and balcony off the back of this home that captures tons of serene wildlife. The property features 3,600 HEATED square feet of thoughtfully designed interior living space, complemented by an ADDITIONAL 2,000 square feet of covered outdoor area. This residence offers FOUR BEDROOMS, THREE FULL BATHROOMS, and includes a TWO CAR ATTACHED GARAGE. The first floor features a space that could READILY CONVERTED INTO AN IN-LAW APARTMENT, complete with a spacious bedroom, living area, and FRENCH DOORS OPENING TO A COVERD PATIO. This area includes a full bathroom, a private entrance to the garage, and separate access to the main living area upstairs. Upon ascending the stairs, you are greeted by an expansive OPEN CONCEPR KITCHEN LIVINGROOM COMBO area featuring a wall of distinguished French doors that have views of the backyard and PROVIDES ACCESS TO THE 50 FT BALCONY with ELEGANT IRON RAILINGS. The kitchen is thoughtfully designed with GRANITE COUNTER TOPS AND STAINLESS STEEL APPLIANCES, custom cabinetry, and a generous walk-in pantry, complemented by a breakfast nook and breakfast bar. The spacious living room, complete with CUSTOM BUILT IN'S, VAULTED CEILING offers a refined environment for relaxation. Adjacent to the kitchen, A FORMAL DINING AREA presents scenic views of the tranquil front yard. The PRIMARY BEDROOM offers an EQUISITE BATHROOM, a spacious walk-in closet, and scenic views of nature through FRENCH DOORS THAT OPEN TO THE BALCONY. With this SPLIT FLOOR PLAN, the opposite side of the home features two additional bedrooms, a guest bathroom, and a laundry room. SUNDANCE is an exclusiveRIVERFRONT AND EQUESTION COMMUNITY featuring a PRIVATE MARINA AND BOAT LAUNCH. Residents enjoy access to TWO DOCKS equipped with running water and electricity, situated on the LITTLE MANATEE RIVER JUST MINUTES FROM THE BAY. This community includes a BARN with 20 STALLS and 9 PADDOCKS, adjacent to the LITTLE MANATEE STATE PARK, which features extensive riding trails. There is also a COMMUNITY PARK covering THREE ACRES at the front of the community. The community organizes several annual events, including a Halloween party, a spring picnic, and parades during Christmas involving horses and golf carts. All for only $241 Annually. Do not pass up this amazing opportunity to love where you live. CALL FOR A PRIVATE SHOWING TODAY! Metal shed does not convey
Build Your Team
Quickly find investor-friendly professionals who can help you succeed in real estate investing at any stage of the investing journey.


Agents
Match with investor-friendly agents who can help you find, analyze, and close your next deal


Lenders
Get the best funding…find investor-friendly lenders who specialize in your deal strategy


Property Managers
Transition to passive investing. Find a trusted property management partnership that lasts.


Tax Pros & Accountants
Taxes and financial reporting made easy—find experts to create tax savings strategies, file taxes, and more
Location
Property Details
Parking
- Description: Garage
- Details: Driveway, Garage Door Opener, Attached
- Garage Spaces: 2
- Spaces Total: 0
Bedroom Information
- # of Bedrooms: 4
Bathroom Information
- # of Baths (Full): 3
- # of Baths (Total): 3.0
Interior Features
- # of Rooms: 13
- # of Stories: 2
Exterior Features
- Exterior Walls Materials: Stucco
- Foundation: Slab
- Roof Type: Gable or Hip
- Roof Material: Metal
HOA
- Has HOA: Yes
- Association: Russell OConnor
- HOA Fee: $241/annually
Land Information
- Land Use: Residential
- Land Use Subtype: Single Family Residential
Lot Information
- Parcel ID: U3432192140000E30029A0
- Lot Size: 198634 sqft
Property Information
- Property Type: Single Family Residence
- Style: Contemporary, Craftsman, Custom, Key West
- Year Built: 2004
Tax Information
- Annual Tax: $4,928
Utilities
- Water & Sewer: Private, Well
- Heating: Central
- Cooling: Central Air
Location
- County: Hillsborough
Listing Details
Investment Summary
- Monthly Cash Flow
- -$2,811
- Cap Rate
- 2.7%
- Cash-on-Cash Return
- -14.8%
- Debt Coverage Ratio
- 0.45
- Internal Rate of Return (5 years)
- -10.3%
Cash Flow
Net Operating Income (NOI) minus mortgage payments.
Calculation:
NOI - Mortgage Payments
Cap Rate (Market Value)
Capitalization Rate is a rate of return that compares the yearly Net Operating Income (NOI) to the market value.
Calculation:
NOI / Market Value
Cash-on-Cash Return (CoC)
Annual Cash Flow / Cash Invested
Calculation:
Annual cash flow divided by initial cash invested.
Debt Coverage Ratio (DCR)
Net Operating Income (NOI) divided by total debt payments.
Calculation:
NOI / Total Debt Payments
Internal Rate of Return (IRR)
A metric for assessing profitability over time. IRR is the discount rate at which the net present value (NPV) of all future cash flows (positive and negative) from an investment equals zero — including both periodic cash flow (such as rent) and a projected sale at the end of the holding period. It represents the expected annualized return, accounting for income, expenses, and the recovery of capital through a future sale.
Purchase Details
Purchase PriceThe price paid for the property. Purchase price:
| $990,000 |
|---|---|
Amount FinancedThe amount of the purchase financed through a loan. Amount financed:
| -$792,000 |
Down paymentThe initial payment made towards the purchase. Down payment:
| $198,000 |
Closing CostsFees and expenses associated with purchasing a property, typically ranging from 2% to 5% of the home’s purchase price, paid at the end of a home purchase to cover services like lending, title transfer, and taxes. Closing costs:
| $29,700 |
Rehab CostsCosts incurred to repair or improve the property, including: roof, flooring, exterior siding, kitchen, exterior paint, bathrooms, etc. Rehab costs:
| $0 |
Initial Cash InvestedThe total initial cash invested in the property. Calculation:Down payment + Buying costs + Rehab costs Initial cash invested:
| $227,700 |
Square Feet (SQFT)The total square footage of the property. Square feet:
| 3,615 |
Cost Per Square FootCost per square foot of the property. Calculation:Purchase Price / Square Feet Cost per square foot:
| $274 |
Monthly Rent Per Square FootMonthly rent divided by the number of square feet. This ratio helps investors compare rental income efficiency across properties, markets, and unit sizes Calculation:Monthly Rent / Square Feet Monthly rent per square foot:
| $1.08 |
Financing Details
Loan AmountThe total sum of money borrowed from a lender to finance a property purchase. Calculation:Purchase Price - Down Payment
Loan amount:
| $792,000 |
|---|---|
Loan to Value Ratio (LTV)Loan amount divided by the market value of the property. Calculation:Loan Amount / Market Value
Loan to value ratio:
| 80.0% |
Loan TypeThe type of loan (e.g., fixed, adjustable).
Loan type:
| Amortizing |
TermThe loan repayment period in years.
Term:
| 30 years |
Interest RateThe percentage a lender charges on the borrowed amount of a loan, determining the cost of borrowing money.
Interest rate:
| 6.625% |
Principal & Interest (PI)The principal is the portion of the loan payment that reduces the loan balance. The interest is the lender's charge for borrowing money. Calculation:(P * r * (1 + r) ** n) / ((1 + r) ** n - 1) Where:
P = Loan amount (principal)
Principal & interest:
| $5,071 |
Property TaxesAnnual taxes levied by local governments on real estate properties. These taxes fund public services like schools, roads, and emergency services.
Property tax:
| $411 |
InsuranceThe costs for insurance coverage to protect against financial losses due to risks like fire, natural disasters, theft, liability, or tenant-related damages. Calculation:Assumes 7% of gross rental income, unless insurance rates are specified.
Insurance:
| $273 |
Private Mortgage Insurance (PMI)A fee that borrowers pay when they take out a conventional loan with a loan-to-value (LTV) ratio above 80%.
Private mortgage insurance (PMI):
| $0 |
Monthly PaymentThe fixed amount a borrower pays each month to repay a loan. It typically includes principal and interest (P&I) and may also cover property taxes, insurance, HOA fees, and PMI if escrowed. Monthly payment:
| $5,755 |
Operating Income
| % Rent | Monthly | Yearly | |
|---|---|---|---|
Gross RentThe total rental income received from tenants before deducting any expenses. Includes base rent, late fees, pet fees, parking fees, and other recurring charges.
Gross rent:
| $3,900 | $46,800 | |
Vacancy LossExpected loss of rent due to vacancies.
Vacancy loss:
(6%)
| 6% | -$234 | -$2,808 |
Operating IncomeGross rental income minus vacancy loss. Calculation:Gross rent - Vacancy loss
Operating income:
| $3,666 | $43,992 |
Operating Expenses
| % Rent | Monthly | Yearly | |
|---|---|---|---|
Property TaxesAnnual taxes levied by local governments on real estate properties. These taxes fund public services like schools, roads, and emergency services. | 11% | -$411 | -$4,928 |
InsuranceThe costs for insurance coverage to protect against financial losses due to risks like fire, natural disasters, theft, liability, or tenant-related damages. Calculation:Assumes 7% of gross rental income, unless insurance rates are specified. | 7% | -$273 | -$3,276 |
Property ManagementThe costs associated with hiring a property manager to handle the day-to-day operations of a rental property. Includes management fees, leasing fes, eviction fees, etc. Calculation:Assumes 8% of gross rental income. | 8% | -$312 | -$3,744 |
Repairs & MaintenanceOngoing costs for routine upkeep and minor fixes needed to keep a property in good working condition. Calculation:Assumes 5% of gross rental income. Varies by property age and condition. | 5% | -$195 | -$2,340 |
Capital ExpensesLarge, infrequent costs for major improvements or replacements, like a new roof, HVAC system, or appliances. Calculation:Assumes 5% of gross rental income. Varies by property age. | 5% | -$195 | -$2,340 |
HOA FeesRegular dues paid to a Homeowners Association for community maintenance, amenities, and management. Similar fees include: Condo Association Fees, Co-op Maintenance Fees, etc. | 1% | -$20 | -$240 |
Operating ExpensesRecurring costs required to maintain and manage a rental property, including property taxes, insurance, maintenance, repairs, utilities (if paid by the owner), property management fees, and other day-to-day expenses. Calculation:Insurance + Property Taxes + Property Management + Repairs & Maintenance + Capital Expenditures + HOA Fees | 36% | -$1,406 | -$16,868 |
Cash Flow
| Monthly | Yearly | |
|---|---|---|
Net Operating Income (NOI)The income generated from a property after deducting all operating expenses but before deducting mortgage payments, taxes, and capital expenditures. Calculation:Gross Operating Income - Operating Expenses
Net operating income:
| $2,260 | $27,120 |
Mortgage PaymentThe fixed amount a borrower pays each month to repay a loan. It typically includes principal and interest (P&I) and may also cover property taxes, insurance, HOA fees, and PMI if escrowed. | -$5,071 | -$60,852 |
Cash FlowNet Operating Income (NOI) minus mortgage payments. Calculation:NOI - Mortgage Payments | -$2,811 | -$33,732 |