46202 Investment Properties for Sale
Browse homes for sale and investment properties in 46202. Refine your search by price, property type, or more.
Best cash flowing properties in 46202

Active
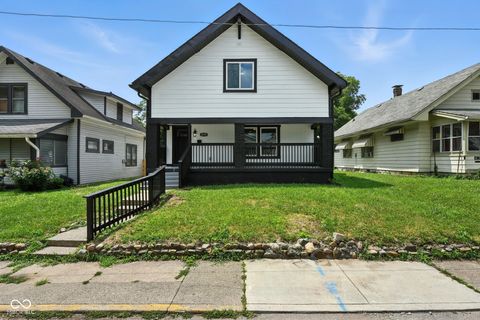
$65,000
3
bds
|
1
ba
|
1,056
sqft
|
built
1926
2134 Dr Andrew J Brown Ave, Indianapolis, IN 46202
$759
Cash flow
13.6%
Cash-on-Cash Return
14.0%
Cap rate
1.7%
Rent to Value Ratio
Active
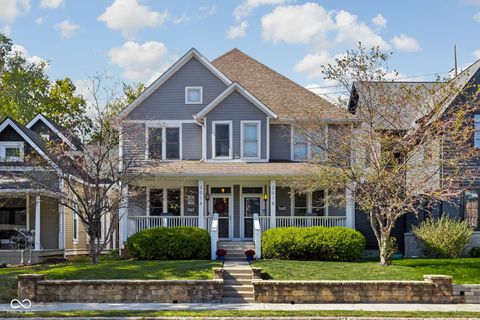
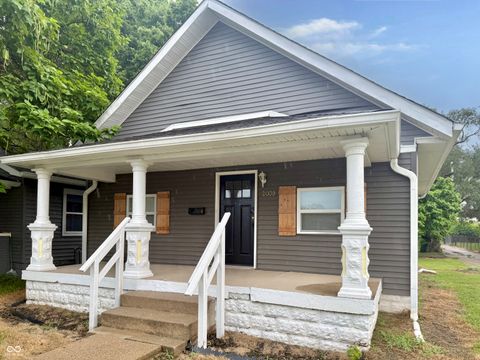
$389,000
3
bds
|
3
ba
|
2,767
sqft
|
built
1910
1330 Marlowe Ave, Indianapolis, IN 46202
$491
Cash flow
6.6%
Cash-on-Cash Return
7.7%
Cap rate
0.9%
Rent to Value Ratio
80 out of 91 properties for sale in 46202
Limited Results Shown
Create a free account, or log in to reveal all property listings and enjoy the complete experience.
Active
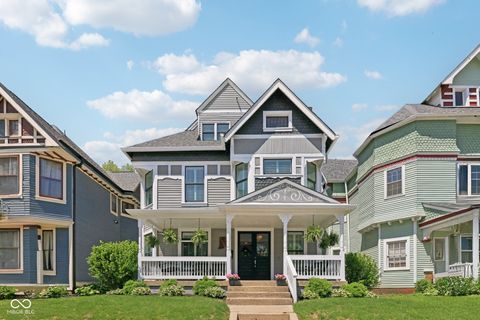
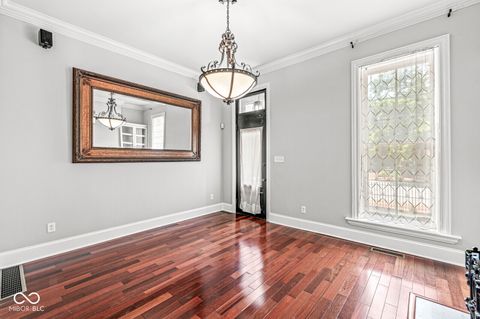
$1,149,000
5
bds
|
5
ba
|
4,895
sqft
|
built
1896
2050 N Alabama St, Indianapolis, IN 46202
$-3,955
Cash flow
-18.0%
Cash-on-Cash Return
2.0%
Cap rate
0.2%
Rent to Value Ratio
Active
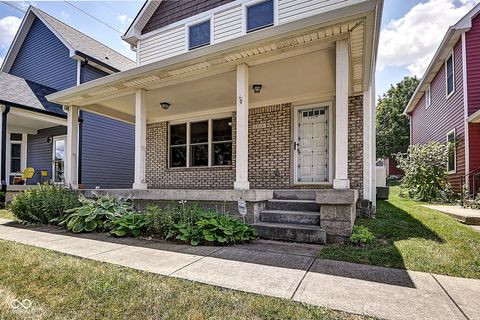
$215,000
1
bds
|
2
ba
|
998
sqft
|
built
2006
1635 N College Ave, Indianapolis, IN 46202
$-159
Cash flow
-3.9%
Cash-on-Cash Return
5.3%
Cap rate
0.8%
Rent to Value Ratio
Active
$899,000
3
bds
|
4
ba
|
4,173
sqft
|
built
2018
1818 N Pennsylvania St, Indianapolis, IN 46202
$-700
Cash flow
-4.1%
Cash-on-Cash Return
5.2%
Cap rate
0.7%
Rent to Value Ratio
Active
$799,000
4
bds
|
3
ba
|
2,184
sqft
|
built
1890
847 N Park Ave, Indianapolis, IN 46202
$-1,678
Cash flow
-11.0%
Cash-on-Cash Return
3.6%
Cap rate
0.4%
Rent to Value Ratio
Active
$899,900
5
bds
|
4
ba
|
4,923
sqft
|
built
1894
1616 N Delaware St, Indianapolis, IN 46202
$-2,402
Cash flow
-13.9%
Cash-on-Cash Return
2.9%
Cap rate
0.4%
Rent to Value Ratio
Active
$285,000
2
bds
|
2
ba
|
1,016
sqft
|
built
1920
1727 N New Jersey St, Indianapolis, IN 46202
$-52
Cash flow
-1.0%
Cash-on-Cash Return
5.9%
Cap rate
0.8%
Rent to Value Ratio
Active
$764,000
4
bds
|
4
ba
|
3,039
sqft
|
built
2020
2026 Alvord St, Indianapolis, IN 46202
$-464
Cash flow
-3.2%
Cash-on-Cash Return
5.4%
Cap rate
0.7%
Rent to Value Ratio
Active
$485,000
3
bds
|
4
ba
|
3,366
sqft
|
built
2008
2016 Central Ave, Indianapolis, IN 46202
$0
Cash flow
0.0%
Cash-on-Cash Return
6.1%
Cap rate
0.7%
Rent to Value Ratio
Active
$338,900
3
bds
|
2
ba
|
1,304
sqft
|
built
1886
514 Dorman St, Indianapolis, IN 46202
$-218
Cash flow
-3.4%
Cash-on-Cash Return
5.4%
Cap rate
0.6%
Rent to Value Ratio
Active
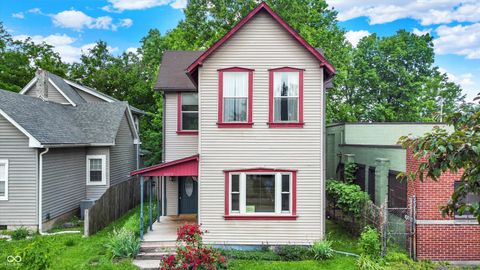
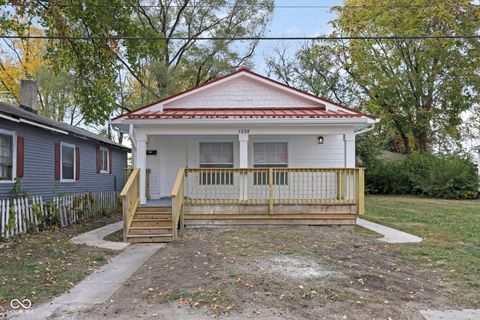
$219,900
3
bds
|
3
ba
|
1,750
sqft
|
built
1924
1208 W 18th St, Indianapolis, IN 46202
$-229
Cash flow
-5.4%
Cash-on-Cash Return
4.9%
Cap rate
0.6%
Rent to Value Ratio
Active
$275,000
2
bds
|
1
ba
|
756
sqft
|
built
1986
2021 Columbia Ave, Indianapolis, IN 46202
$-305
Cash flow
-5.8%
Cash-on-Cash Return
4.8%
Cap rate
0.6%
Rent to Value Ratio
Active
$369,000
2
bds
|
2
ba
|
1,120
sqft
|
built
1982
324 E 7th St, Indianapolis, IN 46202
$-694
Cash flow
-9.8%
Cash-on-Cash Return
3.9%
Cap rate
0.5%
Rent to Value Ratio
Active
$379,000
2
bds
|
2
ba
|
1,462
sqft
|
built
1910
430 N Park Ave, Indianapolis, IN 46202
$-864
Cash flow
-11.9%
Cash-on-Cash Return
3.4%
Cap rate
0.7%
Rent to Value Ratio
Active
$240,000
1
bds
|
1
ba
|
1,000
sqft
|
built
1920
970 Fort Wayne Ave, Indianapolis, IN 46202
$-206
Cash flow
-4.5%
Cash-on-Cash Return
5.1%
Cap rate
0.8%
Rent to Value Ratio
Active
$325,000
2
bds
|
2
ba
|
1,120
sqft
|
built
1982
342 E Arch St, Indianapolis, IN 46202
$-619
Cash flow
-9.9%
Cash-on-Cash Return
3.9%
Cap rate
0.6%
Rent to Value Ratio
Active
$294,000
4
bds
|
3
ba
|
2,047
sqft
|
built
1925
2000 N Dexter St, Indianapolis, IN 46202
$-402
Cash flow
-7.1%
Cash-on-Cash Return
4.5%
Cap rate
0.5%
Rent to Value Ratio
Active
$174,900
2
bds
|
1
ba
|
948
sqft
|
built
1920
2009 Gent Ave, Indianapolis, IN 46202
$208
Cash flow
6.2%
Cash-on-Cash Return
7.6%
Cap rate
0.9%
Rent to Value Ratio
Active
$775,000
4
bds
|
5
ba
|
3,965
sqft
|
built
1890
331 N East St, Indianapolis, IN 46202
$-1,210
Cash flow
-8.1%
Cash-on-Cash Return
4.3%
Cap rate
0.5%
Rent to Value Ratio
Active
$425,000
3
bds
|
3
ba
|
2,092
sqft
|
built
2004
1319 E Michigan St, Indianapolis, IN 46202
$-383
Cash flow
-4.7%
Cash-on-Cash Return
5.1%
Cap rate
0.6%
Rent to Value Ratio
Active
$650,000
5
bds
|
4
ba
|
4,556
sqft
|
built
2008
608 E 21st St, Indianapolis, IN 46202
$-915
Cash flow
-7.3%
Cash-on-Cash Return
4.5%
Cap rate
0.5%
Rent to Value Ratio
Active
$275,000
3
bds
|
2
ba
|
1,592
sqft
|
built
1900
2161 N Meridian St, Indianapolis, IN 46202
$-59
Cash flow
-1.1%
Cash-on-Cash Return
5.9%
Cap rate
0.9%
Rent to Value Ratio
Active
$599,900
4
bds
|
4
ba
|
2,470
sqft
|
built
2020
1935 Cornell Ave, Indianapolis, IN 46202
$-865
Cash flow
-7.5%
Cash-on-Cash Return
4.4%
Cap rate
0.5%
Rent to Value Ratio
Active
$299,000
1
bds
|
1
ba
|
1,197
sqft
|
built
1910
430 N Park Ave, Indianapolis, IN 46202
$-715
Cash flow
-12.5%
Cash-on-Cash Return
3.3%
Cap rate
0.7%
Rent to Value Ratio
Active
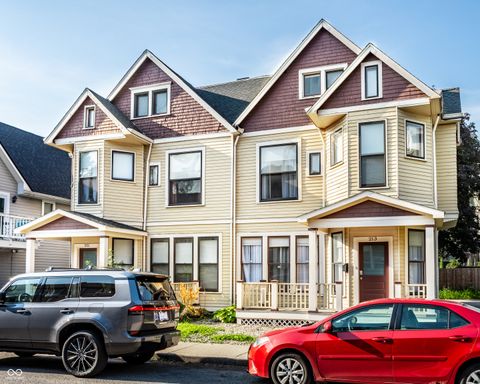
$399,000
3
bds
|
4
ba
|
1,536
sqft
|
built
1905
213 E 15th St, Indianapolis, IN 46202
$-319
Cash flow
-4.2%
Cash-on-Cash Return
5.2%
Cap rate
0.6%
Rent to Value Ratio
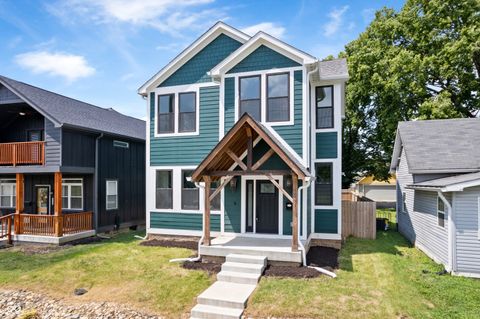
Active
$399,900
4
bds
|
3
ba
|
2,955
sqft
|
built
2024
1718 Milburn St, Indianapolis, IN 46202
$160
Cash flow
2.1%
Cash-on-Cash Return
6.6%
Cap rate
0.8%
Rent to Value Ratio
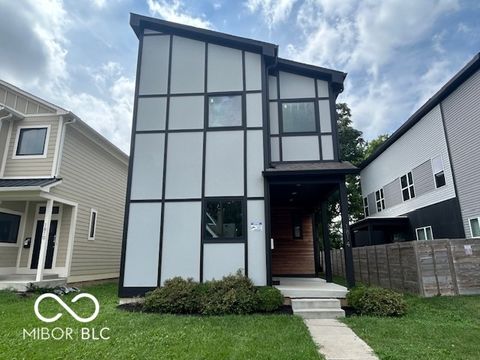
Active
$625,000
4
bds
|
4
ba
|
4,035
sqft
|
built
2018
1814 Bellefontaine St, Indianapolis, IN 46202
$-718
Cash flow
-6.0%
Cash-on-Cash Return
4.8%
Cap rate
0.6%
Rent to Value Ratio

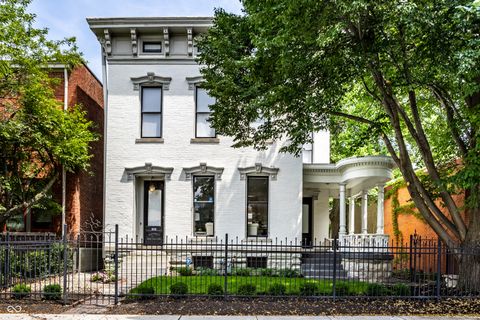
Active
$599,900
3
bds
|
4
ba
|
2,374
sqft
|
built
2023
711 E 16th St, Indianapolis, IN 46202
$-764
Cash flow
-6.6%
Cash-on-Cash Return
4.6%
Cap rate
0.6%
Rent to Value Ratio
Active
$1,250,000
5
bds
|
6
ba
|
5,227
sqft
|
built
1880
214 E Saint Joseph St, Indianapolis, IN 46202
$-1,573
Cash flow
-6.6%
Cash-on-Cash Return
4.6%
Cap rate
0.6%
Rent to Value Ratio

Active
$349,400
2
bds
|
2
ba
|
1,240
sqft
|
built
1910
430 N Park Ave, Indianapolis, IN 46202
$-721
Cash flow
-10.8%
Cash-on-Cash Return
3.7%
Cap rate
0.7%
Rent to Value Ratio
Active
$284,900
3
bds
|
3
ba
|
1,344
sqft
|
built
2010
2053 Bellefontaine St, Indianapolis, IN 46202
$59
Cash flow
1.1%
Cash-on-Cash Return
6.4%
Cap rate
0.8%
Rent to Value Ratio
Active
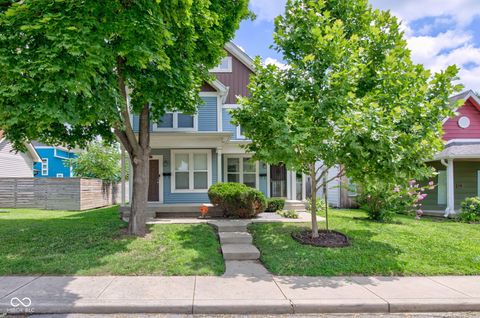
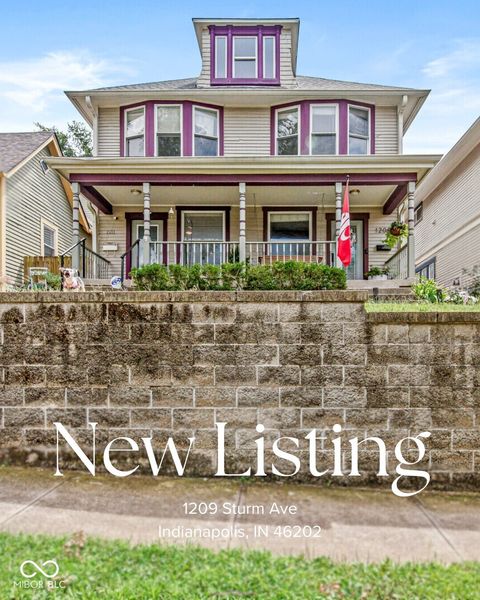
$325,000
2
bds
|
2
ba
|
1,567
sqft
|
built
1910
1209 Sturm Ave, Indianapolis, IN 46202
$-447
Cash flow
-7.2%
Cash-on-Cash Return
4.5%
Cap rate
0.7%
Rent to Value Ratio
Active
$444,000
3
bds
|
3
ba
|
2,226
sqft
|
built
1910
1531 N College Ave, Indianapolis, IN 46202
$-342
Cash flow
-4.0%
Cash-on-Cash Return
5.2%
Cap rate
0.6%
Rent to Value Ratio
Active
$749,900
4
bds
|
4
ba
|
3,386
sqft
|
built
2019
1717 Carrollton Ave, Indianapolis, IN 46202
$-1,081
Cash flow
-7.5%
Cash-on-Cash Return
4.4%
Cap rate
0.5%
Rent to Value Ratio
Active
$265,000
3
bds
|
1
ba
|
1,352
sqft
|
built
1890
726 Dorman St, Indianapolis, IN 46202
$-184
Cash flow
-3.6%
Cash-on-Cash Return
5.3%
Cap rate
0.6%
Rent to Value Ratio
Active
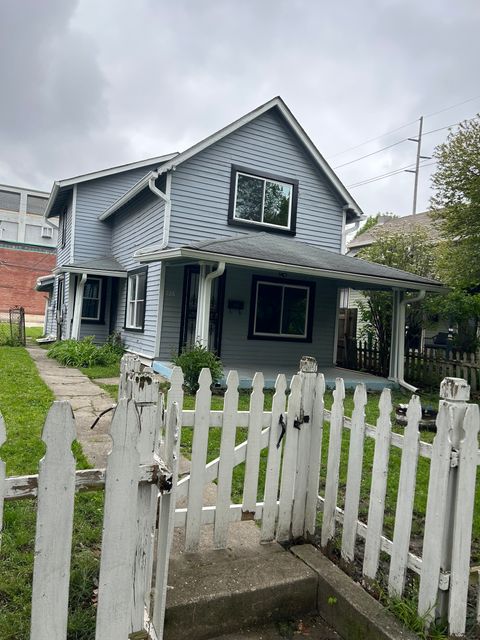
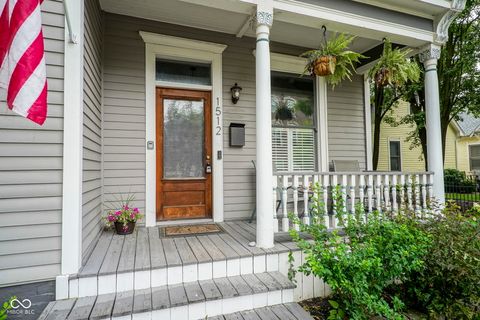
$589,000
4
bds
|
3
ba
|
2,450
sqft
|
built
1892
1512 Bellefontaine St, Indianapolis, IN 46202
$-1,085
Cash flow
-9.6%
Cash-on-Cash Return
3.9%
Cap rate
0.5%
Rent to Value Ratio
Active
$569,900
3
bds
|
3
ba
|
2,740
sqft
|
built
2021
2008 Yandes St, Indianapolis, IN 46202
$-504
Cash flow
-4.6%
Cash-on-Cash Return
5.1%
Cap rate
0.6%
Rent to Value Ratio
Active
$225,000
1
bds
|
1
ba
|
880
sqft
|
built
2008
233 E Saint Joseph St, Indianapolis, IN 46202
$-363
Cash flow
-8.4%
Cash-on-Cash Return
4.2%
Cap rate
0.8%
Rent to Value Ratio
Active
$1,025,000
3
bds
|
4
ba
|
3,759
sqft
|
built
2005
1510 Central Ave, Indianapolis, IN 46202
$-2,146
Cash flow
-10.9%
Cash-on-Cash Return
3.6%
Cap rate
0.4%
Rent to Value Ratio