60626 Investment Properties for Sale
Browse homes for sale and investment properties in 60626. Refine your search by price, property type, or more.
Best cash flowing properties in 60626

Active
$140,000
1
bds
|
1
ba
|
600
sqft
|
built
1925
7035 N Sheridan Rd, Chicago, IL 60626
$60
Cash flow
2.2%
Cash-on-Cash Return
6.2%
Cap rate
1.0%
Rent to Value Ratio

Active
$185,000
1
bds
|
1
ba
|
800
sqft
|
built
1970
1340 W Touhy Ave, Chicago, IL 60626
$-76
Cash flow
-2.1%
Cash-on-Cash Return
5.2%
Cap rate
1.0%
Rent to Value Ratio
19 out of 32 properties for sale in 60626
Limited Results Shown
Create a free account, or log in to reveal all property listings and enjoy the complete experience.
Active
$450,000
4
bds
|
3
ba
|
2,797
sqft
|
built
1920
7730 N Paulina St, Chicago, IL 60626
$-606
Cash flow
-7.0%
Cash-on-Cash Return
4.1%
Cap rate
0.8%
Rent to Value Ratio
Active
$399,000
2
bds
|
2
ba
|
1,502
sqft
|
built
2006
6745 N Clark St, Chicago, IL 60626
$-855
Cash flow
-11.2%
Cash-on-Cash Return
3.1%
Cap rate
0.7%
Rent to Value Ratio
Active
$215,000
2
bds
|
1
ba
|
0
sqft
|
built
1924
1908 W Chase Ave, Chicago, IL 60626
$-488
Cash flow
-11.8%
Cash-on-Cash Return
3.0%
Cap rate
0.8%
Rent to Value Ratio
Active
$375,000
2
bds
|
2
ba
|
0
sqft
|
built
2005
1225 W Morse Ave, Chicago, IL 60626
$-1,027
Cash flow
-14.3%
Cash-on-Cash Return
2.4%
Cap rate
0.7%
Rent to Value Ratio

Active
$274,900
2
bds
|
3
ba
|
1,300
sqft
|
built
1929
7520 N Winchester Ave, Chicago, IL 60626
$-307
Cash flow
-5.8%
Cash-on-Cash Return
4.3%
Cap rate
0.8%
Rent to Value Ratio

Active
$425,000
3
bds
|
2
ba
|
2,000
sqft
|
built
1919
1635 W Estes Ave, Chicago, IL 60626
$-895
Cash flow
-11.0%
Cash-on-Cash Return
3.2%
Cap rate
0.8%
Rent to Value Ratio

Active
$324,999
2
bds
|
1
ba
|
1,102
sqft
|
built
1918
1125 W Farwell Ave, Chicago, IL 60626
$-792
Cash flow
-12.7%
Cash-on-Cash Return
2.8%
Cap rate
0.7%
Rent to Value Ratio

Active
$283,000
2
bds
|
1
ba
|
950
sqft
|
built
1924
7631 N Eastlake Ter, Chicago, IL 60626
$-848
Cash flow
-15.6%
Cash-on-Cash Return
2.1%
Cap rate
0.7%
Rent to Value Ratio

Active
$1,600,000
15
bds
|
8
ba
|
0
sqft
|
built
1950
1062 W Columbia Ave, Chicago, IL 60626
$-7,903
Cash flow
-25.8%
Cash-on-Cash Return
-0.2%
Cap rate
0.1%
Rent to Value Ratio
Active
$265,000
2
bds
|
1
ba
|
0
sqft
|
built
1917
1225 W Greenleaf Ave, Chicago, IL 60626
$-500
Cash flow
-9.8%
Cash-on-Cash Return
3.4%
Cap rate
0.8%
Rent to Value Ratio
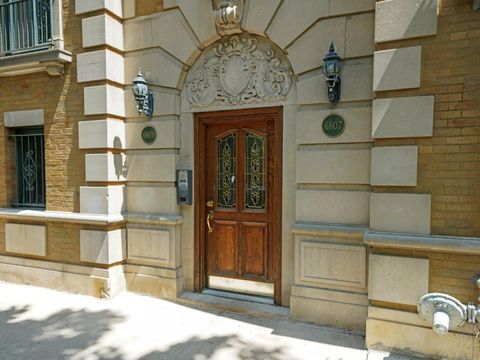
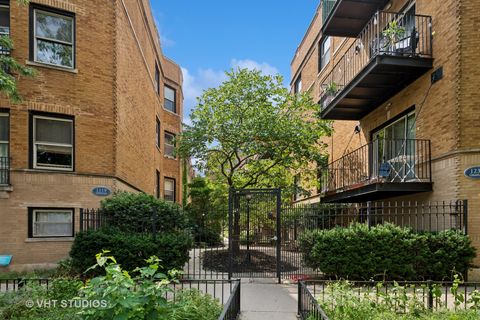
Active
$475,000
2
bds
|
2
ba
|
2,000
sqft
|
built
1926
6807 N Lakewood Ave, Chicago, IL 60626
$-1,433
Cash flow
-15.7%
Cash-on-Cash Return
2.1%
Cap rate
0.5%
Rent to Value Ratio
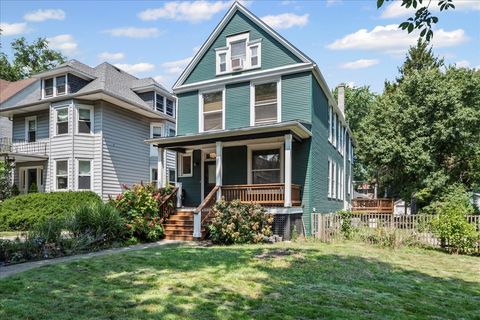
Active
$895,000
5
bds
|
4
ba
|
3,500
sqft
|
built
1910
1842 W Greenleaf Ave, Chicago, IL 60626
$-2,023
Cash flow
-11.8%
Cash-on-Cash Return
3.0%
Cap rate
0.5%
Rent to Value Ratio
Active
$250,000
2
bds
|
1
ba
|
0
sqft
|
built
1920
6711 N Lakewood Ave, Chicago, IL 60626
$-427
Cash flow
-8.9%
Cash-on-Cash Return
3.6%
Cap rate
0.8%
Rent to Value Ratio
Active
$355,000
3
bds
|
2
ba
|
2,000
sqft
|
built
1919
1633 W Estes Ave, Chicago, IL 60626
$-610
Cash flow
-9.0%
Cash-on-Cash Return
3.6%
Cap rate
0.7%
Rent to Value Ratio

Active
$559,000
3
bds
|
2
ba
|
1,652
sqft
|
built
1913
7555 N Rogers Ave, Chicago, IL 60626
$-758
Cash flow
-7.1%
Cash-on-Cash Return
4.1%
Cap rate
0.6%
Rent to Value Ratio
Active
$299,000
2
bds
|
2
ba
|
1,100
sqft
|
built
1915
6912 N Lakewood Ave, Chicago, IL 60626
$-676
Cash flow
-11.8%
Cash-on-Cash Return
3.0%
Cap rate
0.7%
Rent to Value Ratio

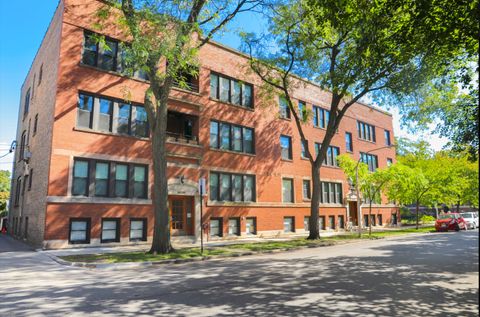
Active
$575,000
6
bds
|
3
ba
|
0
sqft
|
built
1922
1745 W North Shore Ave, Chicago, IL 60626
$-1,615
Cash flow
-14.7%
Cash-on-Cash Return
2.3%
Cap rate
0.5%
Rent to Value Ratio