80221 Investment Properties for Sale
Browse homes for sale and investment properties in 80221. Refine your search by price, property type, or more.
Best cash flowing properties in 80221
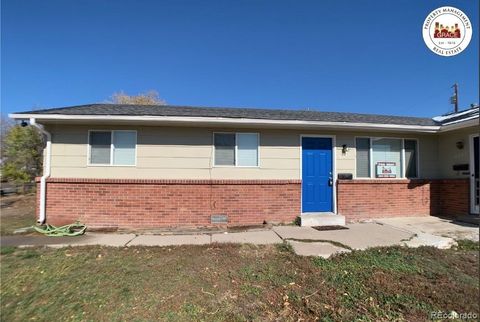
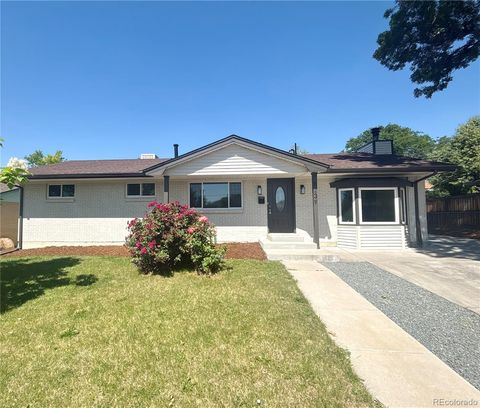
Active
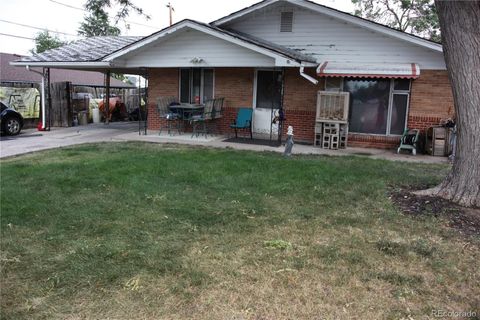
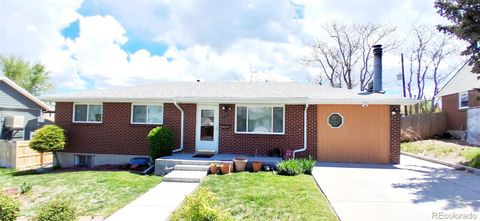
$259,900
3
bds
|
1
ba
|
1,248
sqft
|
built
1955
6830 Julian St, Denver, CO 80221
$341
Cash flow
6.8%
Cash-on-Cash Return
7.3%
Cap rate
1.0%
Rent to Value Ratio
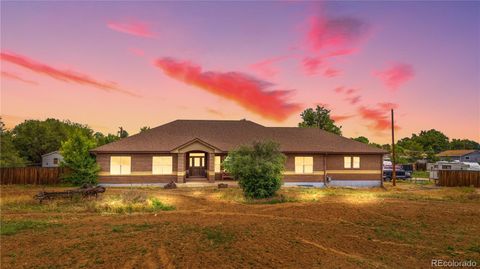
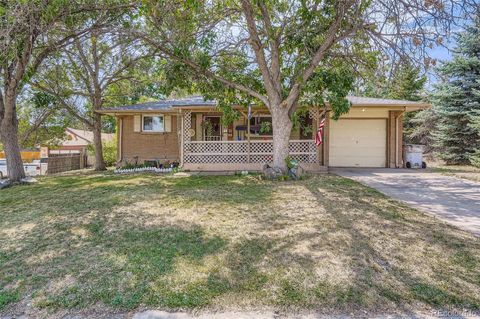
Active
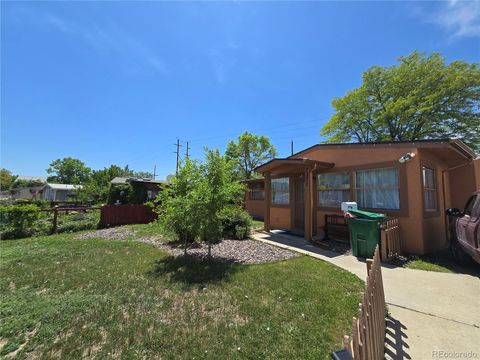
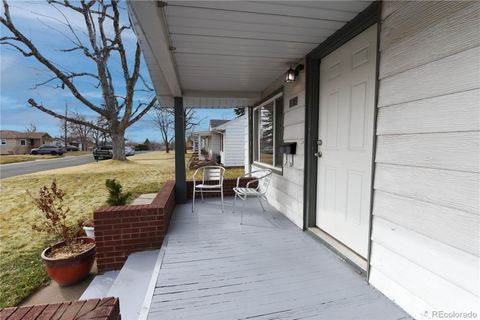
$369,000
3
bds
|
1
ba
|
984
sqft
|
built
1955
7371 Granada Rd, Denver, CO 80221
$-213
Cash flow
-3.0%
Cash-on-Cash Return
5.0%
Cap rate
0.7%
Rent to Value Ratio
74 out of 76 properties for sale in 80221
Limited Results Shown
Create a free account, or log in to reveal all property listings and enjoy the complete experience.
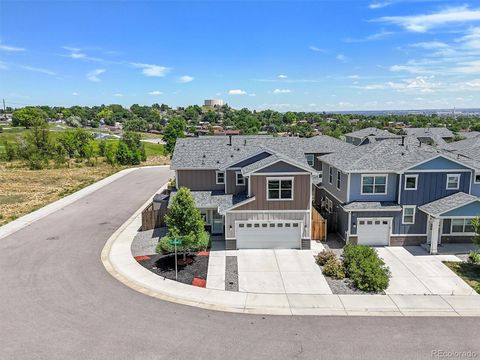
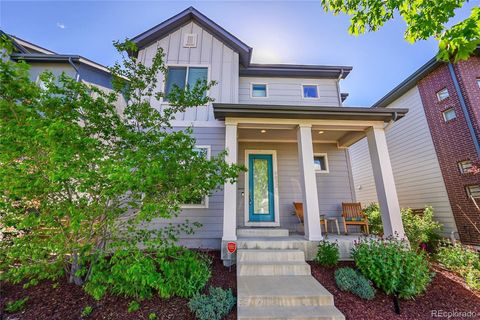
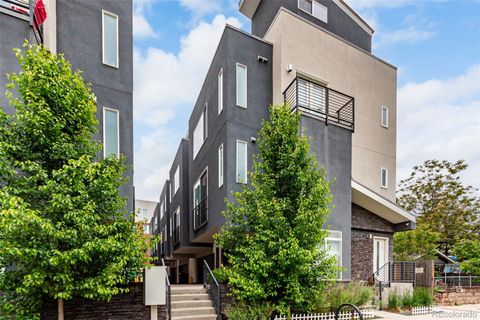
Active
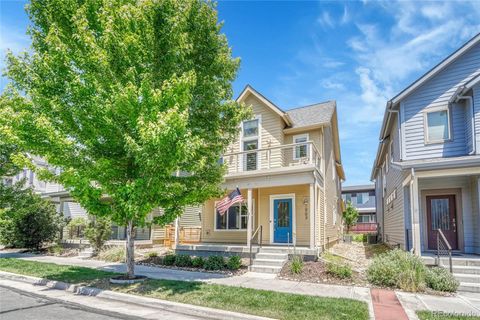
$595,000
3
bds
|
4
ba
|
1,839
sqft
|
built
2015
1903 W 66th Ave, Denver, CO 80221
$-1,043
Cash flow
-9.1%
Cash-on-Cash Return
3.6%
Cap rate
0.6%
Rent to Value Ratio
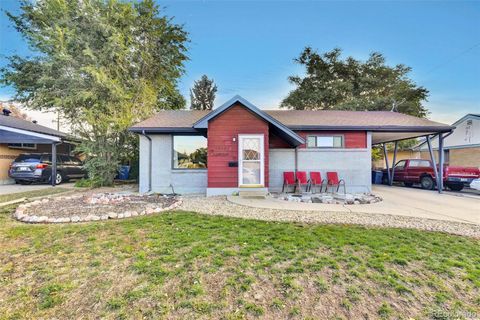
Active
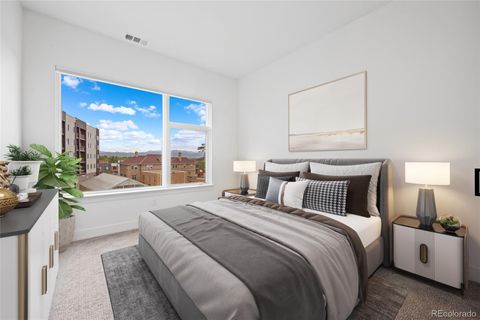
$449,000
2
bds
|
2
ba
|
974
sqft
|
built
2021
2876 W 53rd Ave, Denver, CO 80221
$-804
Cash flow
-9.3%
Cash-on-Cash Return
3.5%
Cap rate
0.6%
Rent to Value Ratio
Active
$225,000
2
bds
|
1
ba
|
800
sqft
|
built
1971
8330 Zuni St, Denver, CO 80221
$-286
Cash flow
-6.6%
Cash-on-Cash Return
4.2%
Cap rate
0.8%
Rent to Value Ratio
Active
$719,000
4
bds
|
4
ba
|
2,040
sqft
|
built
1956
5175 Lowell Blvd, Denver, CO 80221
$-1,340
Cash flow
-9.7%
Cash-on-Cash Return
3.4%
Cap rate
0.5%
Rent to Value Ratio
Active
$424,900
2
bds
|
1
ba
|
722
sqft
|
built
1948
1805 W 51st Ave, Denver, CO 80221
$-454
Cash flow
-5.6%
Cash-on-Cash Return
4.4%
Cap rate
0.6%
Rent to Value Ratio
Active
$560,000
5
bds
|
2
ba
|
2,036
sqft
|
built
1957
7819 Tejon St, Denver, CO 80221
$-1,195
Cash flow
-11.1%
Cash-on-Cash Return
3.1%
Cap rate
0.4%
Rent to Value Ratio
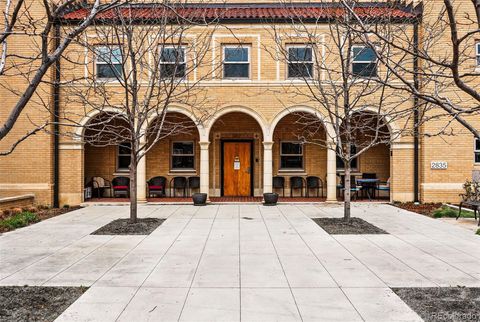
Active
$299,200
1
bds
|
1
ba
|
631
sqft
|
built
1954
2835 W Parkside Pl, Denver, CO 80221
$-611
Cash flow
-10.7%
Cash-on-Cash Return
3.2%
Cap rate
0.6%
Rent to Value Ratio
Active
$529,900
5
bds
|
2
ba
|
2,100
sqft
|
built
1959
2280 Sherrelwood Dr, Denver, CO 80221
$-865
Cash flow
-8.5%
Cash-on-Cash Return
3.7%
Cap rate
0.5%
Rent to Value Ratio
Active
$579,999
3
bds
|
2
ba
|
1,390
sqft
|
built
1946
5030 Beach Ct, Denver, CO 80221
$-979
Cash flow
-8.8%
Cash-on-Cash Return
3.7%
Cap rate
0.5%
Rent to Value Ratio
Active
$550,000
5
bds
|
2
ba
|
1,000
sqft
|
built
1964
8271 Bluebell Way, Denver, CO 80221
$-1,253
Cash flow
-11.9%
Cash-on-Cash Return
2.9%
Cap rate
0.4%
Rent to Value Ratio
Active
$320,000
2
bds
|
2
ba
|
936
sqft
|
built
2003
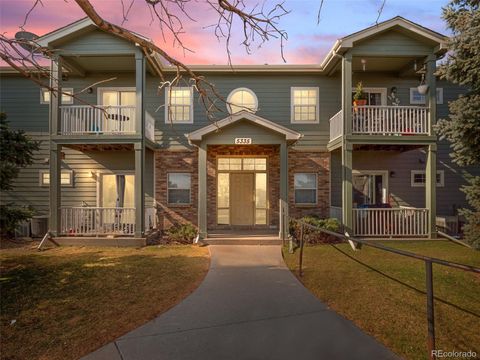
5335 Pecos Way, Denver, CO 80221
$-509
Cash flow
-8.3%
Cash-on-Cash Return
3.8%
Cap rate
0.7%
Rent to Value Ratio
Active
$450,000
3
bds
|
2
ba
|
2,050
sqft
|
built
1966
8338 Charles Way, Denver, CO 80221
$-613
Cash flow
-7.1%
Cash-on-Cash Return
4.0%
Cap rate
0.6%
Rent to Value Ratio
Active
$495,000
3
bds
|
2
ba
|
983
sqft
|
built
1927
5185 Alcott St, Denver, CO 80221
$-769
Cash flow
-8.1%
Cash-on-Cash Return
3.8%
Cap rate
0.5%
Rent to Value Ratio
Active
$622,500
4
bds
|
3
ba
|
1,950
sqft
|
built
2019
7956 Osage St, Denver, CO 80221
$-1,208
Cash flow
-10.1%
Cash-on-Cash Return
3.4%
Cap rate
0.5%
Rent to Value Ratio
Active
$615,000
3
bds
|
3
ba
|
1,960
sqft
|
built
2013
6721 Alan Dr, Denver, CO 80221
$-1,163
Cash flow
-9.9%
Cash-on-Cash Return
3.4%
Cap rate
0.6%
Rent to Value Ratio
Active
$1,500,000
3
bds
|
1
ba
|
600
sqft
|
built
1937
5711 Hooker St, Denver, CO 80221
$-5,639
Cash flow
-19.6%
Cash-on-Cash Return
1.2%
Cap rate
0.2%
Rent to Value Ratio
Active
$749,000
4
bds
|
4
ba
|
3,407
sqft
|
built
2013
1787 W 67th Ave, Denver, CO 80221
$-1,624
Cash flow
-11.3%
Cash-on-Cash Return
3.1%
Cap rate
0.5%
Rent to Value Ratio
Active
$630,000
4
bds
|
4
ba
|
2,082
sqft
|
built
2021
6799 Navajo St, Denver, CO 80221
$-1,394
Cash flow
-11.5%
Cash-on-Cash Return
3.0%
Cap rate
0.5%
Rent to Value Ratio
Active
$599,900
3
bds
|
3
ba
|
1,688
sqft
|
built
2010
1949 W 52nd Pl, Denver, CO 80221
$-1,025
Cash flow
-8.9%
Cash-on-Cash Return
3.6%
Cap rate
0.5%
Rent to Value Ratio
Active
$419,900
2
bds
|
1
ba
|
719
sqft
|
built
1947
1701 W 50th Ave, Denver, CO 80221
$-447
Cash flow
-5.6%
Cash-on-Cash Return
4.4%
Cap rate
0.6%
Rent to Value Ratio
Active
$525,000
6
bds
|
3
ba
|
1,296
sqft
|
built
1959
7952 Zuni St, Denver, CO 80221
$-1,090
Cash flow
-10.8%
Cash-on-Cash Return
3.2%
Cap rate
0.5%
Rent to Value Ratio
Active
$520,000
5
bds
|
2
ba
|
1,924
sqft
|
built
1961
6743 King St, Denver, CO 80221
$-1,222
Cash flow
-12.3%
Cash-on-Cash Return
2.9%
Cap rate
0.4%
Rent to Value Ratio
Active
$740,000
3
bds
|
3
ba
|
2,029
sqft
|
built
2016
6632 Osage St, Denver, CO 80221
$-1,689
Cash flow
-11.9%
Cash-on-Cash Return
2.9%
Cap rate
0.5%
Rent to Value Ratio
Active
$548,000
5
bds
|
2
ba
|
1,736
sqft
|
built
1972
6600 Knox Ct, Denver, CO 80221
$-1,371
Cash flow
-13.1%
Cash-on-Cash Return
2.7%
Cap rate
0.4%
Rent to Value Ratio
Active
$1,299,950
5
bds
|
4
ba
|
3,596
sqft
|
built
2008
1195 W 70th Ave, Denver, CO 80221
$-4,372
Cash flow
-17.5%
Cash-on-Cash Return
1.6%
Cap rate
0.3%
Rent to Value Ratio
Active
$640,000
4
bds
|
4
ba
|
2,172
sqft
|
built
2018
1435 W 67th Ave, Denver, CO 80221
$-1,633
Cash flow
-13.3%
Cash-on-Cash Return
2.6%
Cap rate
0.5%
Rent to Value Ratio
Active
$194,900
2
bds
|
1
ba
|
800
sqft
|
built
1971
8330 Zuni St, Denver, CO 80221
$-281
Cash flow
-7.5%
Cash-on-Cash Return
3.9%
Cap rate
0.8%
Rent to Value Ratio
Active
$399,900
2
bds
|
1
ba
|
747
sqft
|
built
1947
1850 W 50th Ave, Denver, CO 80221
$-394
Cash flow
-5.1%
Cash-on-Cash Return
4.5%
Cap rate
0.6%
Rent to Value Ratio

Active
$499,900
4
bds
|
2
ba
|
1,850
sqft
|
built
1971
7815 Conifer Rd, Denver, CO 80221
$-611
Cash flow
-6.4%
Cash-on-Cash Return
4.2%
Cap rate
0.6%
Rent to Value Ratio

Active
$375,000
2
bds
|
1
ba
|
624
sqft
|
built
1951
6736 Grove St, Denver, CO 80221
$-585
Cash flow
-8.1%
Cash-on-Cash Return
3.8%
Cap rate
0.5%
Rent to Value Ratio
Active
$506,000
4
bds
|
2
ba
|
2,060
sqft
|
built
1957
7820 Tejon St, Denver, CO 80221
$-780
Cash flow
-8.0%
Cash-on-Cash Return
3.8%
Cap rate
0.6%
Rent to Value Ratio
Active
$569,000
3
bds
|
2
ba
|
1,236
sqft
|
built
1942
4901 Bryant St, Denver, CO 80221
$-1,364
Cash flow
-12.5%
Cash-on-Cash Return
2.8%
Cap rate
0.4%
Rent to Value Ratio
Active
$695,000
2
bds
|
3
ba
|
1,407
sqft
|
built
2016
4922 Lowell Blvd, Denver, CO 80221
$-1,236
Cash flow
-9.3%
Cash-on-Cash Return
3.5%
Cap rate
0.5%
Rent to Value Ratio

Active
$599,900
5
bds
|
2
ba
|
2,016
sqft
|
built
1994
6550 Clay St, Denver, CO 80221
$-1,514
Cash flow
-13.2%
Cash-on-Cash Return
2.7%
Cap rate
0.4%
Rent to Value Ratio
Active
$525,000
4
bds
|
2
ba
|
2,000
sqft
|
built
1960
8239 Nola Dr, Denver, CO 80221
$-1,015
Cash flow
-10.1%
Cash-on-Cash Return
3.4%
Cap rate
0.5%
Rent to Value Ratio

Active
$494,000
3
bds
|
2
ba
|
1,600
sqft
|
built
1971
8324 Mitze Way, Denver, CO 80221
$-679
Cash flow
-7.2%
Cash-on-Cash Return
4.0%
Cap rate
0.6%
Rent to Value Ratio
Active
$450,000
3
bds
|
2
ba
|
2,225
sqft
|
built
1959
8361 Wyandot St, Denver, CO 80221
$-473
Cash flow
-5.5%
Cash-on-Cash Return
4.4%
Cap rate
0.6%
Rent to Value Ratio
Active
$475,000
3
bds
|
2
ba
|
1,675
sqft
|
built
1956
7050 Alan Dr, Denver, CO 80221
$-533
Cash flow
-5.9%
Cash-on-Cash Return
4.3%
Cap rate
0.6%
Rent to Value Ratio