85022 Investment Properties for Sale
Browse homes for sale and investment properties in 85022. Refine your search by price, property type, or more.
Best cash flowing properties in 85022

Active
$199,000
1
bds
|
1
ba
|
757
sqft
|
built
1996
17017 N 12th St, Phoenix, AZ 85022
$-168
Cash flow
-4.4%
Cash-on-Cash Return
4.7%
Cap rate
0.8%
Rent to Value Ratio

Active
$320,000
2
bds
|
2
ba
|
1,097
sqft
|
built
1981
831 E Villa Rita Dr, Phoenix, AZ 85022
$-282
Cash flow
-4.6%
Cash-on-Cash Return
4.6%
Cap rate
0.6%
Rent to Value Ratio
83 out of 85 properties for sale in 85022
Limited Results Shown
Create a free account, or log in to reveal all property listings and enjoy the complete experience.

Active
$429,000
3
bds
|
2
ba
|
1,421
sqft
|
built
2004
2125 E Danbury Rd, Phoenix, AZ 85022
$-687
Cash flow
-8.4%
Cash-on-Cash Return
3.8%
Cap rate
0.5%
Rent to Value Ratio

Active
$700,000
2
bds
|
1
ba
|
885
sqft
|
built
1960
1851 E Campo Bello Dr, Phoenix, AZ 85022
$-2,177
Cash flow
-16.2%
Cash-on-Cash Return
1.9%
Cap rate
0.3%
Rent to Value Ratio

Active
$894,900
4
bds
|
3
ba
|
3,940
sqft
|
built
1995
1548 E Estrid Ave, Phoenix, AZ 85022
$-2,270
Cash flow
-13.2%
Cash-on-Cash Return
2.6%
Cap rate
0.4%
Rent to Value Ratio

Active
$589,000
4
bds
|
2
ba
|
2,066
sqft
|
built
1979
702 E Coral Gables Dr, Phoenix, AZ 85022
$-1,022
Cash flow
-9.1%
Cash-on-Cash Return
3.6%
Cap rate
0.5%
Rent to Value Ratio

Active
$244,500
2
bds
|
2
ba
|
886
sqft
|
built
1987
1720 E Thunderbird Rd, Phoenix, AZ 85022
$-438
Cash flow
-9.3%
Cash-on-Cash Return
3.5%
Cap rate
0.7%
Rent to Value Ratio

Active
$269,000
2
bds
|
2
ba
|
997
sqft
|
built
1996
17017 N 12th St, Phoenix, AZ 85022
$-371
Cash flow
-7.2%
Cash-on-Cash Return
4.0%
Cap rate
0.7%
Rent to Value Ratio

Active
$635,000
3
bds
|
2
ba
|
2,118
sqft
|
built
1980
1222 E Acoma Dr, Phoenix, AZ 85022
$-1,410
Cash flow
-11.6%
Cash-on-Cash Return
3.0%
Cap rate
0.4%
Rent to Value Ratio

Active
$459,900
3
bds
|
2
ba
|
1,302
sqft
|
built
1994
17421 N 14th St, Phoenix, AZ 85022
$-393
Cash flow
-4.5%
Cash-on-Cash Return
4.7%
Cap rate
0.6%
Rent to Value Ratio

Active
$524,999
4
bds
|
3
ba
|
2,014
sqft
|
built
1992
1241 E Bluefield Ave, Phoenix, AZ 85022
$-893
Cash flow
-8.9%
Cash-on-Cash Return
3.6%
Cap rate
0.5%
Rent to Value Ratio

Active
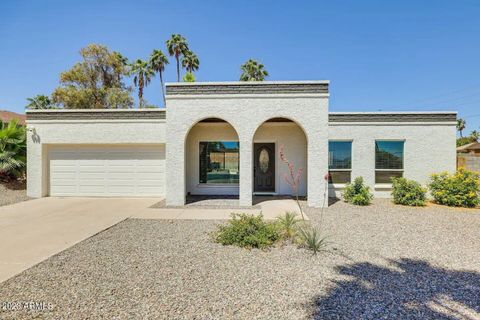
$399,900
3
bds
|
2
ba
|
1,512
sqft
|
built
1962
2346 E Sylvia St, Phoenix, AZ 85022
$-475
Cash flow
-6.2%
Cash-on-Cash Return
4.3%
Cap rate
0.6%
Rent to Value Ratio

Active
$580,000
4
bds
|
2
ba
|
1,766
sqft
|
built
1971
2232 E Karen Dr, Phoenix, AZ 85022
$-747
Cash flow
-6.7%
Cash-on-Cash Return
4.1%
Cap rate
0.5%
Rent to Value Ratio

Active
$525,900
4
bds
|
2
ba
|
2,055
sqft
|
built
1979
1953 E Presidio Rd, Phoenix, AZ 85022
$-996
Cash flow
-9.9%
Cash-on-Cash Return
3.4%
Cap rate
0.5%
Rent to Value Ratio
Active
$675,000
3
bds
|
2
ba
|
1,475
sqft
|
built
1978
15236 N 20th Pl, Phoenix, AZ 85022
$-1,112
Cash flow
-8.6%
Cash-on-Cash Return
3.7%
Cap rate
0.5%
Rent to Value Ratio

Active
$525,000
4
bds
|
3
ba
|
2,019
sqft
|
built
1987
1901 E Hearn Rd, Phoenix, AZ 85022
$-844
Cash flow
-8.4%
Cash-on-Cash Return
3.7%
Cap rate
0.5%
Rent to Value Ratio

Active
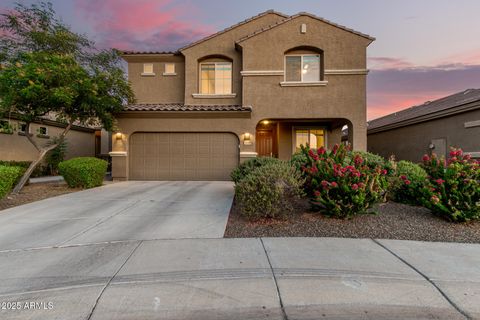
$429,900
3
bds
|
3
ba
|
1,593
sqft
|
built
1994
1203 E Muriel Dr, Phoenix, AZ 85022
$-468
Cash flow
-5.7%
Cash-on-Cash Return
4.4%
Cap rate
0.6%
Rent to Value Ratio

Active
$645,000
3
bds
|
2
ba
|
2,014
sqft
|
built
1985
838 E Brook Hollow Dr, Phoenix, AZ 85022
$-1,305
Cash flow
-10.6%
Cash-on-Cash Return
3.3%
Cap rate
0.4%
Rent to Value Ratio

Active
$1,025,000
5
bds
|
3
ba
|
3,962
sqft
|
built
1996
1935 E Seminole Dr, Phoenix, AZ 85022
$-1,914
Cash flow
-9.7%
Cash-on-Cash Return
3.4%
Cap rate
0.5%
Rent to Value Ratio

Active
$749,999
3
bds
|
3
ba
|
2,697
sqft
|
built
1998
1257 E Voltaire Ave, Phoenix, AZ 85022
$-1,744
Cash flow
-12.1%
Cash-on-Cash Return
2.9%
Cap rate
0.4%
Rent to Value Ratio

Active
$1,100,000
5
bds
|
4
ba
|
4,026
sqft
|
built
2002
18258 N 15th Pl, Phoenix, AZ 85022
$-1,353
Cash flow
-6.4%
Cash-on-Cash Return
4.2%
Cap rate
0.6%
Rent to Value Ratio

Active
$659,800
3
bds
|
2
ba
|
2,115
sqft
|
built
1998
13614 N 12th Way, Phoenix, AZ 85022
$-1,029
Cash flow
-8.1%
Cash-on-Cash Return
3.8%
Cap rate
0.5%
Rent to Value Ratio

Active
$308,000
3
bds
|
3
ba
|
1,240
sqft
|
built
2004
2311 E Hartford Ave, Phoenix, AZ 85022
$-467
Cash flow
-7.9%
Cash-on-Cash Return
3.9%
Cap rate
0.6%
Rent to Value Ratio

Active
$375,000
3
bds
|
3
ba
|
1,439
sqft
|
built
2007
17150 N 23rd St, Phoenix, AZ 85022
$-726
Cash flow
-10.1%
Cash-on-Cash Return
3.4%
Cap rate
0.5%
Rent to Value Ratio

Active
$313,496
2
bds
|
2
ba
|
1,260
sqft
|
built
1984
848 E Morningside Dr, Phoenix, AZ 85022
$-549
Cash flow
-9.1%
Cash-on-Cash Return
3.6%
Cap rate
0.6%
Rent to Value Ratio

Active
$510,990
2
bds
|
2
ba
|
1,757
sqft
|
built
1981
1309 E Meadow Ln, Phoenix, AZ 85022
$-933
Cash flow
-9.5%
Cash-on-Cash Return
3.5%
Cap rate
0.5%
Rent to Value Ratio

Active
$680,000
3
bds
|
2
ba
|
2,428
sqft
|
built
1984
15630 N 20th St, Phoenix, AZ 85022
$-1,293
Cash flow
-9.9%
Cash-on-Cash Return
3.4%
Cap rate
0.5%
Rent to Value Ratio
Active
$635,000
4
bds
|
3
ba
|
2,633
sqft
|
built
2016
2149 E Aire Libre Ave, Phoenix, AZ 85022
$-1,391
Cash flow
-11.4%
Cash-on-Cash Return
3.1%
Cap rate
0.4%
Rent to Value Ratio

Active
$549,900
4
bds
|
3
ba
|
2,078
sqft
|
built
1996
1332 E Charleston Ave, Phoenix, AZ 85022
$-678
Cash flow
-6.4%
Cash-on-Cash Return
4.2%
Cap rate
0.6%
Rent to Value Ratio

Active
$579,000
3
bds
|
2
ba
|
1,782
sqft
|
built
1977
842 E Village Circle Dr N, Phoenix, AZ 85022
$-1,299
Cash flow
-11.7%
Cash-on-Cash Return
3.0%
Cap rate
0.4%
Rent to Value Ratio
Active
$320,000
2
bds
|
3
ba
|
1,196
sqft
|
built
2005
2150 E Bell Rd, Phoenix, AZ 85022
$-371
Cash flow
-6.0%
Cash-on-Cash Return
4.3%
Cap rate
0.6%
Rent to Value Ratio

Active
$275,000
2
bds
|
2
ba
|
1,007
sqft
|
built
1987
17240 N 16th Pl, Phoenix, AZ 85022
$-512
Cash flow
-9.7%
Cash-on-Cash Return
3.4%
Cap rate
0.6%
Rent to Value Ratio

Active
$925,000
4
bds
|
3
ba
|
2,329
sqft
|
built
2019
14025 N 11th Pl, Phoenix, AZ 85022
$-719
Cash flow
-4.1%
Cash-on-Cash Return
4.7%
Cap rate
0.6%
Rent to Value Ratio

Active
$270,000
2
bds
|
2
ba
|
1,008
sqft
|
built
2005
2311 E Hartford Ave, Phoenix, AZ 85022
$-426
Cash flow
-8.2%
Cash-on-Cash Return
3.8%
Cap rate
0.6%
Rent to Value Ratio

Active
$565,900
4
bds
|
3
ba
|
2,324
sqft
|
built
1993
1202 E Libby St, Phoenix, AZ 85022
$-1,058
Cash flow
-9.8%
Cash-on-Cash Return
3.4%
Cap rate
0.5%
Rent to Value Ratio

Active
$489,900
3
bds
|
2
ba
|
1,386
sqft
|
built
1970
2213 E Janice Way, Phoenix, AZ 85022
$-487
Cash flow
-5.2%
Cash-on-Cash Return
4.5%
Cap rate
0.6%
Rent to Value Ratio

Active
$549,900
3
bds
|
3
ba
|
1,940
sqft
|
built
2015
2046 E Paradise Ln, Phoenix, AZ 85022
$-1,058
Cash flow
-10.0%
Cash-on-Cash Return
3.4%
Cap rate
0.5%
Rent to Value Ratio

Active
$394,900
2
bds
|
2
ba
|
1,398
sqft
|
built
1981
2326 E Evans Dr, Phoenix, AZ 85022
$-465
Cash flow
-6.1%
Cash-on-Cash Return
4.3%
Cap rate
0.6%
Rent to Value Ratio
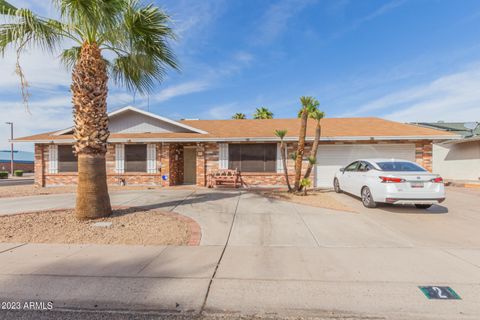
Active
$520,000
4
bds
|
2
ba
|
2,414
sqft
|
built
1981
2 E Muriel Dr, Phoenix, AZ 85022
$-702
Cash flow
-7.0%
Cash-on-Cash Return
4.1%
Cap rate
0.5%
Rent to Value Ratio

Active
$238,000
2
bds
|
2
ba
|
816
sqft
|
built
1986
12440 N 20th St, Phoenix, AZ 85022
$-457
Cash flow
-10.0%
Cash-on-Cash Return
3.4%
Cap rate
0.6%
Rent to Value Ratio