Broken Arrow, OK Investment Properties for Sale
Browse homes for sale and investment properties in Broken Arrow, OK. Refine your search by price, property type, or more.
Best cash flowing properties in Broken Arrow, OK
Active
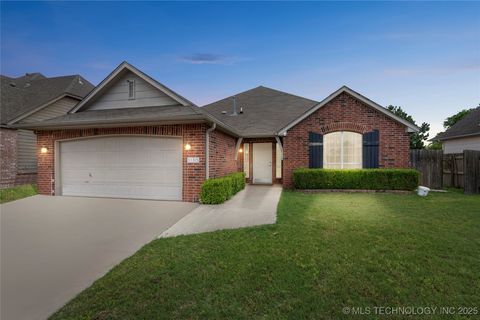
$260,000
3
bds
|
2
ba
|
2,119
sqft
|
built
1976
4004 S Hickory Ave, Broken Arrow, OK 74011
$-106
Cash flow
-2.1%
Cash-on-Cash Return
5.2%
Cap rate
0.7%
Rent to Value Ratio
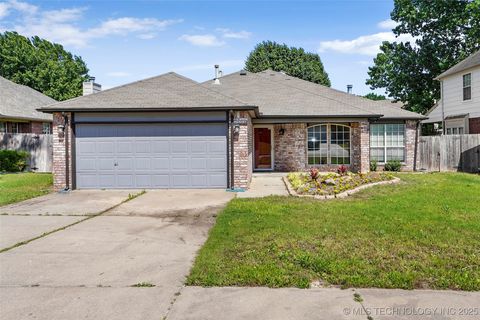
Active
$245,000
3
bds
|
2
ba
|
1,588
sqft
|
built
1984
4509 W Toledo St, Broken Arrow, OK 74012
$-106
Cash flow
-2.3%
Cash-on-Cash Return
5.2%
Cap rate
0.7%
Rent to Value Ratio
301 out of 424 properties for sale in Broken Arrow, OK
Limited Results Shown
Create a free account, or log in to reveal all property listings and enjoy the complete experience.
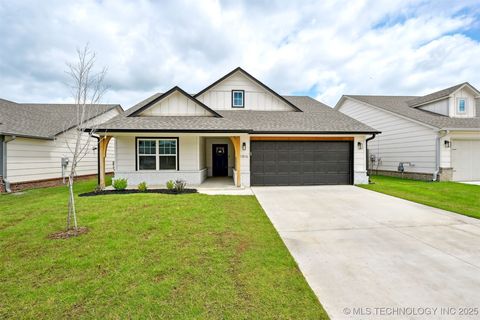
Active
$499,900
4
bds
|
4
ba
|
3,715
sqft
|
built
2001
1816 W Sandusky St, Broken Arrow, OK 74012
$-897
Cash flow
-9.4%
Cash-on-Cash Return
3.5%
Cap rate
0.6%
Rent to Value Ratio
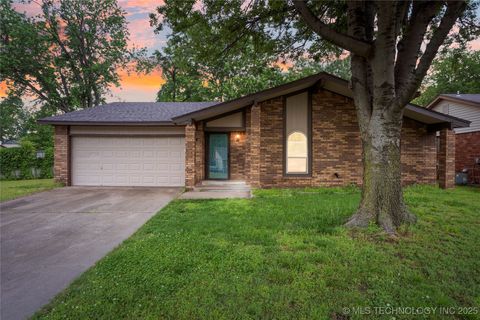
Active
$208,500
3
bds
|
2
ba
|
1,195
sqft
|
built
1980
211 E Waco Pl, Broken Arrow, OK 74011
$-146
Cash flow
-3.7%
Cash-on-Cash Return
4.8%
Cap rate
0.7%
Rent to Value Ratio

Active
$479,900
3
bds
|
3
ba
|
2,843
sqft
|
built
2022
7509 S Chestnut Ave, Broken Arrow, OK 74011
$-597
Cash flow
-6.5%
Cash-on-Cash Return
4.2%
Cap rate
0.5%
Rent to Value Ratio
Active
$359,900
4
bds
|
2
ba
|
2,112
sqft
|
built
2021
7417 E Jackson St, Broken Arrow, OK 74014
$-714
Cash flow
-10.4%
Cash-on-Cash Return
3.3%
Cap rate
0.6%
Rent to Value Ratio
Active
$230,000
3
bds
|
2
ba
|
1,412
sqft
|
built
1984
1700 S Cypress Ave, Broken Arrow, OK 74012
$-224
Cash flow
-5.1%
Cash-on-Cash Return
4.5%
Cap rate
0.7%
Rent to Value Ratio
Active
$250,000
3
bds
|
2
ba
|
1,452
sqft
|
built
2006
3301 E Fairmont St, Broken Arrow, OK 74014
$-315
Cash flow
-6.6%
Cash-on-Cash Return
4.2%
Cap rate
0.6%
Rent to Value Ratio
Active
$235,000
3
bds
|
2
ba
|
1,542
sqft
|
built
1977
905 W Park Ct, Broken Arrow, OK 74011
$-139
Cash flow
-3.1%
Cash-on-Cash Return
5.0%
Cap rate
0.7%
Rent to Value Ratio
Active
$295,000
3
bds
|
2
ba
|
1,968
sqft
|
built
2000
1105 N Joshua Ave, Broken Arrow, OK 74012
$-226
Cash flow
-4.0%
Cash-on-Cash Return
4.8%
Cap rate
0.7%
Rent to Value Ratio
Active
$285,000
3
bds
|
2
ba
|
2,065
sqft
|
built
1993
1309 N Willow Ave, Broken Arrow, OK 74012
$-430
Cash flow
-7.9%
Cash-on-Cash Return
3.9%
Cap rate
0.6%
Rent to Value Ratio
Active
$224,900
3
bds
|
2
ba
|
1,560
sqft
|
built
1979
901 S Lions Ave, Broken Arrow, OK 74012
$-170
Cash flow
-3.9%
Cash-on-Cash Return
4.8%
Cap rate
0.7%
Rent to Value Ratio
Active
$325,000
4
bds
|
2
ba
|
1,846
sqft
|
built
2023
1816 E Winston St, Broken Arrow, OK 74011
$-421
Cash flow
-6.8%
Cash-on-Cash Return
4.1%
Cap rate
0.7%
Rent to Value Ratio
Active
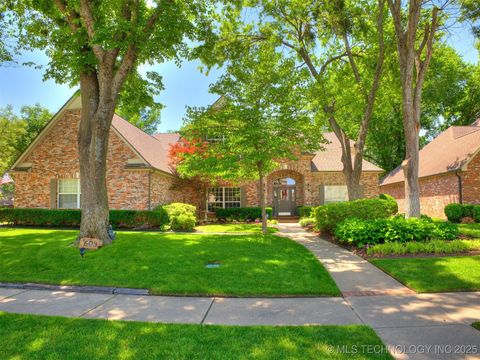
$649,900
4
bds
|
3
ba
|
4,010
sqft
|
built
2005
13041 E 67th St, Broken Arrow, OK 74012
$-1,596
Cash flow
-12.8%
Cash-on-Cash Return
2.7%
Cap rate
0.4%
Rent to Value Ratio
Active
$365,000
5
bds
|
3
ba
|
3,085
sqft
|
built
2002
4708 W Indianola St, Broken Arrow, OK 74012
$-302
Cash flow
-4.3%
Cash-on-Cash Return
4.7%
Cap rate
0.7%
Rent to Value Ratio
Active
$219,000
3
bds
|
2
ba
|
1,158
sqft
|
built
1983
1904 W Honolulu St, Broken Arrow, OK 74012
$-207
Cash flow
-4.9%
Cash-on-Cash Return
4.5%
Cap rate
0.6%
Rent to Value Ratio
Active
$234,900
3
bds
|
2
ba
|
1,450
sqft
|
built
2007
2713 N 20th St, Broken Arrow, OK 74012
$-218
Cash flow
-4.8%
Cash-on-Cash Return
4.6%
Cap rate
0.7%
Rent to Value Ratio
Active
$1,199,990
3
bds
|
4
ba
|
4,565
sqft
|
built
2022
30907 E 68th St S, Broken Arrow, OK 74014
$-4,394
Cash flow
-19.1%
Cash-on-Cash Return
1.3%
Cap rate
0.2%
Rent to Value Ratio
Active
$399,995
5
bds
|
3
ba
|
3,012
sqft
|
built
2006
1901 N 8th St, Broken Arrow, OK 74012
$-256
Cash flow
-3.3%
Cash-on-Cash Return
4.9%
Cap rate
0.7%
Rent to Value Ratio
Active
$555,000
4
bds
|
4
ba
|
3,299
sqft
|
built
2017
2236 W Charlotte St, Broken Arrow, OK 74011
$-917
Cash flow
-8.6%
Cash-on-Cash Return
3.7%
Cap rate
0.6%
Rent to Value Ratio
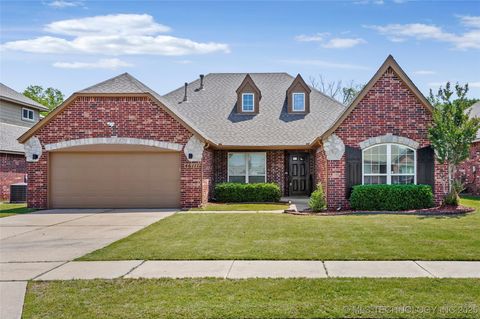
Active
$365,500
4
bds
|
2
ba
|
2,179
sqft
|
built
2016
2613 W Van Buren Ct, Broken Arrow, OK 74011
$-513
Cash flow
-7.3%
Cash-on-Cash Return
4.0%
Cap rate
0.6%
Rent to Value Ratio
Active
$269,900
3
bds
|
2
ba
|
1,741
sqft
|
built
1984
2800 E Seattle St, Broken Arrow, OK 74014
$-341
Cash flow
-6.6%
Cash-on-Cash Return
4.2%
Cap rate
0.6%
Rent to Value Ratio
Active
$394,500
4
bds
|
2
ba
|
2,247
sqft
|
built
2003
3305 N Gum Pl, Broken Arrow, OK 74012
$-459
Cash flow
-6.1%
Cash-on-Cash Return
4.3%
Cap rate
0.6%
Rent to Value Ratio
Active
$327,000
3
bds
|
3
ba
|
2,025
sqft
|
built
2020
25363 E 87th St S, Broken Arrow, OK 74014
$-597
Cash flow
-9.5%
Cash-on-Cash Return
3.5%
Cap rate
0.6%
Rent to Value Ratio
Active
$340,000
4
bds
|
2
ba
|
1,964
sqft
|
built
1980
20941 E 102nd St S, Broken Arrow, OK 74014
$-592
Cash flow
-9.1%
Cash-on-Cash Return
3.6%
Cap rate
0.5%
Rent to Value Ratio
Active
$415,000
4
bds
|
3
ba
|
2,427
sqft
|
built
2017
22905 E 104th St S, Broken Arrow, OK 74014
$-603
Cash flow
-7.6%
Cash-on-Cash Return
3.9%
Cap rate
0.6%
Rent to Value Ratio
Active
$325,000
3
bds
|
3
ba
|
2,310
sqft
|
built
1950
2675 S 337th East Ave, Broken Arrow, OK 74014
$-389
Cash flow
-6.2%
Cash-on-Cash Return
4.2%
Cap rate
0.6%
Rent to Value Ratio
Active
$409,900
3
bds
|
2
ba
|
2,321
sqft
|
built
2020
8721 E Joliet St, Broken Arrow, OK 74014
$-643
Cash flow
-8.2%
Cash-on-Cash Return
3.8%
Cap rate
0.6%
Rent to Value Ratio
Active
$329,000
3
bds
|
2
ba
|
2,693
sqft
|
built
1993
408 S Tamarack Ave, Broken Arrow, OK 74012
$-353
Cash flow
-5.6%
Cash-on-Cash Return
4.4%
Cap rate
0.7%
Rent to Value Ratio

Active
$325,000
4
bds
|
3
ba
|
2,541
sqft
|
built
2000
20001 E 46th St S, Broken Arrow, OK 74014
$-654
Cash flow
-10.5%
Cash-on-Cash Return
3.3%
Cap rate
0.6%
Rent to Value Ratio
Active
$364,000
6
bds
|
3
ba
|
2,405
sqft
|
built
2004
2405 S 13th St, Broken Arrow, OK 74012
$-644
Cash flow
-9.2%
Cash-on-Cash Return
3.6%
Cap rate
0.5%
Rent to Value Ratio
Active
$469,000
5
bds
|
4
ba
|
3,438
sqft
|
built
2003
3000 S Tamarack Ave, Broken Arrow, OK 74012
$-833
Cash flow
-9.3%
Cash-on-Cash Return
3.5%
Cap rate
0.6%
Rent to Value Ratio
Active
$332,500
5
bds
|
3
ba
|
2,034
sqft
|
built
2025
3405 E Montpelier Pl, Broken Arrow, OK 74014
$-258
Cash flow
-4.0%
Cash-on-Cash Return
4.7%
Cap rate
0.6%
Rent to Value Ratio
Active
$399,990
4
bds
|
2
ba
|
2,272
sqft
|
built
2021
2915 E Rockford Pl, Broken Arrow, OK 74014
$-663
Cash flow
-8.6%
Cash-on-Cash Return
3.7%
Cap rate
0.6%
Rent to Value Ratio
Active
$539,900
4
bds
|
5
ba
|
4,034
sqft
|
built
1996
609 E Pensacola St, Broken Arrow, OK 74011
$-1,000
Cash flow
-9.7%
Cash-on-Cash Return
3.5%
Cap rate
0.5%
Rent to Value Ratio
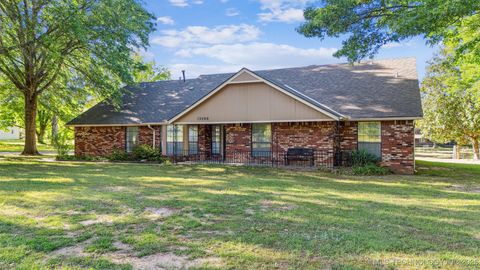
Active
$479,000
4
bds
|
2
ba
|
2,204
sqft
|
built
1977
13200 E 130th St S, Broken Arrow, OK 74011
$-1,174
Cash flow
-12.8%
Cash-on-Cash Return
2.7%
Cap rate
0.4%
Rent to Value Ratio
Active
$305,000
3
bds
|
2
ba
|
2,056
sqft
|
built
2007
4611 N 36th Pl, Broken Arrow, OK 74014
$-229
Cash flow
-3.9%
Cash-on-Cash Return
4.8%
Cap rate
0.6%
Rent to Value Ratio
Active
$290,000
3
bds
|
3
ba
|
2,344
sqft
|
built
1993
3843 W Galveston Pl, Broken Arrow, OK 74012
$-426
Cash flow
-7.7%
Cash-on-Cash Return
3.9%
Cap rate
0.6%
Rent to Value Ratio
Active
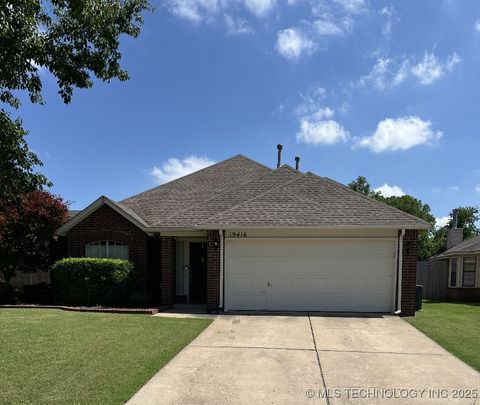
$311,900
4
bds
|
2
ba
|
2,530
sqft
|
built
1998
19416 E 38th St S, Broken Arrow, OK 74014
$-323
Cash flow
-5.4%
Cash-on-Cash Return
4.4%
Cap rate
0.6%
Rent to Value Ratio
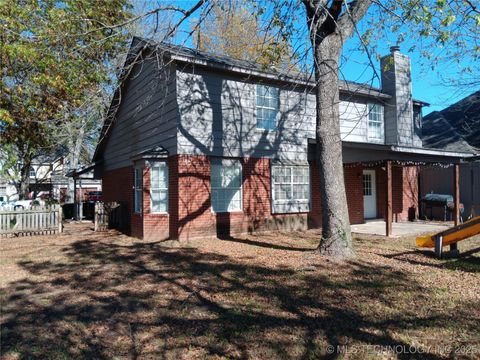
Active
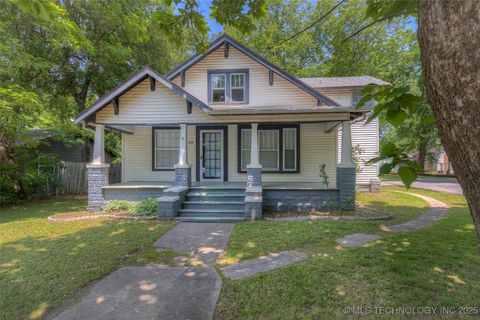
$315,000
3
bds
|
2
ba
|
2,082
sqft
|
built
1928
234 E Freeport St, Broken Arrow, OK 74012
$-362
Cash flow
-6.0%
Cash-on-Cash Return
4.3%
Cap rate
0.6%
Rent to Value Ratio