Buford, GA Investment Properties for Sale
Browse homes for sale and investment properties in Buford, GA. Refine your search by price, property type, or more.
Best cash flowing properties in Buford, GA

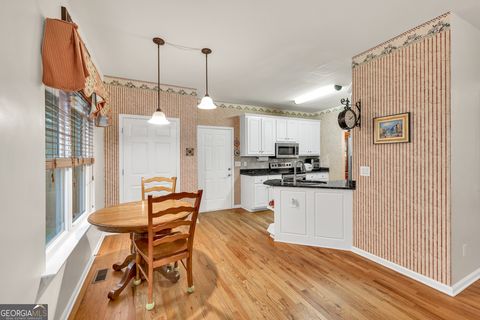
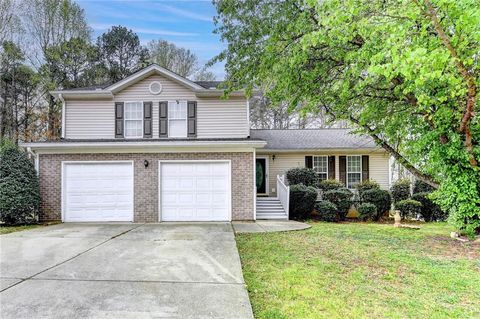
Active
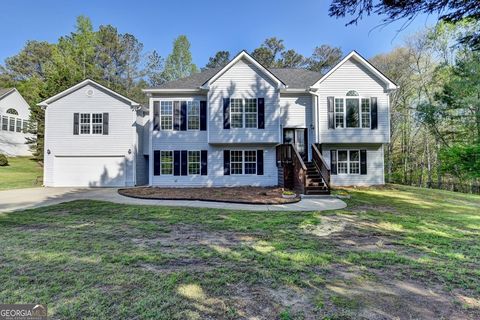
$165,000
3
bds
|
0
ba
|
1,736
sqft
|
built
1997
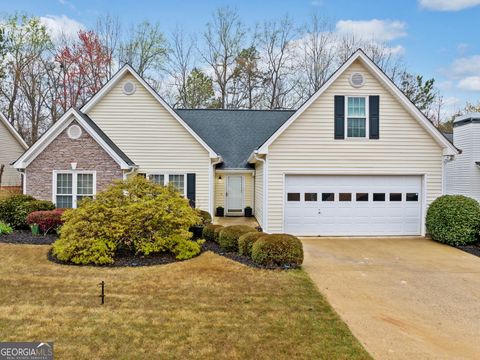
3735 Fir Dr, Buford, GA 30518
$380
Cash flow
12.0%
Cash-on-Cash Return
8.9%
Cap rate
1.1%
Rent to Value Ratio
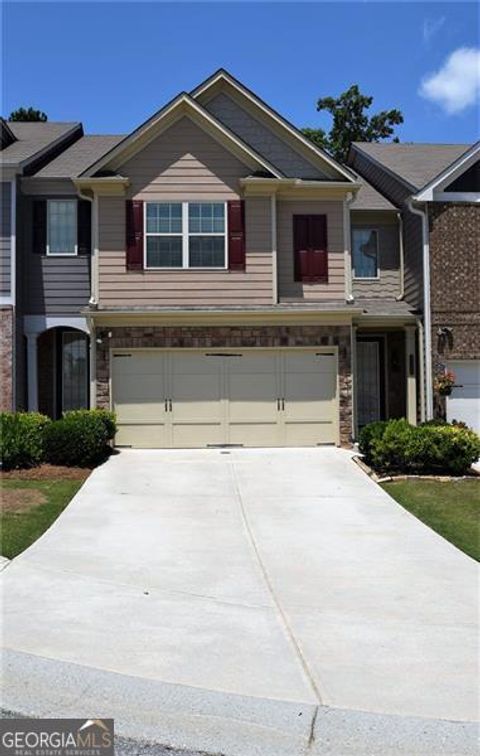
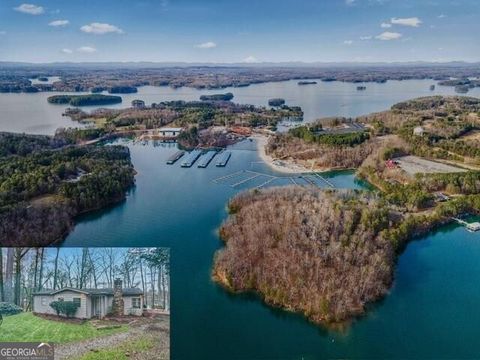
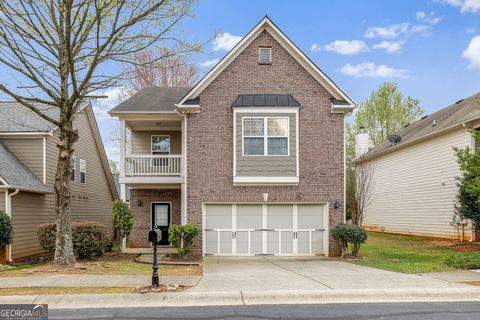
Active
$345,000
3
bds
|
0
ba
|
1,938
sqft
|
built
2011
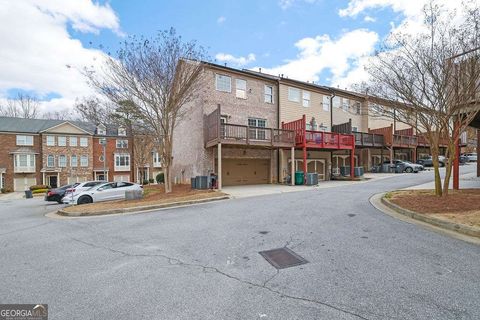
3356 Sardis Bend Dr, Buford, GA 30519
$-602
Cash flow
-9.1%
Cash-on-Cash Return
4.1%
Cap rate
0.7%
Rent to Value Ratio
274 out of 291 properties for sale in Buford, GA
Limited Results Shown
Create a free account, or log in to reveal all property listings and enjoy the complete experience.
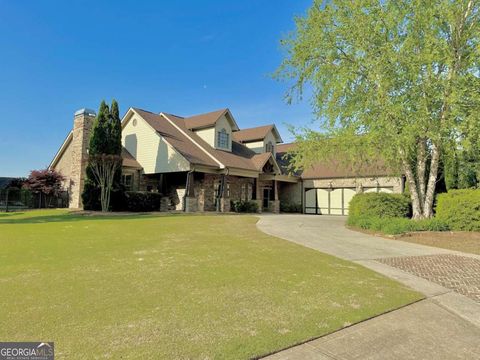
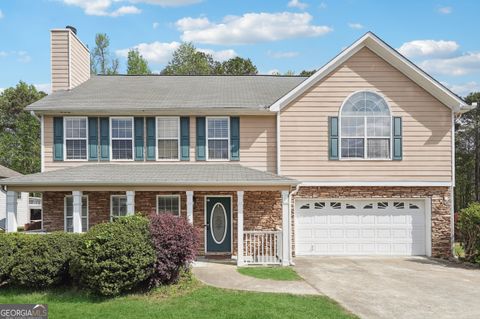
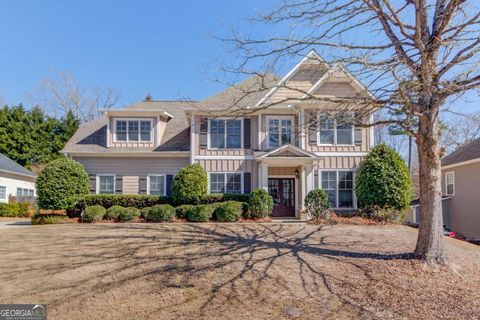
Active
$544,900
4
bds
|
0
ba
|
3,565
sqft
|
built
1999
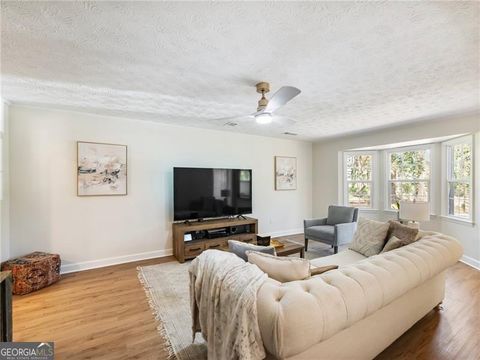
2262 Silver Fox Ln, Buford, GA 30519
$-1,446
Cash flow
-13.8%
Cash-on-Cash Return
3.0%
Cap rate
0.5%
Rent to Value Ratio
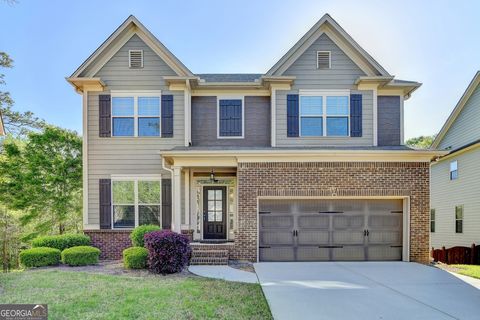
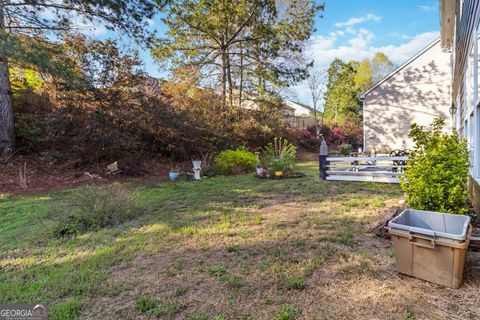
Active
$1,175,000
4
bds
|
0
ba
|
4,655
sqft
|
built
2007
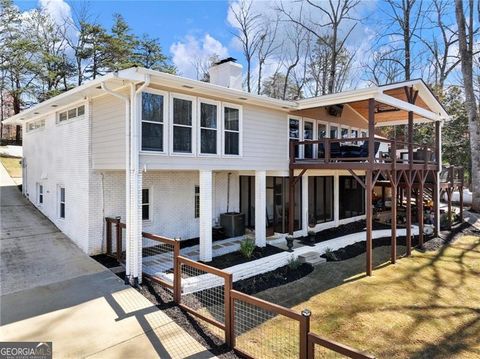
216 Slate Dr, Buford, GA 30518
$-3,191
Cash flow
-14.2%
Cash-on-Cash Return
2.9%
Cap rate
0.4%
Rent to Value Ratio
Active
$509,000
4
bds
|
0
ba
|
0
sqft
|
built
2014
2272 Misty Brook Ct, Buford, GA 30519
$-907
Cash flow
-9.3%
Cash-on-Cash Return
4.0%
Cap rate
0.6%
Rent to Value Ratio

Active
$839,000
5
bds
|
4
ba
|
4,021
sqft
|
built
2019
4496 Sardis Church Rd, Buford, GA 30519
$-1,660
Cash flow
-10.3%
Cash-on-Cash Return
3.8%
Cap rate
0.6%
Rent to Value Ratio

Active
$540,000
3
bds
|
3
ba
|
0
sqft
|
built
2023
5022 Buice Crest Dr, Buford, GA 30518
$-1,271
Cash flow
-12.3%
Cash-on-Cash Return
3.3%
Cap rate
0.5%
Rent to Value Ratio
Active
$615,000
5
bds
|
0
ba
|
0
sqft
|
built
2021
3564 Nathan Farm Ln, Buford, GA 30519
$-1,612
Cash flow
-13.7%
Cash-on-Cash Return
3.0%
Cap rate
0.6%
Rent to Value Ratio

Active
$360,000
4
bds
|
0
ba
|
1,860
sqft
|
built
1987
2831 Pine Log Way, Buford, GA 30519
$-1,019
Cash flow
-14.8%
Cash-on-Cash Return
2.8%
Cap rate
0.5%
Rent to Value Ratio
Active
$764,000
4
bds
|
0
ba
|
0
sqft
|
built
2020
1867 Sterling Chase, Buford, GA 30518
$-1,606
Cash flow
-11.0%
Cash-on-Cash Return
3.6%
Cap rate
0.5%
Rent to Value Ratio
Active
$465,000
5
bds
|
0
ba
|
2,754
sqft
|
built
2007
2822 Sedgeview Ln, Buford, GA 30519
$-988
Cash flow
-11.1%
Cash-on-Cash Return
3.6%
Cap rate
0.6%
Rent to Value Ratio
Active
$599,000
7
bds
|
0
ba
|
0
sqft
|
built
2010
2238 Well Springs Dr, Buford, GA 30519
$-1,542
Cash flow
-13.4%
Cash-on-Cash Return
3.1%
Cap rate
0.5%
Rent to Value Ratio
Active
$674,900
4
bds
|
0
ba
|
4,114
sqft
|
built
2004
3211 Thompson Mill Rd, Buford, GA 30519
$-1,644
Cash flow
-12.7%
Cash-on-Cash Return
3.2%
Cap rate
0.5%
Rent to Value Ratio
Active
$999,500
3
bds
|
0
ba
|
1,064
sqft
|
built
1966
6337 Ansel Ct, Buford, GA 30518
$-4,301
Cash flow
-22.5%
Cash-on-Cash Return
1.0%
Cap rate
0.2%
Rent to Value Ratio

Active
$1,180,000
4
bds
|
0
ba
|
3,259
sqft
|
built
2005
1762 Green Rd, Buford, GA 30518
$-3,111
Cash flow
-13.8%
Cash-on-Cash Return
3.0%
Cap rate
0.5%
Rent to Value Ratio

Active
$1,935,000
5
bds
|
0
ba
|
4,509
sqft
|
built
1989
6477 Old Shadburn Ferry Rd, Buford, GA 30518
$-7,779
Cash flow
-21.0%
Cash-on-Cash Return
1.3%
Cap rate
0.3%
Rent to Value Ratio
Active
$399,000
4
bds
|
0
ba
|
1,900
sqft
|
built
1998
3380 Duncan Bridge Dr, Buford, GA 30519
$-724
Cash flow
-9.5%
Cash-on-Cash Return
4.0%
Cap rate
0.6%
Rent to Value Ratio
Active
$460,000
4
bds
|
0
ba
|
0
sqft
|
built
2006
2319 White Alder Dr, Buford, GA 30519
$-1,213
Cash flow
-13.8%
Cash-on-Cash Return
3.0%
Cap rate
0.5%
Rent to Value Ratio
Active
$774,900
5
bds
|
0
ba
|
3,512
sqft
|
built
2015
2196 Abbott Dr, Buford, GA 30519
$-2,125
Cash flow
-14.3%
Cash-on-Cash Return
2.9%
Cap rate
0.5%
Rent to Value Ratio
Active
$580,000
5
bds
|
0
ba
|
3,493
sqft
|
built
2014
2910 Blake Towers Ln, Buford, GA 30519
$-1,334
Cash flow
-12.0%
Cash-on-Cash Return
3.4%
Cap rate
0.5%
Rent to Value Ratio

Active
$3,100,000
4
bds
|
0
ba
|
5,995
sqft
|
built
2005
6316 Woodlake Dr, Buford, GA 30518
$-13,331
Cash flow
-22.4%
Cash-on-Cash Return
1.0%
Cap rate
0.2%
Rent to Value Ratio

Active
$592,000
5
bds
|
4
ba
|
0
sqft
|
built
2005
2723 Ivy Bluff Ct, Buford, GA 30519
$-1,808
Cash flow
-15.9%
Cash-on-Cash Return
2.5%
Cap rate
0.5%
Rent to Value Ratio
Active
$365,000
3
bds
|
0
ba
|
2,574
sqft
|
built
2006
1829 Appaloosa Mill Ct, Buford, GA 30519
$-842
Cash flow
-12.0%
Cash-on-Cash Return
3.4%
Cap rate
0.6%
Rent to Value Ratio
Active
$465,000
4
bds
|
0
ba
|
0
sqft
|
built
2012
2050 Harvest Ridge Cir, Buford, GA 30519
$-1,216
Cash flow
-13.6%
Cash-on-Cash Return
3.0%
Cap rate
0.5%
Rent to Value Ratio
Active
$546,000
5
bds
|
0
ba
|
0
sqft
|
built
2003
4155 Cami Way, Buford, GA 30519
$-1,449
Cash flow
-13.8%
Cash-on-Cash Return
3.0%
Cap rate
0.5%
Rent to Value Ratio
Active
$385,000
3
bds
|
0
ba
|
2,548
sqft
|
built
2006
5125 Cactus Cove Ln, Buford, GA 30519
$-885
Cash flow
-12.0%
Cash-on-Cash Return
3.4%
Cap rate
0.6%
Rent to Value Ratio
Active
$419,000
5
bds
|
3
ba
|
0
sqft
|
built
2001
5880 April Dr, Buford, GA 30518
$-999
Cash flow
-12.4%
Cash-on-Cash Return
3.3%
Cap rate
0.5%
Rent to Value Ratio
Active
$560,000
4
bds
|
0
ba
|
3,364
sqft
|
built
2003
2323 Council Ln, Buford, GA 30519
$-971
Cash flow
-9.0%
Cash-on-Cash Return
4.1%
Cap rate
0.6%
Rent to Value Ratio
Active
$569,800
4
bds
|
0
ba
|
3,601
sqft
|
built
2007
1218 Lanier Springs Dr, Buford, GA 30518
$-1,584
Cash flow
-14.5%
Cash-on-Cash Return
2.8%
Cap rate
0.5%
Rent to Value Ratio
Active
$349,900
2
bds
|
0
ba
|
0
sqft
|
built
2003
2164 Mill Garden Run, Buford, GA 30519
$-810
Cash flow
-12.1%
Cash-on-Cash Return
3.4%
Cap rate
0.6%
Rent to Value Ratio
Active
$780,000
5
bds
|
0
ba
|
3,415
sqft
|
built
2007
2546 Summer Song Way, Buford, GA 30519
$-2,547
Cash flow
-17.0%
Cash-on-Cash Return
2.2%
Cap rate
0.4%
Rent to Value Ratio
Active
$495,000
4
bds
|
0
ba
|
0
sqft
|
built
2006
4033 Roxberry Hill Ln, Buford, GA 30518
$-1,409
Cash flow
-14.9%
Cash-on-Cash Return
2.7%
Cap rate
0.5%
Rent to Value Ratio

Active
$649,850
5
bds
|
4
ba
|
0
sqft
|
built
2004
3828 Morning Meadow Ln, Buford, GA 30519
$-2,008
Cash flow
-16.1%
Cash-on-Cash Return
2.4%
Cap rate
0.5%
Rent to Value Ratio

Active
$1,775,000
4
bds
|
4
ba
|
5,572
sqft
|
built
1996
5388 Frazer Rd, Buford, GA 30518
$-6,672
Cash flow
-19.6%
Cash-on-Cash Return
1.6%
Cap rate
0.2%
Rent to Value Ratio

Active
$369,000
3
bds
|
3
ba
|
0
sqft
|
built
2013
2620 Sardis Chase Ct, Buford, GA 30519
$-1,005
Cash flow
-14.2%
Cash-on-Cash Return
2.9%
Cap rate
0.7%
Rent to Value Ratio
Active
$449,900
4
bds
|
0
ba
|
1,956
sqft
|
built
1998
455 Ellesmere Way, Buford, GA 30518
$-1,123
Cash flow
-13.0%
Cash-on-Cash Return
3.2%
Cap rate
0.6%
Rent to Value Ratio
Active
$355,999
3
bds
|
0
ba
|
2,048
sqft
|
built
2007
1952 Appaloosa Mill Cir, Buford, GA 30519
$-805
Cash flow
-11.8%
Cash-on-Cash Return
3.4%
Cap rate
0.6%
Rent to Value Ratio
Active
$449,900
3
bds
|
0
ba
|
1,972
sqft
|
built
1987
2466 Thrasher Rd, Buford, GA 30519
$-771
Cash flow
-8.9%
Cash-on-Cash Return
4.1%
Cap rate
0.5%
Rent to Value Ratio
Active
$1,275,000
5
bds
|
0
ba
|
3,528
sqft
|
built
1976
6041 Blackberry Ln, Buford, GA 30518
$-3,509
Cash flow
-14.4%
Cash-on-Cash Return
2.8%
Cap rate
0.4%
Rent to Value Ratio
Active
$525,000
4
bds
|
0
ba
|
3,256
sqft
|
built
2003
3641 Devenwood Way, Buford, GA 30519
$-906
Cash flow
-9.0%
Cash-on-Cash Return
4.1%
Cap rate
0.5%
Rent to Value Ratio