Palm Beach County Investment Properties for Sale
Browse homes for sale and investment properties in Palm Beach County. Refine your search by price, property type, or more.
Best cash flowing properties in Palm Beach County

Active
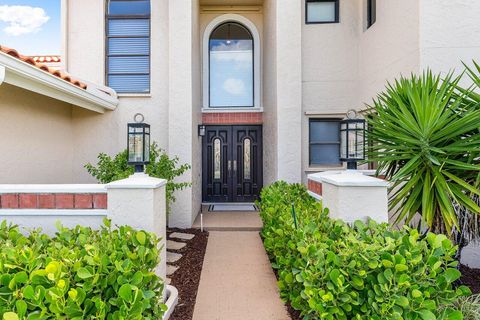
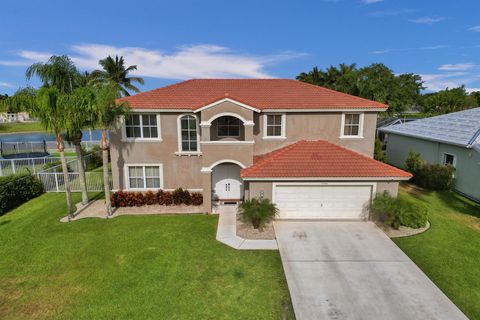
$1,140,000
6
bds
|
5
ba
|
4,079
sqft
|
built
2006
3607 Collonade Dr, Wellington, FL 33449
$166
Cash flow
0.8%
Cash-on-Cash Return
6.3%
Cap rate
1.0%
Rent to Value Ratio
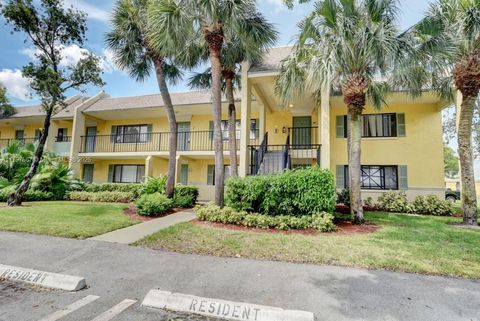
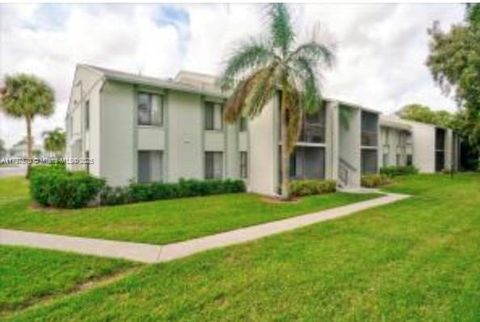
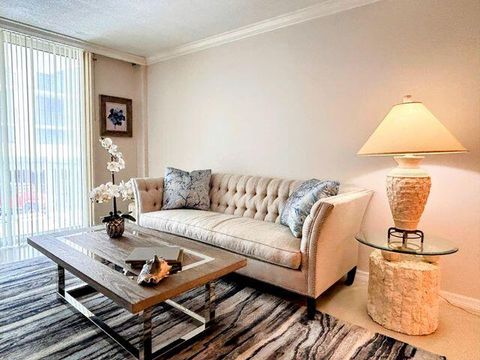
Active
$153,000
1
bds
|
1
ba
|
704
sqft
|
built
1986
1722 Meadows Cir W, Boynton Beach, FL 33436
$-255
Cash flow
-8.7%
Cash-on-Cash Return
4.1%
Cap rate
1.2%
Rent to Value Ratio
4,860 out of 5,888 properties for sale in Palm Beach County
Limited Results Shown
Create a free account, or log in to reveal all property listings and enjoy the complete experience.

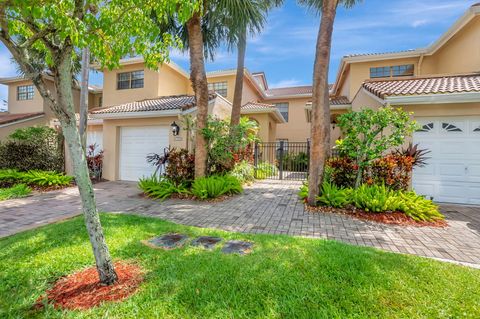
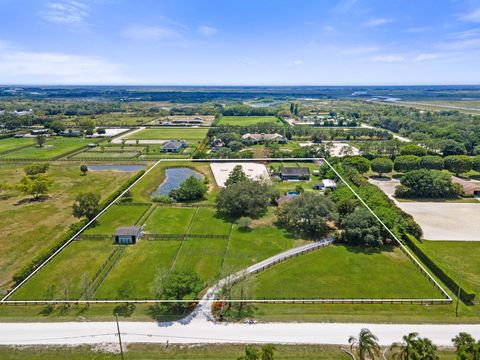
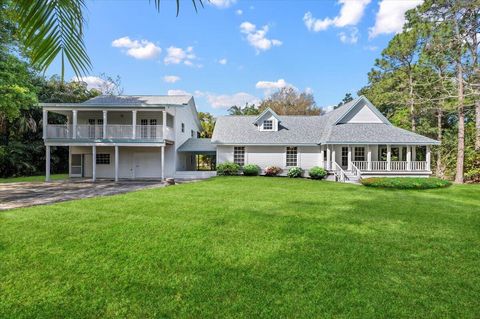
Active
$1,990,900
4
bds
|
3
ba
|
3,800
sqft
|
built
1972
6624 Dillman Rd, Greenacres, FL 33413
$-5,192
Cash flow
-13.6%
Cash-on-Cash Return
3.0%
Cap rate
0.4%
Rent to Value Ratio

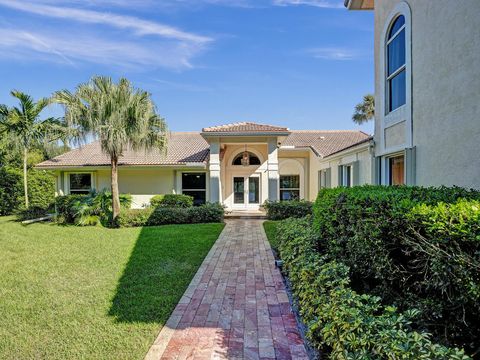
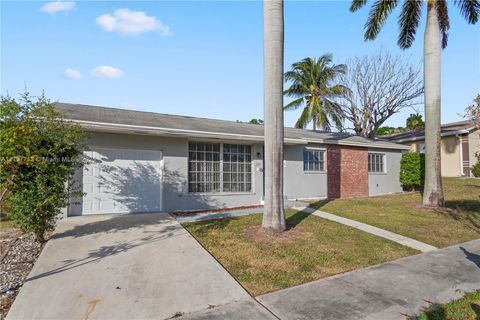
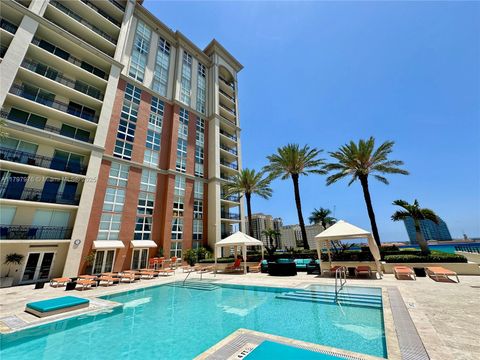
Active
$799,000
2
bds
|
2
ba
|
1,533
sqft
|
built
1982
4600 S Ocean Blvd, Highland Beach, FL 33487
$-2,995
Cash flow
-19.6%
Cash-on-Cash Return
1.6%
Cap rate
0.6%
Rent to Value Ratio
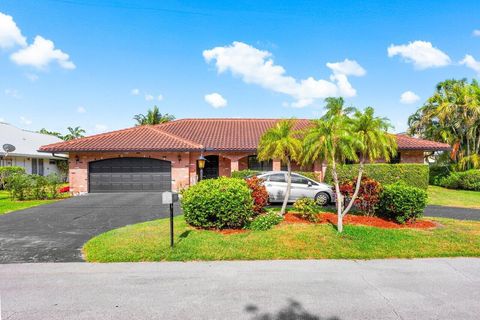
Active
$499,000
3
bds
|
2
ba
|
2,186
sqft
|
built
1993
6730 Montego Bay Blvd, Boca Raton, FL 33433
$-1,272
Cash flow
-13.3%
Cash-on-Cash Return
3.1%
Cap rate
0.8%
Rent to Value Ratio
Active
$1,799,900
5
bds
|
3
ba
|
3,384
sqft
|
built
1987
1120 SW 19th Ave, Boca Raton, FL 33486
$-4,033
Cash flow
-11.7%
Cash-on-Cash Return
3.5%
Cap rate
0.6%
Rent to Value Ratio

Active
$679,000
2
bds
|
2
ba
|
1,175
sqft
|
built
1982
19619 Back Nine Dr, Boca Raton, FL 33498
$-1,160
Cash flow
-8.9%
Cash-on-Cash Return
4.1%
Cap rate
0.7%
Rent to Value Ratio

Active
$773,300
4
bds
|
2
ba
|
2,469
sqft
|
built
1988
1741 Grantham Dr, Wellington, FL 33414
$-610
Cash flow
-4.1%
Cash-on-Cash Return
5.2%
Cap rate
0.8%
Rent to Value Ratio
Active
$2,800,000
4
bds
|
3
ba
|
2,731
sqft
|
built
1976
3163 NE 8th Ave, Boca Raton, FL 33431
$-10,063
Cash flow
-18.8%
Cash-on-Cash Return
1.8%
Cap rate
0.3%
Rent to Value Ratio

Active
$299,000
1
bds
|
2
ba
|
998
sqft
|
built
1979
859 Jeffery St, Boca Raton, FL 33487
$-992
Cash flow
-17.3%
Cash-on-Cash Return
2.2%
Cap rate
0.9%
Rent to Value Ratio
Active
$489,900
3
bds
|
2
ba
|
1,987
sqft
|
built
1980
6433 33rd Ct S, Lake Worth, FL 33463
$-1,089
Cash flow
-11.6%
Cash-on-Cash Return
3.5%
Cap rate
0.5%
Rent to Value Ratio

Active
$994,970
3
bds
|
3
ba
|
2,035
sqft
|
built
1992
635 Masters Way, Palm Beach Gardens, FL 33418
$-2,699
Cash flow
-14.2%
Cash-on-Cash Return
2.9%
Cap rate
0.5%
Rent to Value Ratio
Active
$579,900
3
bds
|
2
ba
|
1,746
sqft
|
built
1985
101 Sea Oats Dr, Juno Beach, FL 33408
$-1,994
Cash flow
-17.9%
Cash-on-Cash Return
2.0%
Cap rate
0.7%
Rent to Value Ratio

Active
$1,129,000
4
bds
|
3
ba
|
2,918
sqft
|
built
1992
95 Westwood Cir E, Royal Palm Beach, FL 33411
$-2,110
Cash flow
-9.8%
Cash-on-Cash Return
3.9%
Cap rate
0.5%
Rent to Value Ratio

Active
$285,000
2
bds
|
2
ba
|
1,232
sqft
|
built
1978
211 Lake Arbor Dr, Palm Springs, FL 33461
$-587
Cash flow
-10.7%
Cash-on-Cash Return
3.7%
Cap rate
0.8%
Rent to Value Ratio

Active
$825,000
2
bds
|
2
ba
|
1,426
sqft
|
built
1979
4748 S Ocean Blvd, Highland Beach, FL 33487
$-2,695
Cash flow
-17.0%
Cash-on-Cash Return
2.2%
Cap rate
0.6%
Rent to Value Ratio
Active
$4,450,000
7
bds
|
8
ba
|
5,703
sqft
|
built
1994
18680 Long Lake Dr, Boca Raton, FL 33496
$-21,543
Cash flow
-25.3%
Cash-on-Cash Return
0.3%
Cap rate
0.2%
Rent to Value Ratio
Active
$189,000
2
bds
|
2
ba
|
1,400
sqft
|
built
1979
23247 Barwood Ln N, Boca Raton, FL 33428
$-369
Cash flow
-10.2%
Cash-on-Cash Return
3.8%
Cap rate
1.2%
Rent to Value Ratio

Active
$185,000
2
bds
|
2
ba
|
904
sqft
|
built
1986
1520 Lake Crystal Dr, Royal Palm Beach, FL 33411
$-294
Cash flow
-8.3%
Cash-on-Cash Return
4.2%
Cap rate
1.1%
Rent to Value Ratio

Active
$670,000
4
bds
|
2
ba
|
1,977
sqft
|
built
2006
13209 Temple Blvd, West Palm Beach, FL 33412
$-1,164
Cash flow
-9.1%
Cash-on-Cash Return
4.1%
Cap rate
0.6%
Rent to Value Ratio

Active
$185,000
2
bds
|
2
ba
|
904
sqft
|
built
1986
1440 Lake Crystal Dr, West Palm Beach, FL 33411
$-359
Cash flow
-10.1%
Cash-on-Cash Return
3.8%
Cap rate
1.0%
Rent to Value Ratio
Active
$525,000
3
bds
|
3
ba
|
1,895
sqft
|
built
2021
4790 Blistering Way, Lake Worth, FL 33467
$-1,218
Cash flow
-12.1%
Cash-on-Cash Return
3.4%
Cap rate
0.7%
Rent to Value Ratio
Active
$749,000
bds
|
0
ba
|
2,006
sqft
|
built
1950
902 N J St, Lake Worth, FL 33460
$-3,540
Cash flow
-24.7%
Cash-on-Cash Return
0.5%
Cap rate
0.2%
Rent to Value Ratio

Active
$2,699,000
4
bds
|
4
ba
|
3,274
sqft
|
built
1994
1785 Flagler Manor Cir, Royal Palm Beach, FL 33411
$-10,488
Cash flow
-20.3%
Cash-on-Cash Return
1.5%
Cap rate
0.3%
Rent to Value Ratio
Active
$733,000
4
bds
|
3
ba
|
2,372
sqft
|
built
2000
5349 Oakmont Village Cir, Lake Worth, FL 33463
$-1,575
Cash flow
-11.2%
Cash-on-Cash Return
3.6%
Cap rate
0.6%
Rent to Value Ratio
Active
$865,000
2
bds
|
3
ba
|
1,639
sqft
|
built
1985
19800 Sandpointe Bay Dr, Tequesta, FL 33469
$-1,416
Cash flow
-8.5%
Cash-on-Cash Return
4.2%
Cap rate
0.8%
Rent to Value Ratio
Active
$1,190,000
5
bds
|
4
ba
|
3,223
sqft
|
built
1990
11217 Island Lakes Ln, Boca Raton, FL 33498
$-2,614
Cash flow
-11.5%
Cash-on-Cash Return
3.5%
Cap rate
0.5%
Rent to Value Ratio

Active
$550,000
3
bds
|
2
ba
|
1,231
sqft
|
built
1959
602 S Caloosahatchee Ave, Jupiter, FL 33458
$-580
Cash flow
-5.5%
Cash-on-Cash Return
4.9%
Cap rate
0.7%
Rent to Value Ratio
Active
$229,000
2
bds
|
2
ba
|
1,106
sqft
|
built
1986
3664 Alder Dr, West Palm Beach, FL 33417
$-492
Cash flow
-11.2%
Cash-on-Cash Return
3.6%
Cap rate
0.9%
Rent to Value Ratio

Active
$849,900
3
bds
|
3
ba
|
1,888
sqft
|
built
1957
2410 SW 1st St, Boynton Beach, FL 33435
$-2,331
Cash flow
-14.3%
Cash-on-Cash Return
2.9%
Cap rate
0.4%
Rent to Value Ratio
Active
$1,795,000
5
bds
|
3
ba
|
2,370
sqft
|
built
1989
16820 Deer Path Ln, Wellington, FL 33470
$-5,509
Cash flow
-16.0%
Cash-on-Cash Return
2.5%
Cap rate
0.4%
Rent to Value Ratio
Active
$455,000
3
bds
|
2
ba
|
1,388
sqft
|
built
1976
1732 16th Ave N, Lake Worth, FL 33460
$-767
Cash flow
-8.8%
Cash-on-Cash Return
4.1%
Cap rate
0.7%
Rent to Value Ratio
Active
$725,000
5
bds
|
3
ba
|
2,673
sqft
|
built
2001
6396 Shadow Creek Village Cir, Lake Worth, FL 33463
$-1,778
Cash flow
-12.8%
Cash-on-Cash Return
3.2%
Cap rate
0.6%
Rent to Value Ratio
Active
$459,999
2
bds
|
2
ba
|
1,064
sqft
|
built
1969
125 Ocean Ave, Palm Beach Shores, FL 33404
$-2,464
Cash flow
-27.9%
Cash-on-Cash Return
-0.3%
Cap rate
0.4%
Rent to Value Ratio
Active
$899,000
3
bds
|
0
ba
|
2,784
sqft
|
built
1991
17647 112th Dr N, Jupiter, FL 33478
$-1,286
Cash flow
-7.5%
Cash-on-Cash Return
4.4%
Cap rate
0.7%
Rent to Value Ratio
Active
$465,000
1
bds
|
1
ba
|
755
sqft
|
built
2008
550 Okeechobee Blvd, West Palm Beach, FL 33401
$-1,671
Cash flow
-18.7%
Cash-on-Cash Return
1.8%
Cap rate
0.6%
Rent to Value Ratio

Active
$43,850,000
7
bds
|
9
ba
|
11,000
sqft
|
built
2017
3715 S Ocean Blvd, Highland Beach, FL 33487
$-252,678
Cash flow
-30.1%
Cash-on-Cash Return
-0.8%
Cap rate
0.0%
Rent to Value Ratio

Active
$325,000
3
bds
|
3
ba
|
1,514
sqft
|
built
1982
4102 Waterview Cir, Palm Springs, FL 33461
$-601
Cash flow
-9.6%
Cash-on-Cash Return
3.9%
Cap rate
0.8%
Rent to Value Ratio

Active
$389,900
4
bds
|
3
ba
|
1,595
sqft
|
built
2003
8023 Big Pine Way, Riviera Beach, FL 33407
$-656
Cash flow
-8.8%
Cash-on-Cash Return
4.1%
Cap rate
0.7%
Rent to Value Ratio
Active
$640,000
3
bds
|
2
ba
|
1,110
sqft
|
built
1961
736 Tradewind Dr, North Palm Beach, FL 33408
$-1,072
Cash flow
-8.7%
Cash-on-Cash Return
4.1%
Cap rate
0.5%
Rent to Value Ratio