Hendricks County Investment Properties for Sale
Browse homes for sale and investment properties in Hendricks County. Refine your search by price, property type, or more.
Best cash flowing properties in Hendricks County
Active
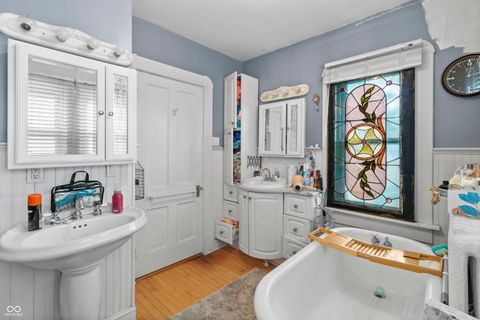
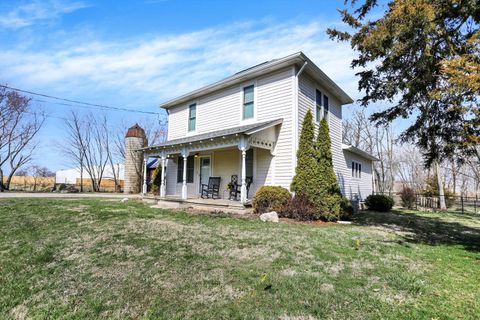
$310,000
3
bds
|
2
ba
|
2,087
sqft
|
built
1926
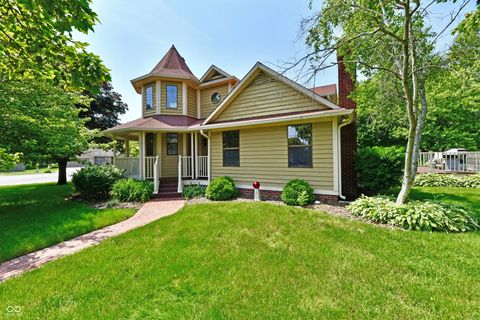
38 W Main St, Brownsburg, IN 46112
$137
Cash flow
2.3%
Cash-on-Cash Return
6.7%
Cap rate
0.8%
Rent to Value Ratio
Active
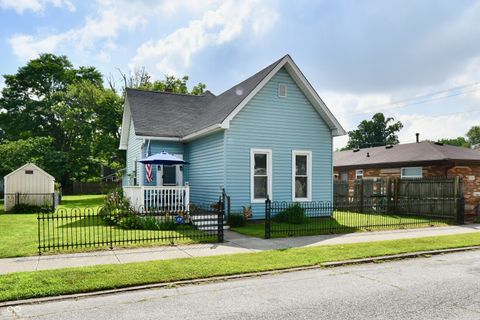
$218,000
2
bds
|
1
ba
|
1,166
sqft
|
built
1920
323 S Vine St, Plainfield, IN 46168
$125
Cash flow
3.0%
Cash-on-Cash Return
6.8%
Cap rate
0.8%
Rent to Value Ratio
221 out of 246 properties for sale in Hendricks County
Limited Results Shown
Create a free account, or log in to reveal all property listings and enjoy the complete experience.
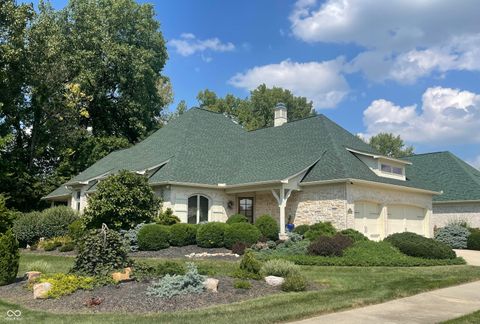
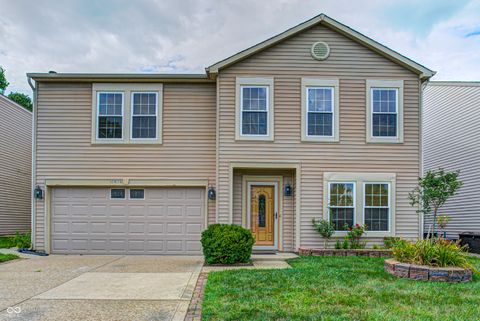
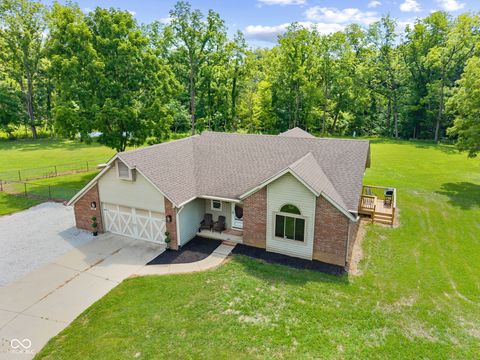
Active
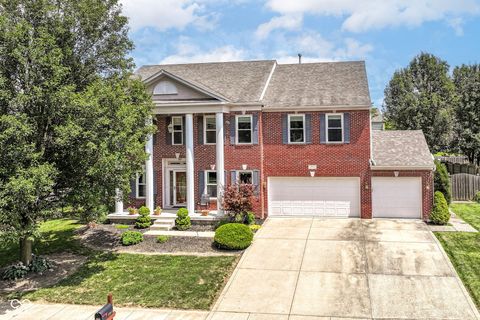
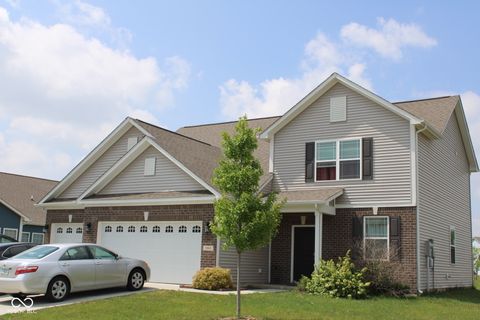
$429,900
4
bds
|
5
ba
|
5,484
sqft
|
built
2002
5813 Grandvista Dr, Indianapolis, IN 46234
$37
Cash flow
0.4%
Cash-on-Cash Return
6.2%
Cap rate
0.8%
Rent to Value Ratio
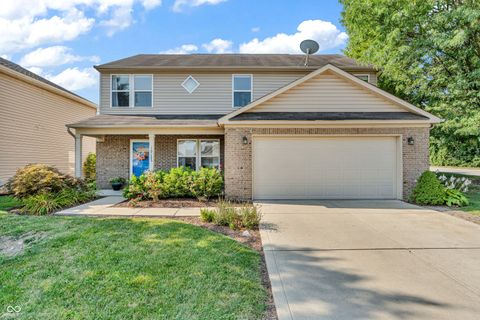
Active
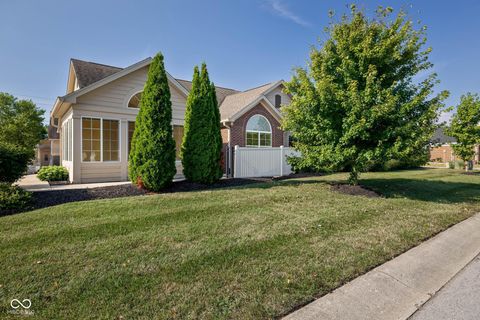
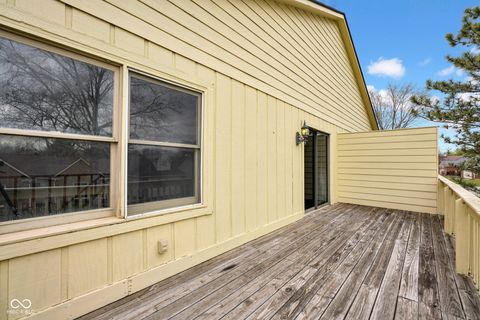
$300,000
2
bds
|
2
ba
|
1,830
sqft
|
built
2016
10327 Gateway Dr, Indianapolis, IN 46234
$-369
Cash flow
-6.4%
Cash-on-Cash Return
4.7%
Cap rate
0.7%
Rent to Value Ratio
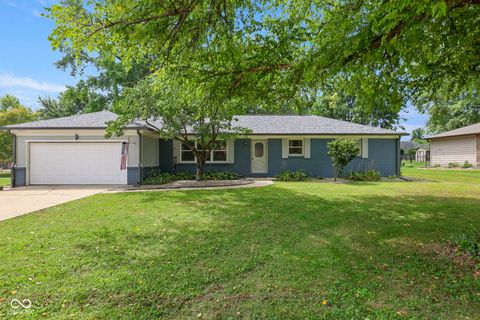
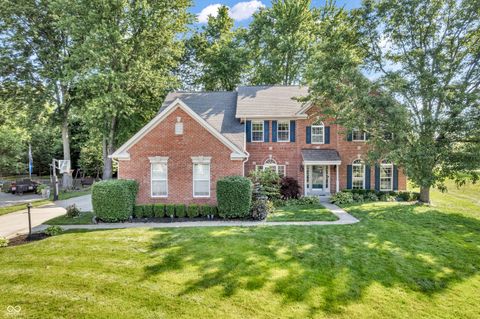
Active
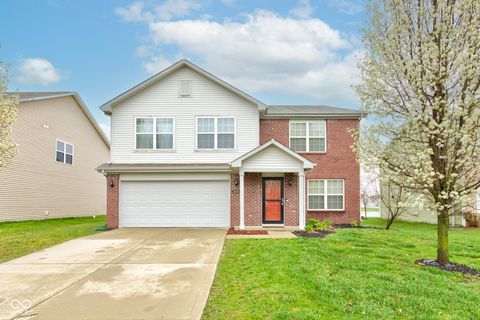
$575,900
3
bds
|
3
ba
|
3,742
sqft
|
built
2003
3325 Nottinghill Dr E, Plainfield, IN 46168
$-1,493
Cash flow
-13.5%
Cash-on-Cash Return
3.0%
Cap rate
0.4%
Rent to Value Ratio
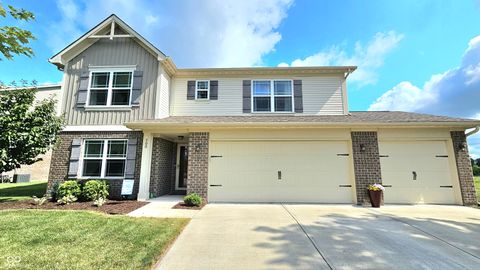
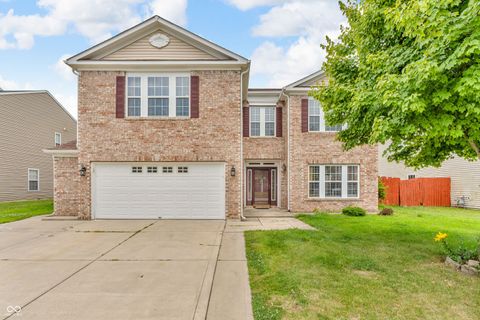
Active
$340,000
4
bds
|
3
ba
|
2,350
sqft
|
built
2004
10123 Morning Light Dr, Avon, IN 46123
$-179
Cash flow
-2.7%
Cash-on-Cash Return
5.5%
Cap rate
0.7%
Rent to Value Ratio
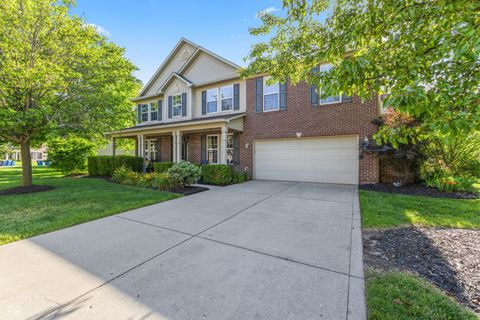
Active
$290,000
3
bds
|
2
ba
|
1,652
sqft
|
built
1974
21 Hilltop Dr, Danville, IN 46122
$-106
Cash flow
-1.9%
Cash-on-Cash Return
5.7%
Cap rate
0.7%
Rent to Value Ratio
Active
$380,000
4
bds
|
3
ba
|
2,478
sqft
|
built
2018
700 Jefferson Park Dr, Pittsboro, IN 46167
$-253
Cash flow
-3.5%
Cash-on-Cash Return
5.3%
Cap rate
0.7%
Rent to Value Ratio
Active
$299,900
3
bds
|
3
ba
|
1,550
sqft
|
built
1978
4303 Kings Ln, Plainfield, IN 46168
$-156
Cash flow
-2.7%
Cash-on-Cash Return
5.5%
Cap rate
0.7%
Rent to Value Ratio
Active
$469,900
4
bds
|
4
ba
|
4,317
sqft
|
built
2002
1321 Mayapple Dr, Brownsburg, IN 46112
$-455
Cash flow
-5.1%
Cash-on-Cash Return
5.0%
Cap rate
0.6%
Rent to Value Ratio
Active
$340,000
3
bds
|
3
ba
|
2,092
sqft
|
built
1994
486 Hyannis Dr, Avon, IN 46123
$-380
Cash flow
-5.8%
Cash-on-Cash Return
4.8%
Cap rate
0.6%
Rent to Value Ratio
Active
$305,000
3
bds
|
3
ba
|
2,040
sqft
|
built
2003
10671 Riverwood Blvd, Indianapolis, IN 46234
$-82
Cash flow
-1.4%
Cash-on-Cash Return
5.8%
Cap rate
0.7%
Rent to Value Ratio
Active
$294,900
3
bds
|
3
ba
|
2,562
sqft
|
built
2006
10924 Cyrus Dr, Indianapolis, IN 46231
$-95
Cash flow
-1.7%
Cash-on-Cash Return
5.8%
Cap rate
0.7%
Rent to Value Ratio
Active
$359,500
3
bds
|
3
ba
|
2,905
sqft
|
built
1979
5962 Oak Hill West Dr, Plainfield, IN 46168
$-186
Cash flow
-2.7%
Cash-on-Cash Return
5.5%
Cap rate
0.7%
Rent to Value Ratio
Active
$245,000
2
bds
|
1
ba
|
1,096
sqft
|
built
1958
210 Kentucky Ave, Plainfield, IN 46168
$-289
Cash flow
-6.2%
Cash-on-Cash Return
4.7%
Cap rate
0.6%
Rent to Value Ratio
Active
$399,900
4
bds
|
3
ba
|
2,977
sqft
|
built
2001
1844 Creekside Dr, Brownsburg, IN 46112
$-356
Cash flow
-4.6%
Cash-on-Cash Return
5.1%
Cap rate
0.6%
Rent to Value Ratio
Active
$430,000
3
bds
|
2
ba
|
1,451
sqft
|
built
1993
4359 N State Road 75, North Salem, IN 46165
$-823
Cash flow
-10.0%
Cash-on-Cash Return
3.9%
Cap rate
0.5%
Rent to Value Ratio
Active
$468,000
4
bds
|
3
ba
|
3,848
sqft
|
built
2001
6374 Timberbluff Cir, Avon, IN 46123
$-308
Cash flow
-3.4%
Cash-on-Cash Return
5.4%
Cap rate
0.7%
Rent to Value Ratio
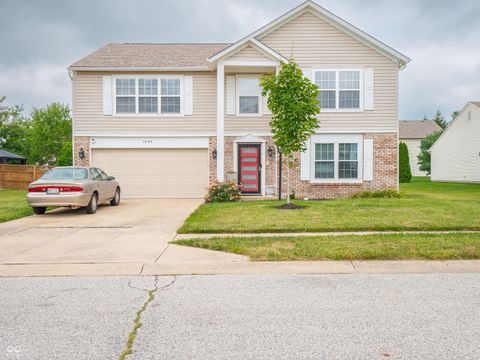
Active
$379,900
5
bds
|
3
ba
|
3,592
sqft
|
built
2005
1449 Danielle Dr, Indianapolis, IN 46231
$-392
Cash flow
-5.4%
Cash-on-Cash Return
4.9%
Cap rate
0.6%
Rent to Value Ratio
Active
$399,000
4
bds
|
3
ba
|
3,141
sqft
|
built
2003
1783 Trillium Ct, Avon, IN 46123
$-303
Cash flow
-4.0%
Cash-on-Cash Return
5.2%
Cap rate
0.7%
Rent to Value Ratio
Active
$204,900
3
bds
|
2
ba
|
1,190
sqft
|
built
1963
5667 Broyles Rd, Avon, IN 46123
$123
Cash flow
3.1%
Cash-on-Cash Return
6.9%
Cap rate
0.8%
Rent to Value Ratio
Active
$425,620
4
bds
|
3
ba
|
2,500
sqft
|
built
1989
1010 Lakewood South Dr, Brownsburg, IN 46112
$-472
Cash flow
-5.8%
Cash-on-Cash Return
4.8%
Cap rate
0.6%
Rent to Value Ratio
Active
$850,000
7
bds
|
6
ba
|
7,671
sqft
|
built
1994
6013 Yellow Birch Ct, Avon, IN 46123
$-1,259
Cash flow
-7.7%
Cash-on-Cash Return
4.4%
Cap rate
0.5%
Rent to Value Ratio
Active
$397,500
3
bds
|
3
ba
|
2,517
sqft
|
built
1997
466 Sycamore Ridge Ct, Avon, IN 46123
$-108
Cash flow
-1.4%
Cash-on-Cash Return
5.8%
Cap rate
0.7%
Rent to Value Ratio
Active
$349,900
2
bds
|
3
ba
|
1,819
sqft
|
built
2003
1238 Passage Way, Plainfield, IN 46168
$-167
Cash flow
-2.5%
Cash-on-Cash Return
5.6%
Cap rate
0.7%
Rent to Value Ratio
Active
$1,995,000
5
bds
|
5
ba
|
6,013
sqft
|
built
2004
9615 N County Road 150 E, Pittsboro, IN 46167
$-6,631
Cash flow
-17.3%
Cash-on-Cash Return
2.2%
Cap rate
0.3%
Rent to Value Ratio
Active
$550,000
3
bds
|
2
ba
|
1,698
sqft
|
built
1973
1914 S Avon Ave, Avon, IN 46123
$-1,437
Cash flow
-13.6%
Cash-on-Cash Return
3.0%
Cap rate
0.4%
Rent to Value Ratio
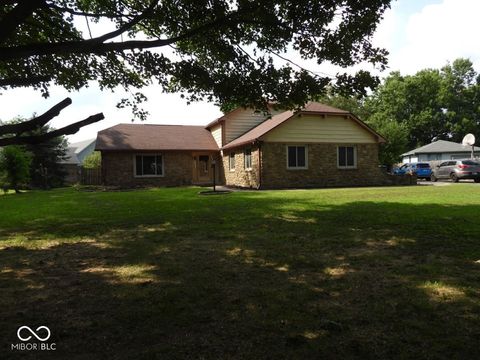
Active
$1,400,000
3
bds
|
2
ba
|
1,631
sqft
|
built
1987
7811 N County Road 500 E, Pittsboro, IN 46167
$-5,791
Cash flow
-21.6%
Cash-on-Cash Return
1.2%
Cap rate
0.1%
Rent to Value Ratio
Active
$649,000
3
bds
|
4
ba
|
1,626
sqft
|
built
1926
10270 E County Road 450 N, Indianapolis, IN 46234
$-1,324
Cash flow
-10.6%
Cash-on-Cash Return
3.7%
Cap rate
0.4%
Rent to Value Ratio
Active
$385,000
5
bds
|
3
ba
|
2,518
sqft
|
built
2021
9068 Thames Dr, Avon, IN 46123
$-247
Cash flow
-3.3%
Cash-on-Cash Return
5.4%
Cap rate
0.6%
Rent to Value Ratio
Active
$219,000
2
bds
|
3
ba
|
1,580
sqft
|
built
1980
1847 Crystal Bay East Dr, Plainfield, IN 46168
$-130
Cash flow
-3.1%
Cash-on-Cash Return
5.4%
Cap rate
0.8%
Rent to Value Ratio
Active
$339,900
4
bds
|
3
ba
|
2,895
sqft
|
built
2015
1839 Silverton Dr, Avon, IN 46123
$-38
Cash flow
-0.6%
Cash-on-Cash Return
6.0%
Cap rate
0.7%
Rent to Value Ratio
Active
$410,000
3
bds
|
3
ba
|
2,732
sqft
|
built
1992
6983 White Oak Dr, Avon, IN 46123
$-379
Cash flow
-4.8%
Cash-on-Cash Return
5.0%
Cap rate
0.6%
Rent to Value Ratio
Active
$215,900
3
bds
|
4
ba
|
2,170
sqft
|
built
1974
5177 Fairway Dr, Avon, IN 46123
$-281
Cash flow
-6.8%
Cash-on-Cash Return
4.6%
Cap rate
0.8%
Rent to Value Ratio
Active
$545,000
4
bds
|
2
ba
|
2,249
sqft
|
built
1974
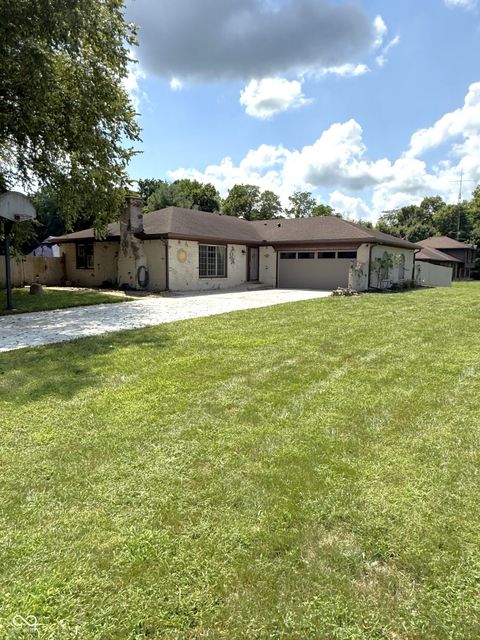
3046 Cartersburg Rd, Danville, IN 46122
$-1,067
Cash flow
-10.2%
Cash-on-Cash Return
3.8%
Cap rate
0.5%
Rent to Value Ratio
Active
$654,900
3
bds
|
3
ba
|
2,778
sqft
|
built
1986
9345 N County Road 800 E, Brownsburg, IN 46112
$-1,630
Cash flow
-13.0%
Cash-on-Cash Return
3.2%
Cap rate
0.4%
Rent to Value Ratio
Active
$389,900
4
bds
|
3
ba
|
2,993
sqft
|
built
1999
714 Thornburg Pkwy, Brownsburg, IN 46112
$-285
Cash flow
-3.8%
Cash-on-Cash Return
5.3%
Cap rate
0.6%
Rent to Value Ratio
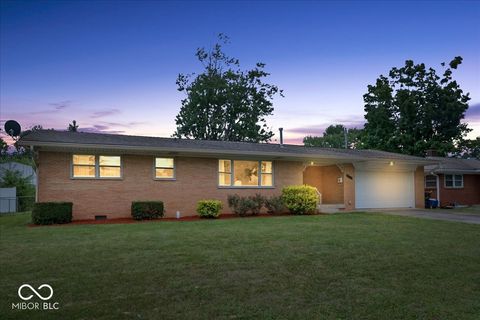
Active
$275,000
3
bds
|
2
ba
|
1,400
sqft
|
built
1974
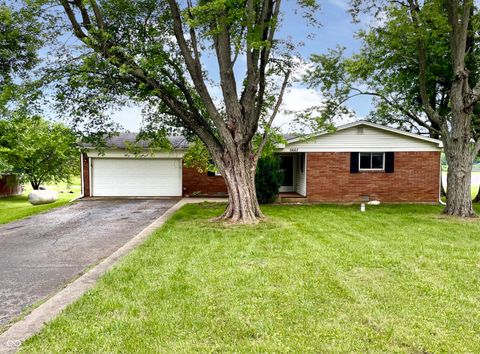
4309 Clifford Rd, Brownsburg, IN 46112
$109
Cash flow
2.1%
Cash-on-Cash Return
6.6%
Cap rate
0.8%
Rent to Value Ratio
Active
$335,000
3
bds
|
3
ba
|
2,857
sqft
|
built
2001
9300 Amberleigh Dr, Plainfield, IN 46168
$-364
Cash flow
-5.7%
Cash-on-Cash Return
4.8%
Cap rate
0.6%
Rent to Value Ratio
Active
$550,000
3
bds
|
2
ba
|
1,872
sqft
|
built
1945
3425 Campbell St, Plainfield, IN 46168
$-1,575
Cash flow
-14.9%
Cash-on-Cash Return
2.7%
Cap rate
0.3%
Rent to Value Ratio