Indiana Investment Properties for Sale
Browse homes for sale and investment properties in Indiana. Refine your search by price, property type, or more.
Best cash flowing properties in Indiana
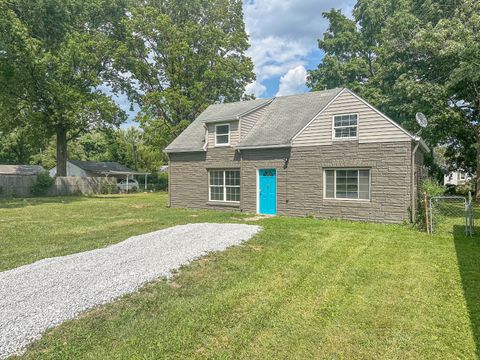
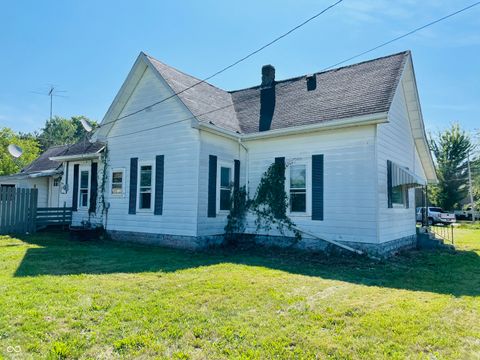
Active
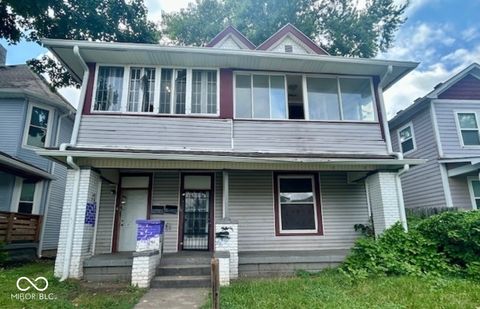
$70,500
3
bds
|
2
ba
|
2,010
sqft
|
built
1930
807 N Alabama St, Brazil, IN 47834
$966
Cash flow
16.0%
Cash-on-Cash Return
16.4%
Cap rate
2.0%
Rent to Value Ratio
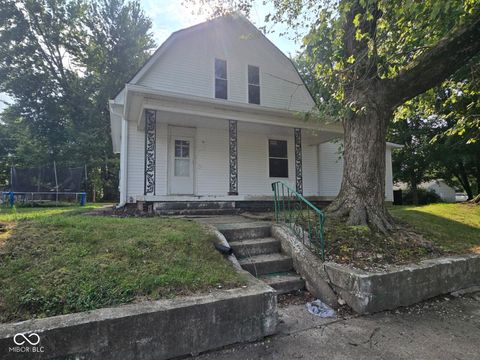
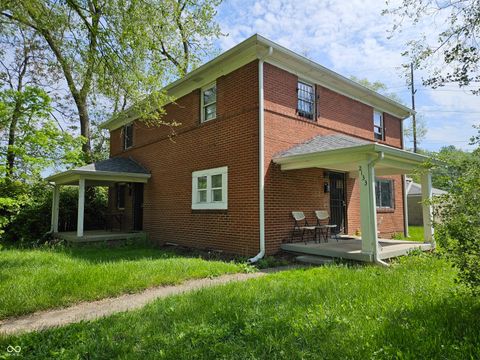
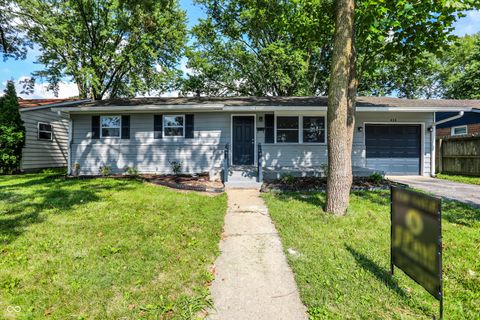
Active
$37,000
2
bds
|
1
ba
|
890
sqft
|
built
1955
401 Eastern Ave, Indianapolis, IN 46201
$828
Cash flow
26.1%
Cash-on-Cash Return
26.9%
Cap rate
3.2%
Rent to Value Ratio
3,523 out of 4,356 properties for sale in Indiana
Limited Results Shown
Create a free account, or log in to reveal all property listings and enjoy the complete experience.
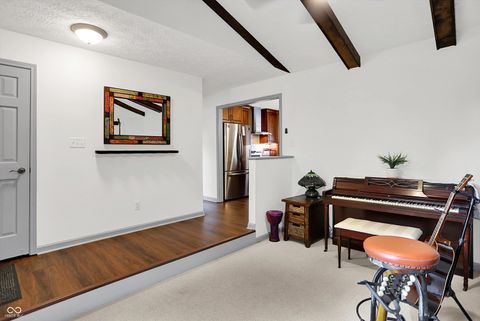
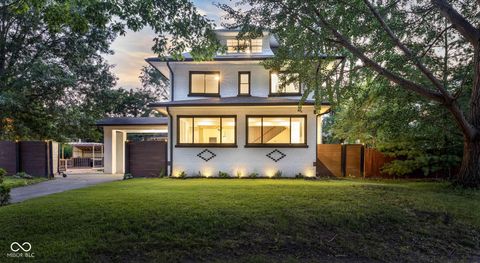
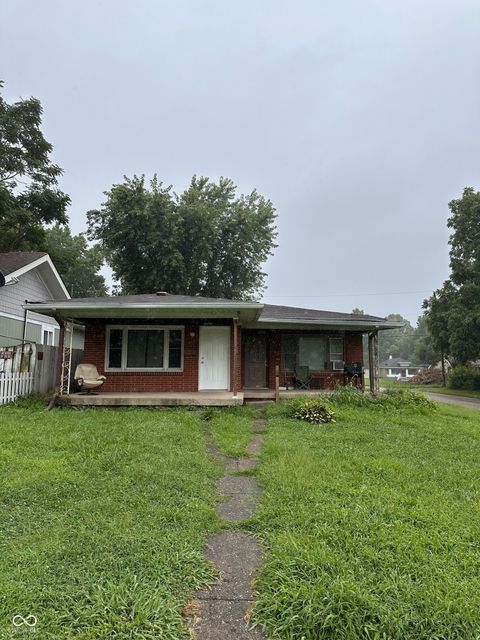
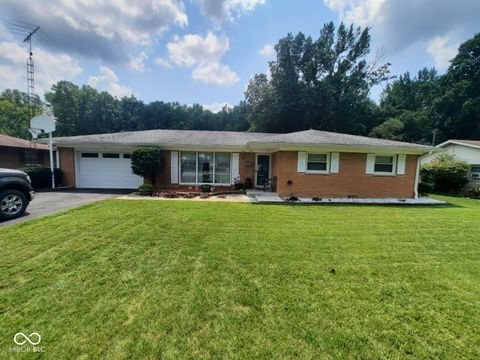
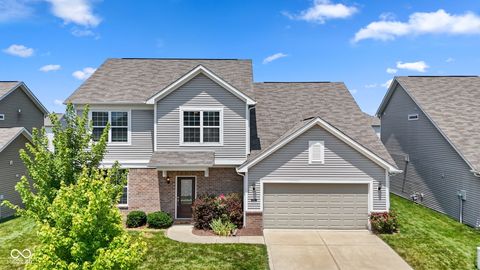
Active
$330,000
3
bds
|
2
ba
|
1,618
sqft
|
built
1976
11253 Maze Rd, Indianapolis, IN 46259
$-103
Cash flow
-1.6%
Cash-on-Cash Return
5.8%
Cap rate
0.7%
Rent to Value Ratio

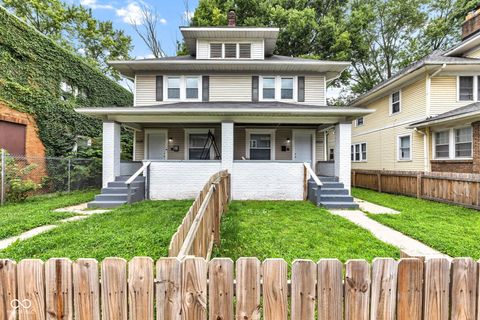
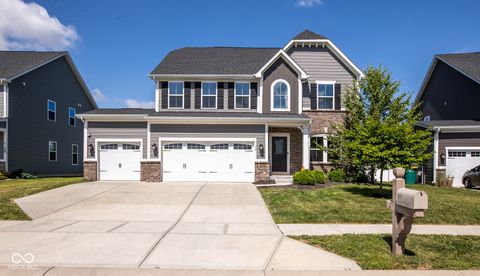
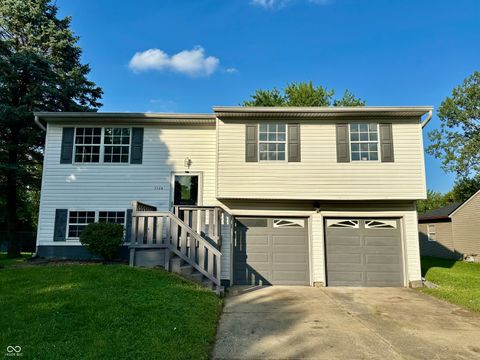
Active
$110,000
2
bds
|
1
ba
|
768
sqft
|
built
1926
1521 E Legrande Ave, Indianapolis, IN 46203
$334
Cash flow
15.8%
Cash-on-Cash Return
9.8%
Cap rate
1.2%
Rent to Value Ratio

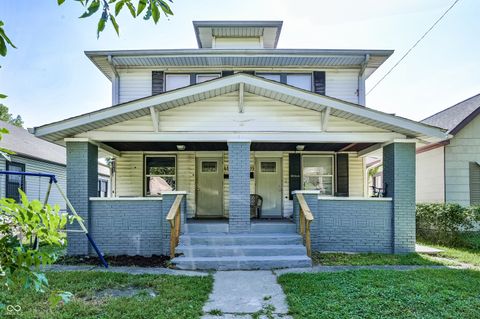
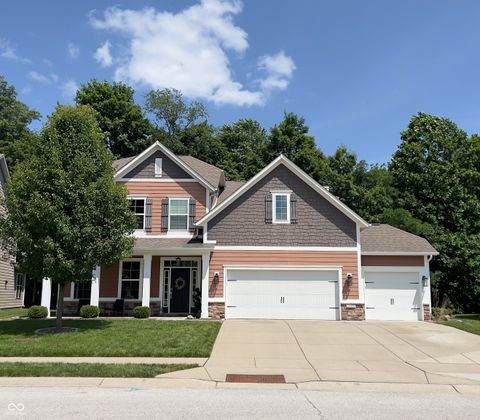
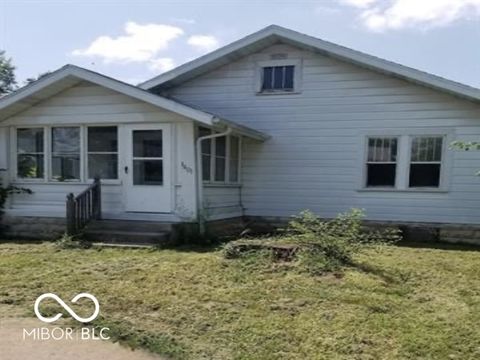
Active
$224,900
3
bds
|
2
ba
|
1,258
sqft
|
built
2007
4264 Arches Ct, Indianapolis, IN 46235
$90
Cash flow
2.1%
Cash-on-Cash Return
6.6%
Cap rate
0.8%
Rent to Value Ratio

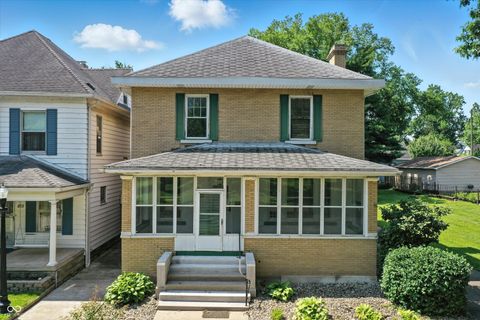
Active
$175,000
2
bds
|
1
ba
|
1,074
sqft
|
built
1987
7712 Willowood St, Indianapolis, IN 46214
$208
Cash flow
6.2%
Cash-on-Cash Return
7.6%
Cap rate
0.9%
Rent to Value Ratio
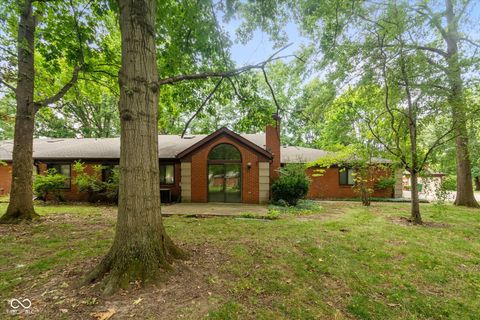
Active
$239,900
3
bds
|
2
ba
|
1,633
sqft
|
built
1985
2203 Oak Run Pl, Indianapolis, IN 46260
$-159
Cash flow
-3.5%
Cash-on-Cash Return
5.4%
Cap rate
0.8%
Rent to Value Ratio
Active
$175,000
2
bds
|
2
ba
|
1,728
sqft
|
built
1941
35 N Fenton Ave, Indianapolis, IN 46219
$70
Cash flow
2.1%
Cash-on-Cash Return
6.6%
Cap rate
0.8%
Rent to Value Ratio

Active
$250,000
3
bds
|
3
ba
|
1,760
sqft
|
built
2016
1716 Prospect St, Indianapolis, IN 46203
$237
Cash flow
4.9%
Cash-on-Cash Return
7.3%
Cap rate
0.9%
Rent to Value Ratio
Active
$599,000
3
bds
|
4
ba
|
3,356
sqft
|
built
1920
3118 E Fall Creek Parkway North Dr, Indianapolis, IN 46205
$-1,481
Cash flow
-12.9%
Cash-on-Cash Return
3.2%
Cap rate
0.4%
Rent to Value Ratio

Active
$499,900
0
bds
|
0
ba
|
0
sqft
|
built
1925
5549 N College Ave, Indianapolis, IN 46220
$-1,043
Cash flow
-10.9%
Cash-on-Cash Return
3.6%
Cap rate
0.4%
Rent to Value Ratio
Active
$380,000
2
bds
|
0
ba
|
0
sqft
|
built
1911
3626 Birchwood Ave, Indianapolis, IN 46205
$-843
Cash flow
-11.6%
Cash-on-Cash Return
3.5%
Cap rate
0.4%
Rent to Value Ratio
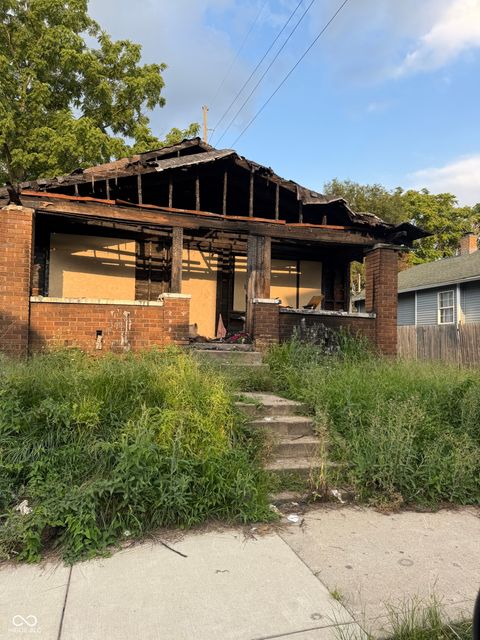
Active
$240,000
0
bds
|
0
ba
|
0
sqft
|
built
1910
409 N Gladstone Ave, Indianapolis, IN 46201
$-470
Cash flow
-10.2%
Cash-on-Cash Return
3.8%
Cap rate
0.5%
Rent to Value Ratio
Active
$169,999
0
bds
|
0
ba
|
0
sqft
|
built
1910
2918 N Kenwood Ave, Indianapolis, IN 46208
$-181
Cash flow
-5.6%
Cash-on-Cash Return
4.9%
Cap rate
0.6%
Rent to Value Ratio
Active
$190,000
0
bds
|
0
ba
|
0
sqft
|
built
1950
2133 Winfield Ave, Indianapolis, IN 46222
$-7
Cash flow
-0.2%
Cash-on-Cash Return
6.1%
Cap rate
0.7%
Rent to Value Ratio
Active
$159,900
2
bds
|
0
ba
|
0
sqft
|
built
1956
1263 W 32nd St, Indianapolis, IN 46208
$-60
Cash flow
-2.0%
Cash-on-Cash Return
5.7%
Cap rate
0.7%
Rent to Value Ratio

Active
$165,000
0
bds
|
0
ba
|
0
sqft
|
built
1915
333 Leeds Ave, Indianapolis, IN 46201
$-362
Cash flow
-11.4%
Cash-on-Cash Return
3.5%
Cap rate
0.4%
Rent to Value Ratio
Active
$430,000
4
bds
|
3
ba
|
4,095
sqft
|
built
2019
7128 Verwood Ct, Plainfield, IN 46168
$-237
Cash flow
-2.9%
Cash-on-Cash Return
5.5%
Cap rate
0.7%
Rent to Value Ratio
Active
$249,000
3
bds
|
2
ba
|
912
sqft
|
built
1968
416 Linden Ln, Plainfield, IN 46168
$-34
Cash flow
-0.7%
Cash-on-Cash Return
6.0%
Cap rate
0.7%
Rent to Value Ratio
Active
$204,900
3
bds
|
2
ba
|
1,386
sqft
|
built
1955
208 South St, North Vernon, IN 47265
$-84
Cash flow
-2.1%
Cash-on-Cash Return
5.7%
Cap rate
0.7%
Rent to Value Ratio
Active
$460,000
4
bds
|
3
ba
|
5,160
sqft
|
built
2015
737 Bracknell Dr, Avon, IN 46123
$-507
Cash flow
-5.8%
Cash-on-Cash Return
4.8%
Cap rate
0.6%
Rent to Value Ratio
Active
$90,000
2
bds
|
1
ba
|
1,208
sqft
|
built
1940
307 N Main St, Wilkinson, IN 46186
$505
Cash flow
29.3%
Cash-on-Cash Return
12.9%
Cap rate
1.6%
Rent to Value Ratio
Active
$374,900
4
bds
|
3
ba
|
2,458
sqft
|
built
2016
5398 Marigold Dr, Plainfield, IN 46168
$-248
Cash flow
-3.5%
Cash-on-Cash Return
5.4%
Cap rate
0.7%
Rent to Value Ratio

Active
$325,000
2
bds
|
1
ba
|
1,170
sqft
|
built
1997
3609 Mockingbird Ln, Nashville, IN 47448
$-306
Cash flow
-4.9%
Cash-on-Cash Return
5.0%
Cap rate
0.6%
Rent to Value Ratio
Active
$234,900
4
bds
|
2
ba
|
1,440
sqft
|
built
1982
7739 Inverness Dr, Indianapolis, IN 46237
$-30
Cash flow
-0.7%
Cash-on-Cash Return
6.0%
Cap rate
0.7%
Rent to Value Ratio
Active
$78,900
2
bds
|
1
ba
|
896
sqft
|
built
1925
1401 S Emerson Ct, Muncie, IN 47302
$217
Cash flow
14.3%
Cash-on-Cash Return
9.4%
Cap rate
1.1%
Rent to Value Ratio
Active
$165,000
5
bds
|
3
ba
|
3,006
sqft
|
built
1910
809 Maple Ave, Terre Haute, IN 47804
$397
Cash flow
12.6%
Cash-on-Cash Return
9.0%
Cap rate
1.1%
Rent to Value Ratio
Active
$289,900
3
bds
|
3
ba
|
2,072
sqft
|
built
1905
825 Main St, Elwood, IN 46036
$-381
Cash flow
-6.9%
Cash-on-Cash Return
4.6%
Cap rate
0.6%
Rent to Value Ratio
Active
$699,000
4
bds
|
2
ba
|
2,496
sqft
|
built
1900
10750 E 550 N, Wilkinson, IN 46186
$-2,477
Cash flow
-18.5%
Cash-on-Cash Return
1.9%
Cap rate
0.2%
Rent to Value Ratio
Active
$849,000
4
bds
|
4
ba
|
5,484
sqft
|
built
2002
16483 Valhalla Dr, Noblesville, IN 46060
$-1,305
Cash flow
-8.0%
Cash-on-Cash Return
4.3%
Cap rate
0.5%
Rent to Value Ratio
Active
$169,000
2
bds
|
1
ba
|
840
sqft
|
built
1950
1675 Cherry St, Noblesville, IN 46060
$100
Cash flow
3.1%
Cash-on-Cash Return
6.9%
Cap rate
0.8%
Rent to Value Ratio
Active
$290,500
3
bds
|
2
ba
|
1,704
sqft
|
built
2005
7848 Vics Ct, Noblesville, IN 46062
$-132
Cash flow
-2.4%
Cash-on-Cash Return
5.6%
Cap rate
0.7%
Rent to Value Ratio
Active
$600,000
4
bds
|
3
ba
|
3,286
sqft
|
built
2016
16250 Red Clover Ln, Noblesville, IN 46062
$-865
Cash flow
-7.5%
Cash-on-Cash Return
4.4%
Cap rate
0.5%
Rent to Value Ratio
Active
$199,900
2
bds
|
1
ba
|
1,265
sqft
|
built
1930
245 Riverwood Dr, Noblesville, IN 46062
$-58
Cash flow
-1.5%
Cash-on-Cash Return
5.8%
Cap rate
0.7%
Rent to Value Ratio
Active
$310,000
3
bds
|
3
ba
|
1,762
sqft
|
built
2000
15343 Follow Dr, Noblesville, IN 46060
$-164
Cash flow
-2.8%
Cash-on-Cash Return
5.5%
Cap rate
0.7%
Rent to Value Ratio
Active
$690,000
4
bds
|
5
ba
|
5,086
sqft
|
built
1996
9990 Sugarleaf Pl, Fishers, IN 46038
$-1,371
Cash flow
-10.4%
Cash-on-Cash Return
3.8%
Cap rate
0.5%
Rent to Value Ratio
Active
$395,000
4
bds
|
3
ba
|
2,332
sqft
|
built
1989
7587 Winding Way, Fishers, IN 46038
$-328
Cash flow
-4.3%
Cash-on-Cash Return
5.1%
Cap rate
0.6%
Rent to Value Ratio
Active
$354,900
3
bds
|
2
ba
|
1,886
sqft
|
built
1995
8988 Max Ct, Fishers, IN 46037
$-332
Cash flow
-4.9%
Cash-on-Cash Return
5.0%
Cap rate
0.6%
Rent to Value Ratio
Active
$549,900
4
bds
|
3
ba
|
3,912
sqft
|
built
2017
10274 Cloverbank Dr, Fishers, IN 46040
$-477
Cash flow
-4.5%
Cash-on-Cash Return
5.1%
Cap rate
0.6%
Rent to Value Ratio
Active
$88,900
3
bds
|
1
ba
|
948
sqft
|
built
1925
3111 S Pershing Dr, Muncie, IN 47302
$442
Cash flow
25.9%
Cash-on-Cash Return
12.1%
Cap rate
1.5%
Rent to Value Ratio