Calhoun County Investment Properties for Sale
Browse homes for sale and investment properties in Calhoun County. Refine your search by price, property type, or more.
Best cash flowing properties in Calhoun County
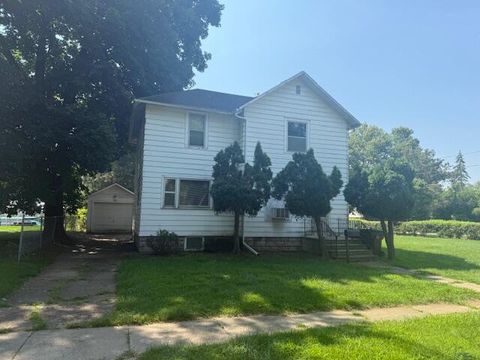
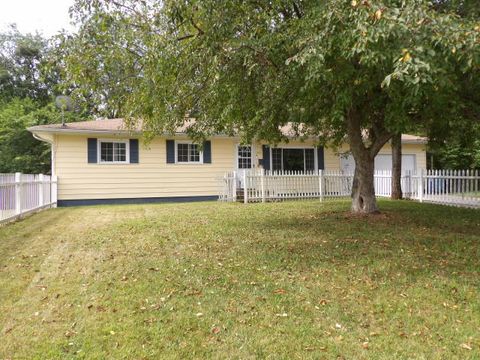
Active
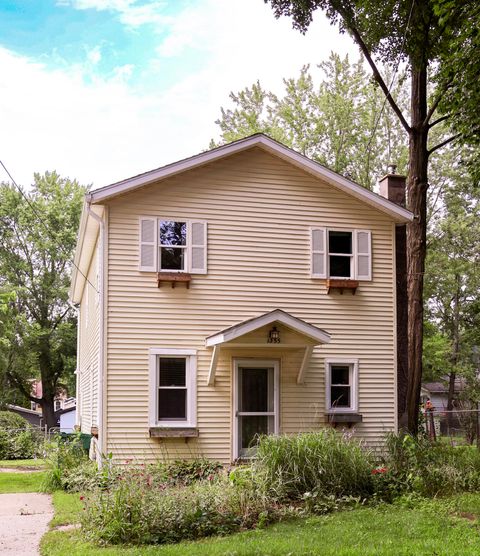
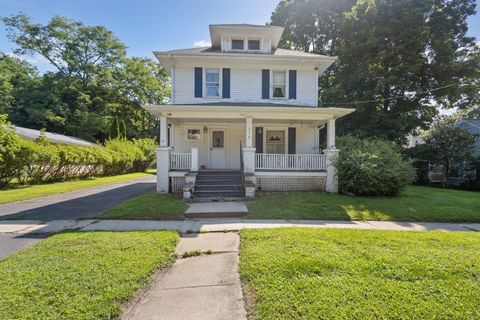
$79,900
3
bds
|
1
ba
|
1,424
sqft
|
built
1918
517 Mechanic St, Albion, MI 49224
$473
Cash flow
30.9%
Cash-on-Cash Return
13.2%
Cap rate
1.8%
Rent to Value Ratio

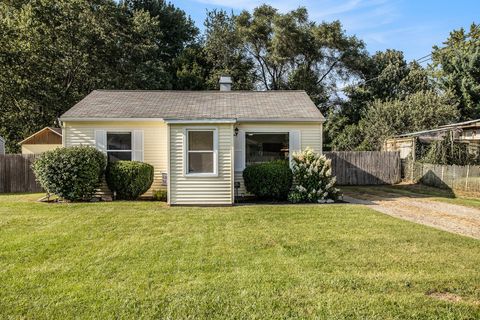
Active
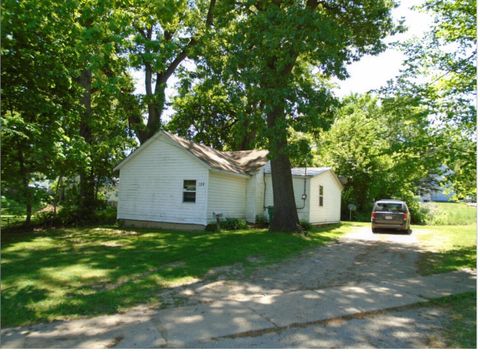
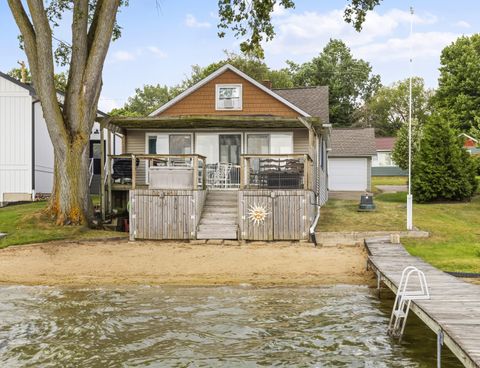
$85,000
4
bds
|
1
ba
|
0
sqft
|
built
1920
57 Euclid St, Battle Creek, MI 49014
$413
Cash flow
25.4%
Cash-on-Cash Return
12.0%
Cap rate
1.5%
Rent to Value Ratio
129 out of 158 properties for sale in Calhoun County
Limited Results Shown
Create a free account, or log in to reveal all property listings and enjoy the complete experience.
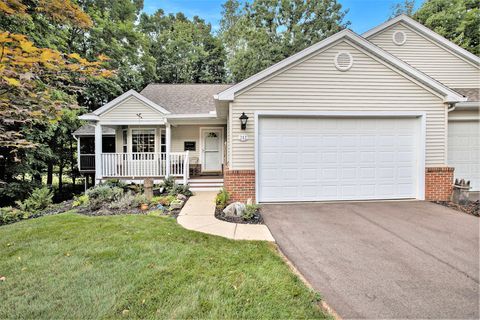
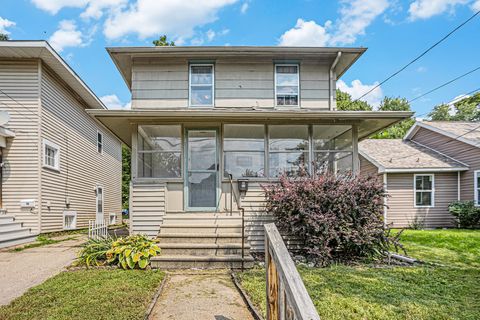
Active
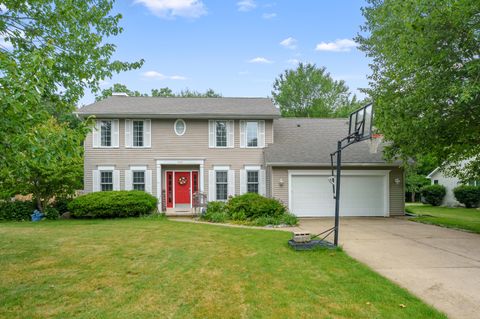
$450,000
3
bds
|
4
ba
|
2,946
sqft
|
built
1996
212 Chauncey Ct, Marshall, MI 49068
$-1,202
Cash flow
-13.9%
Cash-on-Cash Return
2.9%
Cap rate
0.5%
Rent to Value Ratio
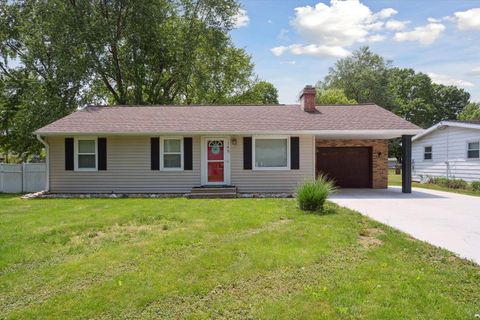
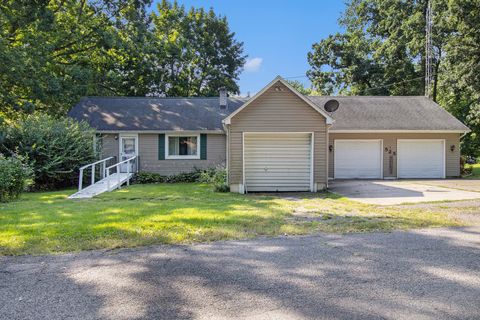
Active
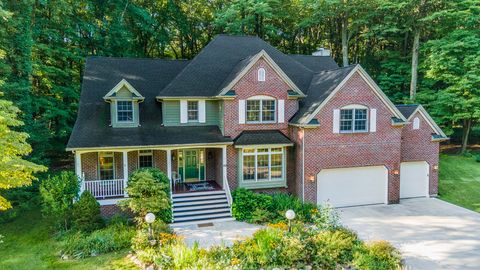
$270,000
4
bds
|
2
ba
|
2,171
sqft
|
built
1960
146 Maplehurst Blvd, Battle Creek, MI 49017
$-413
Cash flow
-8.0%
Cash-on-Cash Return
4.3%
Cap rate
0.7%
Rent to Value Ratio

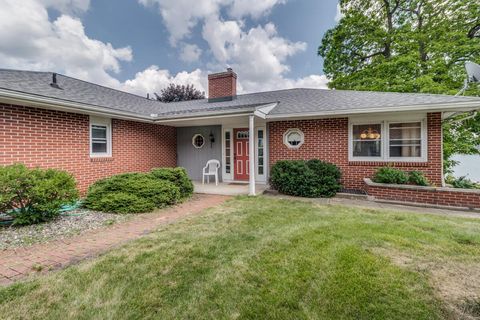
Active
$405,900
12
bds
|
4
ba
|
6,017
sqft
|
built
1920
25 Orchard Pl, Battle Creek, MI 49017
$-462
Cash flow
-5.9%
Cash-on-Cash Return
4.8%
Cap rate
0.7%
Rent to Value Ratio
Active
$495,000
3
bds
|
5
ba
|
4,378
sqft
|
built
1960
2851 Kistler Rd, Battle Creek, MI 49014
$-1,342
Cash flow
-14.1%
Cash-on-Cash Return
2.9%
Cap rate
0.5%
Rent to Value Ratio
Active
$325,000
5
bds
|
3
ba
|
2,173
sqft
|
built
1960
6329 Purdy Dr, Battle Creek, MI 49017
$-643
Cash flow
-10.3%
Cash-on-Cash Return
3.8%
Cap rate
0.6%
Rent to Value Ratio
Active
$439,900
4
bds
|
4
ba
|
3,164
sqft
|
built
2004
8270 Robins Ln, Battle Creek, MI 49014
$-771
Cash flow
-9.1%
Cash-on-Cash Return
4.0%
Cap rate
0.6%
Rent to Value Ratio
Active
$585,000
4
bds
|
3
ba
|
2,800
sqft
|
built
2010
7320 H Dr S, Ceresco, MI 49033
$-1,944
Cash flow
-17.3%
Cash-on-Cash Return
2.2%
Cap rate
0.4%
Rent to Value Ratio

Active
$174,900
2
bds
|
1
ba
|
780
sqft
|
built
1933
119 Greenfield Blvd, Marshall, MI 49068
$-240
Cash flow
-7.2%
Cash-on-Cash Return
4.5%
Cap rate
0.8%
Rent to Value Ratio
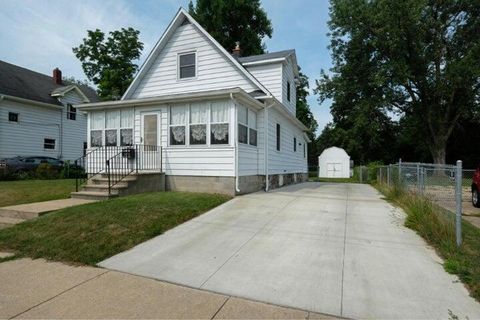
Active
$142,500
4
bds
|
1
ba
|
1,544
sqft
|
built
1900
325 E Leroy St, Burlington, MI 49029
$116
Cash flow
4.2%
Cash-on-Cash Return
7.1%
Cap rate
0.9%
Rent to Value Ratio
Active
$309,000
4
bds
|
2
ba
|
1,880
sqft
|
built
1910
213 W Prospect St, Marshall, MI 49068
$-674
Cash flow
-11.4%
Cash-on-Cash Return
3.5%
Cap rate
0.6%
Rent to Value Ratio

Active
$199,900
3
bds
|
3
ba
|
1,904
sqft
|
built
1900
22121 Bedford Rd N, Battle Creek, MI 49017
$86
Cash flow
2.2%
Cash-on-Cash Return
6.7%
Cap rate
0.9%
Rent to Value Ratio
Active
$350,000
bds
|
1
ba
|
650
sqft
|
built
2006
3280 3 1/2 Mile Rd, Athens, MI 49011
$-992
Cash flow
-14.8%
Cash-on-Cash Return
2.7%
Cap rate
0.4%
Rent to Value Ratio
Active
$79,900
2
bds
|
1
ba
|
640
sqft
|
built
1952
214 N Fountain St, Marshall, MI 49068
$121
Cash flow
7.9%
Cash-on-Cash Return
8.0%
Cap rate
1.3%
Rent to Value Ratio
Active
$174,900
3
bds
|
1
ba
|
1,544
sqft
|
built
1890
803 N Church St, Tekonsha, MI 49092
$-3
Cash flow
-0.1%
Cash-on-Cash Return
6.1%
Cap rate
0.8%
Rent to Value Ratio

Active
$89,500
2
bds
|
1
ba
|
1,090
sqft
|
built
1900
305 E Adams St, Homer, MI 49245
$250
Cash flow
14.6%
Cash-on-Cash Return
9.5%
Cap rate
1.5%
Rent to Value Ratio

Active
$289,900
3
bds
|
2
ba
|
2,656
sqft
|
built
1968
13175 6 1/2 Mile Rd, Battle Creek, MI 49014
$-454
Cash flow
-8.2%
Cash-on-Cash Return
4.3%
Cap rate
0.6%
Rent to Value Ratio
Active
$165,000
3
bds
|
1
ba
|
1,308
sqft
|
built
1917
3898 K Dr S, East Leroy, MI 49051
$-303
Cash flow
-9.6%
Cash-on-Cash Return
3.9%
Cap rate
1.0%
Rent to Value Ratio
Active
$750,000
5
bds
|
5
ba
|
4,691
sqft
|
built
2003
13028 Harper Xing, Battle Creek, MI 49014
$-2,190
Cash flow
-15.2%
Cash-on-Cash Return
2.6%
Cap rate
0.5%
Rent to Value Ratio
Active
$115,000
2
bds
|
1
ba
|
840
sqft
|
built
1910
813 Prospect St, Albion, MI 49224
$219
Cash flow
9.9%
Cash-on-Cash Return
8.4%
Cap rate
1.2%
Rent to Value Ratio
Active
$287,500
6
bds
|
0
ba
|
0
sqft
|
built
1950
74 Union St S, Battle Creek, MI 49017
$-495
Cash flow
-9.0%
Cash-on-Cash Return
4.1%
Cap rate
0.6%
Rent to Value Ratio
Active
$245,000
3
bds
|
2
ba
|
1,480
sqft
|
built
1933
1355 Middle Ln, Battle Creek, MI 49014
$-284
Cash flow
-6.0%
Cash-on-Cash Return
4.8%
Cap rate
0.7%
Rent to Value Ratio
Active
$350,000
4
bds
|
3
ba
|
2,458
sqft
|
built
1994
220 Deer Path Ln, Battle Creek, MI 49015
$-659
Cash flow
-9.8%
Cash-on-Cash Return
3.9%
Cap rate
0.7%
Rent to Value Ratio
Active
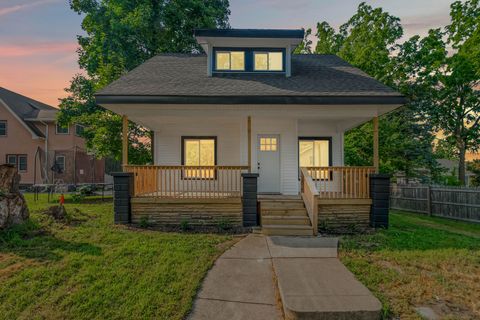
$78,000
3
bds
|
1
ba
|
1,036
sqft
|
built
1920
159 Spring St, Battle Creek, MI 49037
$320
Cash flow
21.4%
Cash-on-Cash Return
11.1%
Cap rate
1.5%
Rent to Value Ratio
Active
$483,900
5
bds
|
4
ba
|
5,792
sqft
|
built
1996
119 Kingsbury Ct, Battle Creek, MI 49015
$-1,018
Cash flow
-11.0%
Cash-on-Cash Return
3.6%
Cap rate
0.7%
Rent to Value Ratio
Active
$168,900
3
bds
|
1
ba
|
1,856
sqft
|
built
1955
53 Lamora Ave, Battle Creek, MI 49037
$-89
Cash flow
-2.7%
Cash-on-Cash Return
5.5%
Cap rate
0.8%
Rent to Value Ratio
Active
$150,000
3
bds
|
2
ba
|
1,576
sqft
|
built
1880
317 W Hanover St, Marshall, MI 49068
$-135
Cash flow
-4.7%
Cash-on-Cash Return
5.1%
Cap rate
1.0%
Rent to Value Ratio

Active
$119,900
3
bds
|
2
ba
|
1,101
sqft
|
built
1907
179 Bryant St, Battle Creek, MI 49017
$160
Cash flow
7.0%
Cash-on-Cash Return
7.7%
Cap rate
1.1%
Rent to Value Ratio
Active
$299,000
2
bds
|
2
ba
|
1,571
sqft
|
built
1989
1 Hiawatha Cove Trl, Battle Creek, MI 49015
$-1,112
Cash flow
-19.4%
Cash-on-Cash Return
1.7%
Cap rate
0.7%
Rent to Value Ratio
Active
$324,900
3
bds
|
2
ba
|
1,600
sqft
|
built
1930
8671 Gorsline Rd, Battle Creek, MI 49014
$-1,110
Cash flow
-17.8%
Cash-on-Cash Return
2.0%
Cap rate
0.4%
Rent to Value Ratio
Active
$159,900
4
bds
|
1
ba
|
1,428
sqft
|
built
1928
314 N Linden St, Marshall, MI 49068
$62
Cash flow
2.0%
Cash-on-Cash Return
6.6%
Cap rate
1.0%
Rent to Value Ratio
Active
$345,000
3
bds
|
2
ba
|
1,792
sqft
|
built
1930
641 Clark Rd, Ceresco, MI 49033
$-803
Cash flow
-12.1%
Cash-on-Cash Return
3.4%
Cap rate
0.6%
Rent to Value Ratio
Active
$199,000
4
bds
|
1
ba
|
1,259
sqft
|
built
1900
16 Eagle St, Battle Creek, MI 49037
$-286
Cash flow
-7.5%
Cash-on-Cash Return
4.4%
Cap rate
0.7%
Rent to Value Ratio
Active
$129,900
4
bds
|
1
ba
|
1,044
sqft
|
built
1916
264 Riverside Dr, Battle Creek, MI 49015
$27
Cash flow
1.1%
Cash-on-Cash Return
6.4%
Cap rate
0.9%
Rent to Value Ratio
Active
$174,900
5
bds
|
2
ba
|
960
sqft
|
built
1967
341 Algonquin St, Battle Creek, MI 49037
$-150
Cash flow
-4.5%
Cash-on-Cash Return
5.1%
Cap rate
0.8%
Rent to Value Ratio
Active
$159,999
2
bds
|
1
ba
|
720
sqft
|
built
1952
134 Creekview Dr, Battle Creek, MI 49037
$-55
Cash flow
-1.8%
Cash-on-Cash Return
5.7%
Cap rate
0.8%
Rent to Value Ratio
Active
$118,000
3
bds
|
1
ba
|
1,144
sqft
|
built
1925
21 Bryant St, Battle Creek, MI 49017
$118
Cash flow
5.2%
Cash-on-Cash Return
7.3%
Cap rate
1.1%
Rent to Value Ratio
Active
$185,000
2
bds
|
1
ba
|
1,538
sqft
|
built
1951
525 Newtown Ave, Battle Creek, MI 49015
$-173
Cash flow
-4.9%
Cash-on-Cash Return
5.0%
Cap rate
0.8%
Rent to Value Ratio
Active
$140,000
2
bds
|
1
ba
|
672
sqft
|
built
1949
36 Ferndale Ct, Battle Creek, MI 49015
$100
Cash flow
3.7%
Cash-on-Cash Return
7.0%
Cap rate
0.9%
Rent to Value Ratio