Ocean Springs, MS Investment Properties for Sale
Browse homes for sale and investment properties in Ocean Springs, MS. Refine your search by price, property type, or more.
Best cash flowing properties in Ocean Springs, MS
Active
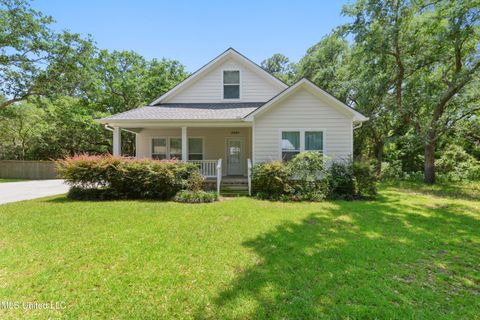
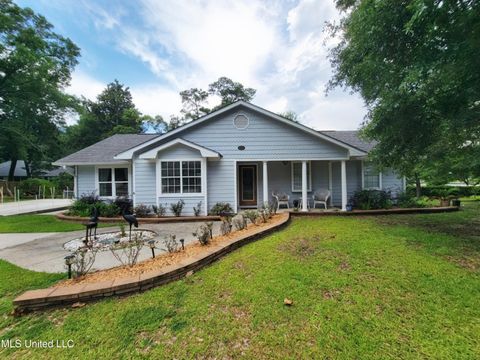
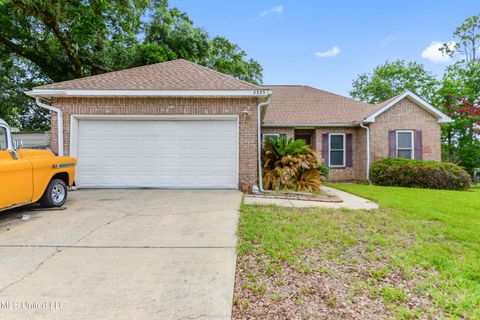
$257,500
3
bds
|
2
ba
|
0
sqft
|
built
2020
8809 Neptune Ave, Ocean Springs, MS 39564
$506
Cash flow
10.3%
Cash-on-Cash Return
8.0%
Cap rate
1.0%
Rent to Value Ratio
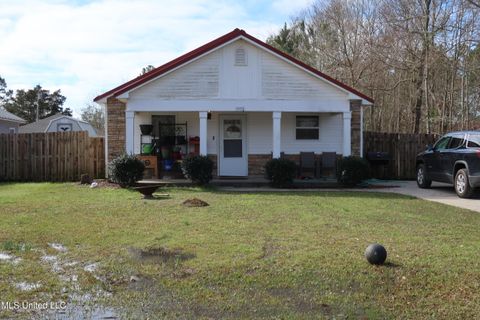
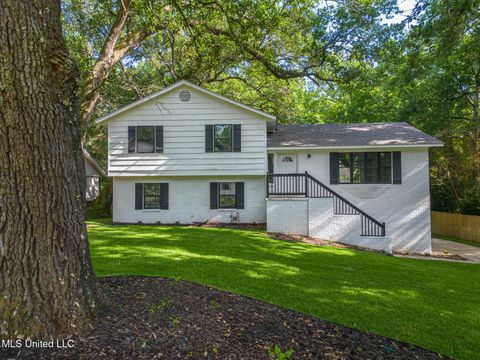
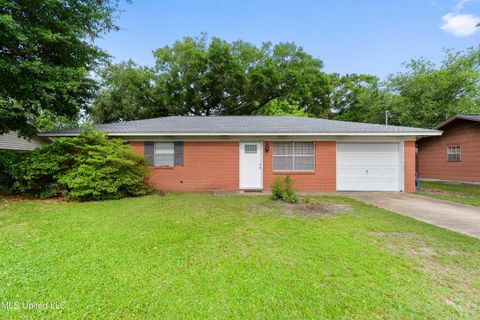
Active
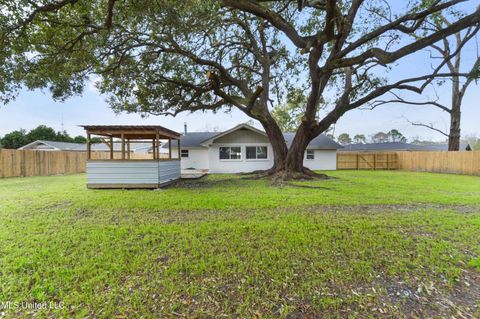
$275,000
3
bds
|
2
ba
|
0
sqft
|
built
1968
402 Hunter Dr, Ocean Springs, MS 39564
$334
Cash flow
6.3%
Cash-on-Cash Return
7.1%
Cap rate
0.9%
Rent to Value Ratio
194 out of 209 properties for sale in Ocean Springs, MS
Limited Results Shown
Create a free account, or log in to reveal all property listings and enjoy the complete experience.

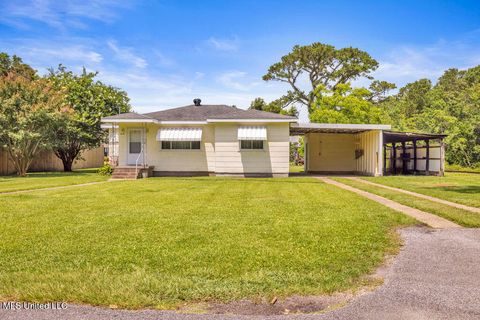
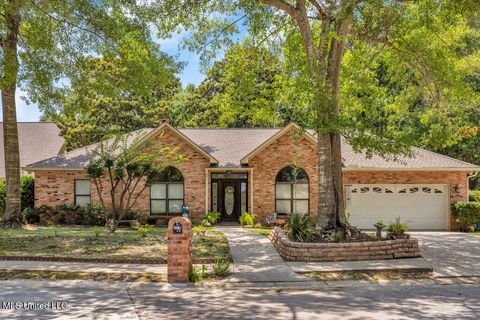
Active
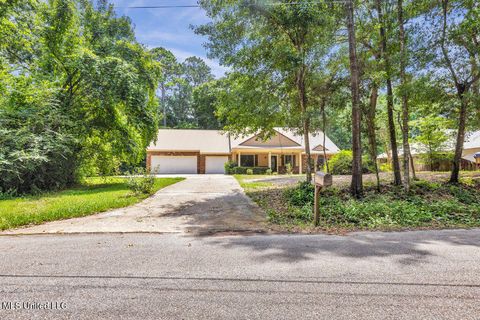
$319,900
3
bds
|
2
ba
|
0
sqft
|
built
1969
272 Holcomb Blvd, Ocean Springs, MS 39564
$-237
Cash flow
-3.9%
Cash-on-Cash Return
4.8%
Cap rate
0.6%
Rent to Value Ratio

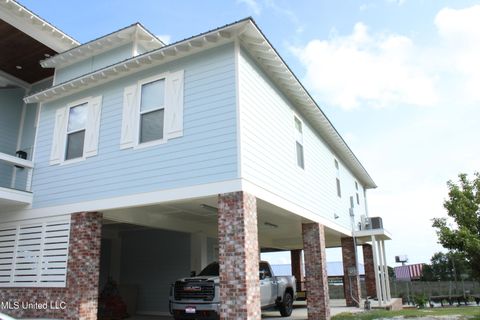
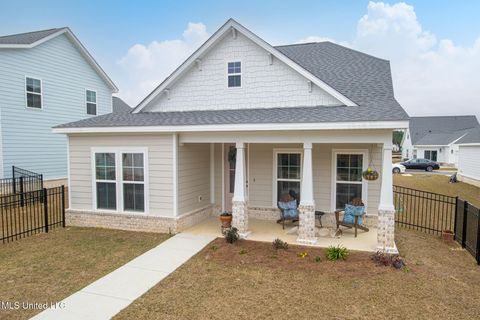
Active
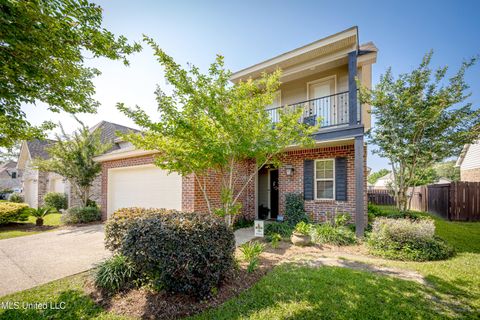
$620,000
12
bds
|
8
ba
|
0
sqft
|
built
2007
9620 Nevada Ave, Ocean Springs, MS 39565
$-2,134
Cash flow
-18.0%
Cash-on-Cash Return
1.5%
Cap rate
0.3%
Rent to Value Ratio
Active
$305,500
4
bds
|
3
ba
|
0
sqft
|
built
1999
3516 N 5th St, Ocean Springs, MS 39564
$-65
Cash flow
-1.1%
Cash-on-Cash Return
5.4%
Cap rate
0.7%
Rent to Value Ratio
Active
$379,000
3
bds
|
3
ba
|
0
sqft
|
built
2009
3927 Acadian Village Dr, Ocean Springs, MS 39564
$-329
Cash flow
-4.5%
Cash-on-Cash Return
4.6%
Cap rate
0.7%
Rent to Value Ratio
Active
$990,000
18
bds
|
12
ba
|
0
sqft
|
built
2010
15001 Dillon St, Ocean Springs, MS 39565
$-4,462
Cash flow
-23.5%
Cash-on-Cash Return
0.3%
Cap rate
0.1%
Rent to Value Ratio
Active
$1,195,000
4
bds
|
3
ba
|
0
sqft
|
built
2021
13152 Hanover Dr, Ocean Springs, MS 39564
$-3,687
Cash flow
-16.1%
Cash-on-Cash Return
2.0%
Cap rate
0.3%
Rent to Value Ratio
Active
$300,000
2
bds
|
1
ba
|
0
sqft
|
built
1950
615 First Ave, Ocean Springs, MS 39564
$-407
Cash flow
-7.1%
Cash-on-Cash Return
4.1%
Cap rate
0.5%
Rent to Value Ratio
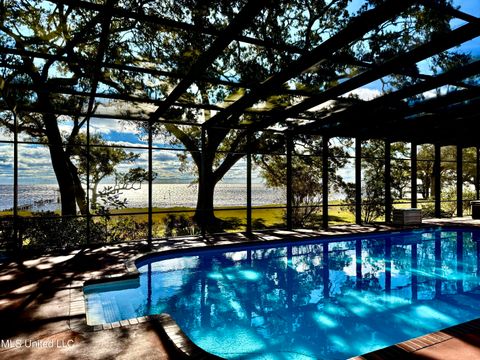
Active
$2,395,000
8
bds
|
7
ba
|
0
sqft
|
built
2009
12001 Point Aux Chenes Rd, Ocean Springs, MS 39564
$-10,607
Cash flow
-23.1%
Cash-on-Cash Return
0.4%
Cap rate
0.2%
Rent to Value Ratio
Active
$298,900
3
bds
|
3
ba
|
0
sqft
|
built
1990
9321 Coconut Dr, Ocean Springs, MS 39564
$174
Cash flow
3.0%
Cash-on-Cash Return
6.4%
Cap rate
0.8%
Rent to Value Ratio
Active
$439,900
4
bds
|
3
ba
|
0
sqft
|
built
1978
2550 Davidson Rd, Ocean Springs, MS 39564
$-817
Cash flow
-9.7%
Cash-on-Cash Return
3.5%
Cap rate
0.4%
Rent to Value Ratio

Active
$219,000
3
bds
|
2
ba
|
0
sqft
|
built
1987
9708 Aztec Dr, Ocean Springs, MS 39564
$17
Cash flow
0.4%
Cash-on-Cash Return
5.8%
Cap rate
0.8%
Rent to Value Ratio

Active
$310,000
3
bds
|
2
ba
|
0
sqft
|
built
2021
1709 S 1st St, Ocean Springs, MS 39564
$-19
Cash flow
-0.3%
Cash-on-Cash Return
5.6%
Cap rate
0.8%
Rent to Value Ratio

Active
$239,900
3
bds
|
2
ba
|
0
sqft
|
built
2002
1517 Porpoise Dr, Ocean Springs, MS 39564
$58
Cash flow
1.3%
Cash-on-Cash Return
6.0%
Cap rate
0.8%
Rent to Value Ratio

Active
$1,080,000
3
bds
|
2
ba
|
0
sqft
|
built
1945
1309 Bowen Ave, Ocean Springs, MS 39564
$-3,781
Cash flow
-18.3%
Cash-on-Cash Return
1.5%
Cap rate
0.2%
Rent to Value Ratio
Active
$435,900
3
bds
|
2
ba
|
0
sqft
|
built
1996
807 Woodglen Dr, Ocean Springs, MS 39564
$-504
Cash flow
-6.0%
Cash-on-Cash Return
4.3%
Cap rate
0.6%
Rent to Value Ratio
Active
$345,900
3
bds
|
3
ba
|
0
sqft
|
built
2023
104 Beverly Dr, Ocean Springs, MS 39564
$-383
Cash flow
-5.8%
Cash-on-Cash Return
4.4%
Cap rate
0.7%
Rent to Value Ratio
Active
$855,000
3
bds
|
2
ba
|
0
sqft
|
built
1940
319 Washington Ave, Ocean Springs, MS 39564
$-1,796
Cash flow
-11.0%
Cash-on-Cash Return
3.2%
Cap rate
0.4%
Rent to Value Ratio

Active
$1,100,000
4
bds
|
4
ba
|
0
sqft
|
built
2021
140 Seaside Dr, Ocean Springs, MS 39564
$-3,663
Cash flow
-17.4%
Cash-on-Cash Return
1.7%
Cap rate
0.3%
Rent to Value Ratio

Active
$212,000
3
bds
|
2
ba
|
0
sqft
|
built
1994
9404 Meadowlark Ave, Ocean Springs, MS 39564
$42
Cash flow
1.0%
Cash-on-Cash Return
5.9%
Cap rate
0.8%
Rent to Value Ratio

Active
$209,500
3
bds
|
2
ba
|
0
sqft
|
built
1986
4110 Groveland Rd, Ocean Springs, MS 39564
$-23
Cash flow
-0.6%
Cash-on-Cash Return
5.5%
Cap rate
0.8%
Rent to Value Ratio
Active
$234,000
3
bds
|
3
ba
|
0
sqft
|
built
2021
2205 Magazine St, Ocean Springs, MS 39564
$30
Cash flow
0.7%
Cash-on-Cash Return
5.8%
Cap rate
0.9%
Rent to Value Ratio

Active
$299,900
3
bds
|
2
ba
|
0
sqft
|
built
1998
6507 Shoshonee Dr, Ocean Springs, MS 39564
$-175
Cash flow
-3.0%
Cash-on-Cash Return
5.0%
Cap rate
0.7%
Rent to Value Ratio

Active
$329,900
3
bds
|
2
ba
|
0
sqft
|
built
2009
6811 Old Fort Bayou Rd, Ocean Springs, MS 39564
$-96
Cash flow
-1.5%
Cash-on-Cash Return
5.3%
Cap rate
0.7%
Rent to Value Ratio

Active
$729,000
4
bds
|
3
ba
|
0
sqft
|
built
1999
127 Surgeres Pl, Ocean Springs, MS 39564
$-1,845
Cash flow
-13.2%
Cash-on-Cash Return
2.6%
Cap rate
0.4%
Rent to Value Ratio
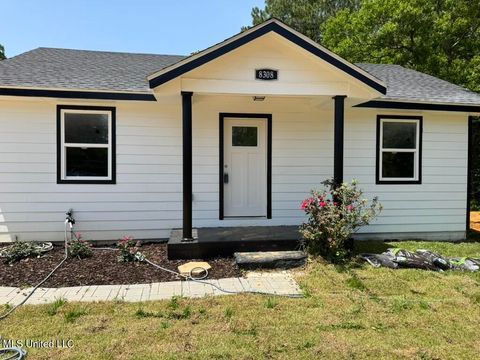
Active
$196,000
3
bds
|
1
ba
|
0
sqft
|
built
1940
8308 Holiday Dr, Ocean Springs, MS 39564
$-31
Cash flow
-0.8%
Cash-on-Cash Return
5.5%
Cap rate
0.7%
Rent to Value Ratio
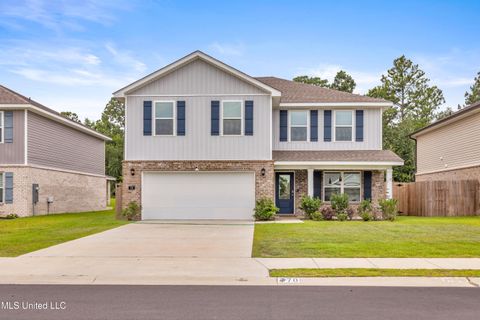
Active
$330,000
4
bds
|
3
ba
|
0
sqft
|
built
2023
70 Saltmeadow Cir, Ocean Springs, MS 39564
$-35
Cash flow
-0.6%
Cash-on-Cash Return
5.6%
Cap rate
0.8%
Rent to Value Ratio
Active
$215,000
3
bds
|
2
ba
|
0
sqft
|
built
2001
2325 Rue Beaux Chenes, Ocean Springs, MS 39564
$321
Cash flow
7.8%
Cash-on-Cash Return
7.5%
Cap rate
0.9%
Rent to Value Ratio

Active
$1,285,000
3
bds
|
4
ba
|
0
sqft
|
built
2012
10805 Eagle Nest Rd, Ocean Springs, MS 39564
$-4,690
Cash flow
-19.0%
Cash-on-Cash Return
1.3%
Cap rate
0.2%
Rent to Value Ratio

Active
$414,000
4
bds
|
3
ba
|
0
sqft
|
built
2005
1817 Shelby Ln, Ocean Springs, MS 39564
$-457
Cash flow
-5.8%
Cash-on-Cash Return
4.4%
Cap rate
0.6%
Rent to Value Ratio

Active
$243,800
3
bds
|
2
ba
|
0
sqft
|
built
1982
1334 Diller Rd, Ocean Springs, MS 39564
$154
Cash flow
3.3%
Cash-on-Cash Return
6.4%
Cap rate
0.8%
Rent to Value Ratio

Active
$439,900
2
bds
|
1
ba
|
0
sqft
|
built
1960
609 Russell Ave, Ocean Springs, MS 39564
$-1,185
Cash flow
-14.1%
Cash-on-Cash Return
2.4%
Cap rate
0.4%
Rent to Value Ratio

Active
$238,000
3
bds
|
2
ba
|
0
sqft
|
built
2001
7505 Martin Ct, Ocean Springs, MS 39564
$154
Cash flow
3.4%
Cash-on-Cash Return
6.5%
Cap rate
0.8%
Rent to Value Ratio

Active
$579,000
6
bds
|
3
ba
|
0
sqft
|
built
2018
5807 Sylvester St, Ocean Springs, MS 39564
$-927
Cash flow
-8.4%
Cash-on-Cash Return
3.8%
Cap rate
0.6%
Rent to Value Ratio

Active
$269,450
3
bds
|
2
ba
|
0
sqft
|
built
1973
2909 Pimlico Dr, Ocean Springs, MS 39564
$-108
Cash flow
-2.1%
Cash-on-Cash Return
5.2%
Cap rate
0.7%
Rent to Value Ratio

Active
$139,000
1
bds
|
2
ba
|
0
sqft
|
built
1972
3230 Cumberland Rd, Ocean Springs, MS 39564
$-284
Cash flow
-10.7%
Cash-on-Cash Return
3.2%
Cap rate
1.0%
Rent to Value Ratio

Active
$245,000
3
bds
|
2
ba
|
0
sqft
|
built
1997
8809 Old Walnut Rd, Ocean Springs, MS 39564
$137
Cash flow
2.9%
Cash-on-Cash Return
6.3%
Cap rate
0.8%
Rent to Value Ratio

Active
$299,000
3
bds
|
2
ba
|
0
sqft
|
built
1991
108 Water Oaks Cv, Ocean Springs, MS 39564
$-96
Cash flow
-1.7%
Cash-on-Cash Return
5.3%
Cap rate
0.7%
Rent to Value Ratio
Active
$235,000
3
bds
|
2
ba
|
0
sqft
|
built
1968
512 Seymour Ave, Ocean Springs, MS 39564
$-12
Cash flow
-0.3%
Cash-on-Cash Return
5.6%
Cap rate
0.7%
Rent to Value Ratio