Ocean Springs, MS Investment Properties for Sale
Browse homes for sale and investment properties in Ocean Springs, MS. Refine your search by price, property type, or more.
Best cash flowing properties in Ocean Springs, MS

Active
$150,000
2
bds
|
2
ba
|
0
sqft
|
built
1972
3230 Cumberland Rd, Ocean Springs, MS 39564
$701
Cash flow
24.4%
Cash-on-Cash Return
11.3%
Cap rate
1.5%
Rent to Value Ratio
Active
$189,900
3
bds
|
2
ba
|
0
sqft
|
built
2002
11601 Quail Creek Dr, Ocean Springs, MS 39564
$335
Cash flow
9.2%
Cash-on-Cash Return
7.8%
Cap rate
1.0%
Rent to Value Ratio
194 out of 209 properties for sale in Ocean Springs, MS
Limited Results Shown
Create a free account, or log in to reveal all property listings and enjoy the complete experience.

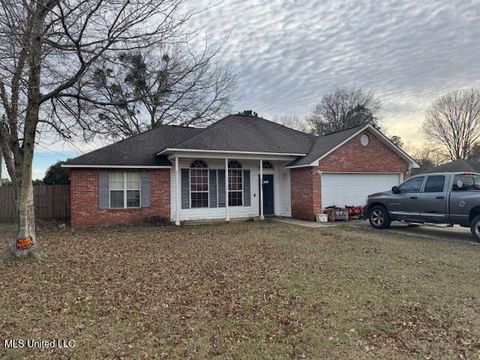
Active
$132,000
2
bds
|
2
ba
|
0
sqft
|
built
1972
3230 Cumberland Rd, Ocean Springs, MS 39564
$-291
Cash flow
-11.5%
Cash-on-Cash Return
3.0%
Cap rate
1.1%
Rent to Value Ratio

Active
$210,000
3
bds
|
3
ba
|
0
sqft
|
built
2000
2231 Rue Beaux Chenes, Ocean Springs, MS 39564
$239
Cash flow
5.9%
Cash-on-Cash Return
7.0%
Cap rate
1.0%
Rent to Value Ratio

Active
$474,400
4
bds
|
2
ba
|
0
sqft
|
built
1965
606 Clark Ave, Ocean Springs, MS 39564
$-925
Cash flow
-10.2%
Cash-on-Cash Return
3.3%
Cap rate
0.5%
Rent to Value Ratio

Active
$425,000
4
bds
|
4
ba
|
0
sqft
|
built
2010
10304 Mayhaw Cv, Ocean Springs, MS 39565
$-206
Cash flow
-2.5%
Cash-on-Cash Return
5.1%
Cap rate
0.7%
Rent to Value Ratio
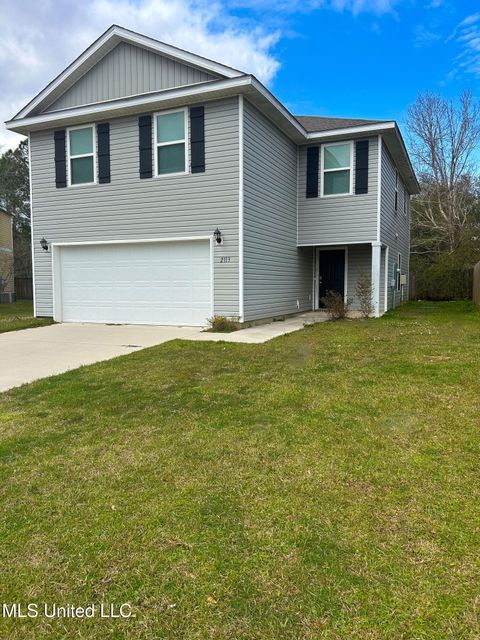
Active
$249,000
4
bds
|
3
ba
|
0
sqft
|
built
2021
2113 Toulouse St, Ocean Springs, MS 39564
$-148
Cash flow
-3.1%
Cash-on-Cash Return
5.0%
Cap rate
0.8%
Rent to Value Ratio

Active
$259,999
5
bds
|
3
ba
|
0
sqft
|
built
2007
2829 Villa Venezia Ct, Ocean Springs, MS 39564
$189
Cash flow
3.8%
Cash-on-Cash Return
6.5%
Cap rate
0.9%
Rent to Value Ratio

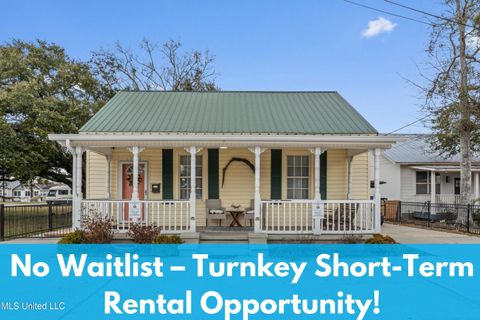
Active
$274,900
1
bds
|
2
ba
|
0
sqft
|
built
2008
922 Porter Ave, Ocean Springs, MS 39564
$-924
Cash flow
-17.5%
Cash-on-Cash Return
1.6%
Cap rate
0.6%
Rent to Value Ratio

Active
$224,000
2
bds
|
3
ba
|
0
sqft
|
built
2009
210 Armand Oaks, Ocean Springs, MS 39564
$-411
Cash flow
-9.6%
Cash-on-Cash Return
3.5%
Cap rate
0.8%
Rent to Value Ratio

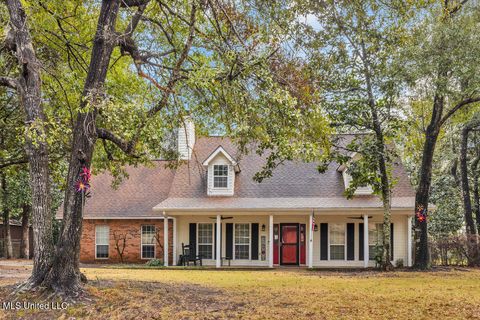
Active
$325,000
4
bds
|
3
ba
|
0
sqft
|
built
2005
2501 Shelby Ln, Ocean Springs, MS 39564
$-301
Cash flow
-4.8%
Cash-on-Cash Return
4.6%
Cap rate
0.6%
Rent to Value Ratio

Active
$385,000
4
bds
|
3
ba
|
0
sqft
|
built
2004
2617 Shelby Ln, Ocean Springs, MS 39564
$-260
Cash flow
-3.5%
Cash-on-Cash Return
4.9%
Cap rate
0.6%
Rent to Value Ratio
Active
$850,000
3
bds
|
2
ba
|
0
sqft
|
built
1910
1705 Government St, Ocean Springs, MS 39564
$-2,217
Cash flow
-13.6%
Cash-on-Cash Return
2.5%
Cap rate
0.3%
Rent to Value Ratio
Active
$355,000
5
bds
|
3
ba
|
0
sqft
|
built
1997
3300 N 1st St, Ocean Springs, MS 39564
$-153
Cash flow
-2.2%
Cash-on-Cash Return
5.2%
Cap rate
0.7%
Rent to Value Ratio

Active
$274,900
3
bds
|
2
ba
|
0
sqft
|
built
2006
2508 Rue Beaux Chenes, Ocean Springs, MS 39564
$212
Cash flow
4.0%
Cash-on-Cash Return
6.6%
Cap rate
0.8%
Rent to Value Ratio
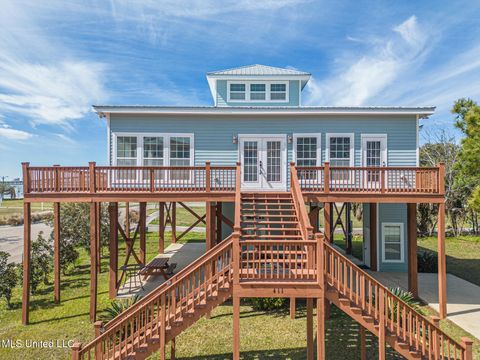
Active
$699,999
3
bds
|
2
ba
|
0
sqft
|
built
2009
411 Martin Ave, Ocean Springs, MS 39564
$-2,661
Cash flow
-19.8%
Cash-on-Cash Return
1.1%
Cap rate
0.1%
Rent to Value Ratio

Active
$870,000
5
bds
|
3
ba
|
0
sqft
|
built
1953
501 Forest Hill Dr, Ocean Springs, MS 39564
$-1,543
Cash flow
-9.3%
Cash-on-Cash Return
3.6%
Cap rate
0.5%
Rent to Value Ratio

Active
$279,900
4
bds
|
3
ba
|
0
sqft
|
built
2003
2209 Rue Beaux Chenes, Ocean Springs, MS 39564
$309
Cash flow
5.8%
Cash-on-Cash Return
7.0%
Cap rate
0.9%
Rent to Value Ratio
Active
$299,500
4
bds
|
2
ba
|
0
sqft
|
built
2022
7364 Shearwater Way, Ocean Springs, MS 39564
$37
Cash flow
0.6%
Cash-on-Cash Return
5.8%
Cap rate
0.8%
Rent to Value Ratio

Active
$299,900
4
bds
|
3
ba
|
0
sqft
|
built
2000
3801 Tangerine St, Ocean Springs, MS 39564
$49
Cash flow
0.9%
Cash-on-Cash Return
5.9%
Cap rate
0.8%
Rent to Value Ratio

Active
$399,000
3
bds
|
2
ba
|
0
sqft
|
built
1920
1112 Robinson St, Ocean Springs, MS 39564
$-353
Cash flow
-4.6%
Cash-on-Cash Return
4.6%
Cap rate
0.6%
Rent to Value Ratio

Active
$264,000
4
bds
|
2
ba
|
0
sqft
|
built
2007
10356 Shady Pine Dr, Ocean Springs, MS 39565
$62
Cash flow
1.2%
Cash-on-Cash Return
6.0%
Cap rate
0.8%
Rent to Value Ratio

Active
$262,900
4
bds
|
3
ba
|
0
sqft
|
built
2002
4656 Kelly Ct, Ocean Springs, MS 39564
$52
Cash flow
1.0%
Cash-on-Cash Return
5.9%
Cap rate
0.9%
Rent to Value Ratio

Active
$750,000
4
bds
|
2
ba
|
0
sqft
|
built
1970
1419 Porter Ave, Ocean Springs, MS 39564
$-1,626
Cash flow
-11.3%
Cash-on-Cash Return
3.1%
Cap rate
0.5%
Rent to Value Ratio

Active
$549,900
2
bds
|
3
ba
|
0
sqft
|
built
1996
5710 Caldwell Dr, Ocean Springs, MS 39564
$-963
Cash flow
-9.1%
Cash-on-Cash Return
3.6%
Cap rate
0.5%
Rent to Value Ratio

Active
$331,500
5
bds
|
3
ba
|
0
sqft
|
built
2022
68 Saltmeadow Cir, Ocean Springs, MS 39564
$169
Cash flow
2.7%
Cash-on-Cash Return
6.3%
Cap rate
0.8%
Rent to Value Ratio
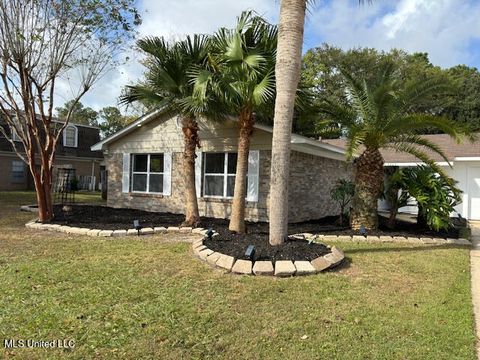
Active
$299,999
3
bds
|
2
ba
|
0
sqft
|
built
1970
3221 Nottingham Rd, Ocean Springs, MS 39564
$261
Cash flow
4.5%
Cash-on-Cash Return
6.7%
Cap rate
0.8%
Rent to Value Ratio

Active
$245,000
2
bds
|
2
ba
|
0
sqft
|
built
2006
2421 Beachview Dr, Ocean Springs, MS 39564
$-411
Cash flow
-8.8%
Cash-on-Cash Return
3.7%
Cap rate
0.8%
Rent to Value Ratio
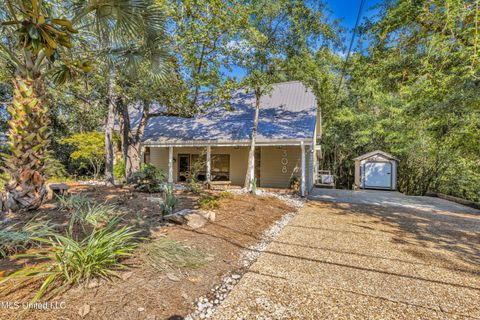
Active
$775,000
3
bds
|
4
ba
|
0
sqft
|
built
1978
308 Lovers Ln, Ocean Springs, MS 39564
$-1,682
Cash flow
-11.3%
Cash-on-Cash Return
3.1%
Cap rate
0.5%
Rent to Value Ratio
Active
$2,800,000
4
bds
|
6
ba
|
0
sqft
|
built
2001
104 Spanish Point Rd, Ocean Springs, MS 39564
$-9,938
Cash flow
-18.5%
Cash-on-Cash Return
1.4%
Cap rate
0.2%
Rent to Value Ratio
Active
$219,500
2
bds
|
2
ba
|
0
sqft
|
built
1990
2421 Beachview Dr, Ocean Springs, MS 39564
$140
Cash flow
3.3%
Cash-on-Cash Return
6.4%
Cap rate
0.8%
Rent to Value Ratio
Active
$599,000
4
bds
|
5
ba
|
0
sqft
|
built
2003
6105 Mary Mahoney Dr, Ocean Springs, MS 39564
$-660
Cash flow
-5.7%
Cash-on-Cash Return
4.4%
Cap rate
0.6%
Rent to Value Ratio
Active
$281,000
4
bds
|
2
ba
|
0
sqft
|
built
2022
3500 N 9th St, Ocean Springs, MS 39564
$-10
Cash flow
-0.2%
Cash-on-Cash Return
5.6%
Cap rate
0.8%
Rent to Value Ratio

Active
$330,000
4
bds
|
2
ba
|
0
sqft
|
built
2009
9612 Nevada Ave, Ocean Springs, MS 39565
$-593
Cash flow
-9.4%
Cash-on-Cash Return
3.5%
Cap rate
0.5%
Rent to Value Ratio