Excel Functions Standing upon Bones

Few would argue that Excel is a popular application when it comes to investment analyses. Real Estate investors use Excel because of its rich complement of financial calculations. How many times have you used, seen or heard of Excel’s investment features, functions and calculations as part of a property’s sales presentation and/or loan portfolio? Without question, Excel is an efficient application for real estate investors. The reason Excel is so valuable, is its treatment of money over time. Real estate investing requires the evaluation of investment dollars as time advances into the future. Without this evaluation, most investors would not consider it investing but rather speculating. If you prefer to guess or take a chance on your money, then Excel would not be of any value. However, for investors that need to make financial assumptions or do case scenarios into the future, Excel can be a useful ally.
The Bones in Excel’s Investment Functions
In order to use the investment functions in Excel, you must understand the parts that make up these functions. Excel’s common investment functions require you to supply the necessary arguments to produce the resulting values. An example, is the loan payment derived from the PMT() function for an amortization schedule.
=PMT(RATE, NPER, PV, FV, TYPE)
The arguments in the PMT() function are;
- interest rate
- the total number of regular payments
- the present value
- future value
- type of loan.
The above arguments are what I like to call the “bones” of Excel’s functions. The key to fully understanding the functions is to understand its’ “bones. The basic bones include;
- Present Value
- Future Value
- Rate
- Payment
- Period
- Number of Payment Periods
- Type
Present Value (PV) In dealing with a loan, the present value is also called the principal. For investments, the present value is its value at the beginning of its investment life. Future Value (FV) Future Value is the value of a loan or investment some time into the future. If you are paying down a loan, the loan’s future value should be decreasing. For an investment, you want the future value to increase. Rate A percentage rate at which a loan or investment will decrease or increase over time. A loan will have an interest rate that is applied to the loan payments at a constant duration. Payment (PMT) The regular consistent amount of money used to pay down a loan. Or the amount of money used in acquiring an investment. Period (PER) The PER is the time frame to which a payment is made. A conventional loan will be paid in 12 periods each year, which we’ll call monthly payments. Number of Payment Periods (NPER) The NPER is the number of payments within the entire payment period. A 30 year loan with 12 payments per year will have a NPER of 360. Type In Excel’s functions, the type argument or “bone” has a default value of zero (0) to denote the payments that take place at the end of the period. The type “bone” can take a value of one (1) to denote that payments take place at the beginning of the period. In a loan, your monthly payments could be paid at the beginning of the month (1) or at the end of the month (0). With our previous understanding of the “bones”, it is time to look at the actual functions that real estate investors use in Excel.
Excel’s Investment Functions
Although Excel has numerous functions, the investment and amortization category of functions are what real estate investors use most. Functions are just shortcuts for formulas, in Excel the formulas are predefined. Excel’s built-in functions will do the “heavy lifting” for you. The mathematical formula for the Present Value (PV) is recreated below. [caption id="attachment_40637" align="aligncenter" width="242"]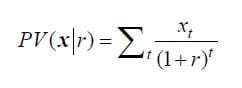
- Present Value PV(rate, nper, pmt, fv, type)
- Net Present Value NPV(rate, nper, pmt, fv, type)
- Future Value FV(rate, nper, pmt, pv, type)
- Internal Rate of Return IRR(cash flow values() [, guess])
- Modified Internal Rate of Return MIRR(cash flow values, finance_rate, reinvest_rate)
With the above functions, a real estate investor can begin to track, evaluate and test the profitability of investment properties. Understanding the “bones” of these functions gives the investor confidence in their derived values. Amortization Functions The amortization functions were covered in a previous post here at BiggerPockets. The functions covered were the PMT() for payments of a loan, IPMT() for the interest portion of a loan payment, and PPMT() which is the principal payment of a loan. Internal Rates of Return IRR() and MIRR() One of the most quoted investment function that investors encounter is the Internal Rate of Return. In real estate investing, the internal rate of return calculates how fast the property appreciates in value or its rate of return. Most often the IRR() function in Excel is used. At times you might see the MIRR() function as well. The second function is called the Modified Internal Rate of Return. The big question now becomes why two rates of return? The two rates of return are used for different financial scenarios. The IRR() function calculates the rate of return on positive cash flows. A real estate investor would be very fortunate to find an investment property with only positive cash flows. In the real world, there are positive and negative cash flows. The MIRR() is a better choice in the real world of fluctuating cash flows, both positive and negative. I will not go into detail regarding the differences between IRR() and MIRR(). There have been academic studies and reports covering the differences. To go into a detailed discussion of the topic would require a separate post that would mostly bore everyone. To cut through all the discussion and shed some light on the subject, there are two major differences between IRR() and MIRR() that investors should understand.
- The mandatory number of “bones” involved in the IRR() is one, a series of cash flow values. The mandatory number of “bones” for the MIRR() is three; a series of cash flow values, a rate in which the negative cash flow values are discounted to their present cash values and a rate in which the positive cash flows are added to the final value.
- The MIRR() accounts for both negative and positive cash flows. The IRR() does not account for negative cash flows.
The important thing to know when confronted with an internal rate of return is to know what arguments or “bones” were used in the calculation. To show the difference between the two rates of return, look at the spreadsheet example below. [caption id="attachment_40636" align="aligncenter" width="300"]