Free guide: short-term vs long-term rental on one house
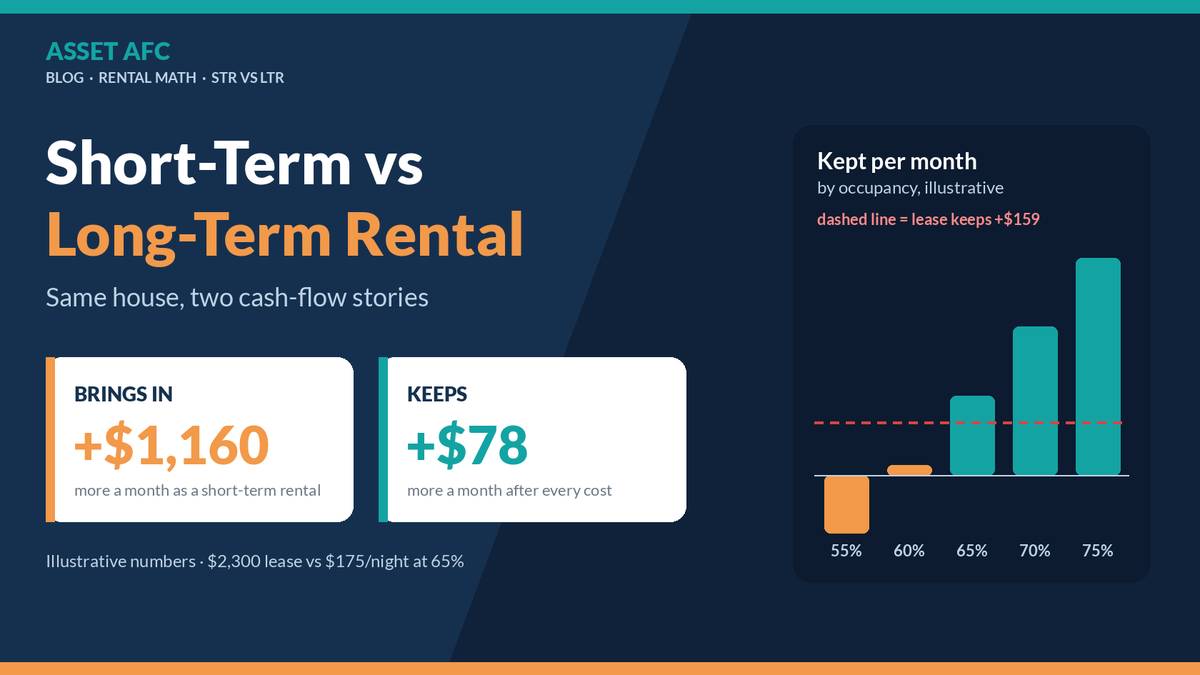
Posted by Asset AFC. We build spreadsheet and analysis tools for rental investors, and this post ends with a link to one of them. Everything below works with a pencil and a calculator; you don't need any tool for it.
Who this is for: anyone deciding between a short-term rental and a long-term rental on the same property, ideally before buying furniture.
THE HOUSE
Illustrative house (made-up numbers, not a real property, a market forecast or tax advice):
Price $250,000, $62,500 down, $187,500 loan at 7% over 30 years
Principal + interest: about $1,247/mo
Property tax: $220/mo either way
LONG-TERM VERSION
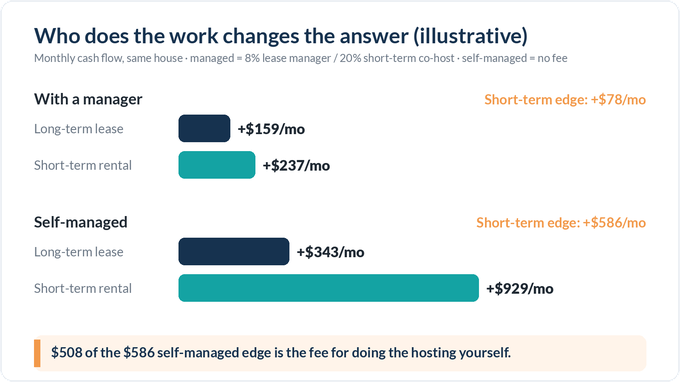
Lease $2,300/mo; insurance $110; vacancy 5% ($115), repairs 5% ($115), manager 8% ($184), CapEx reserve $150. All-in about $2,141. Keeps about $159/mo.
SHORT-TERM VERSION
$175/night at 65% occupancy: about 237 nights a year, about $3,460/mo in.
Co-host 20% ($692), platform fee assumed at 3% ($104), utilities/internet/streaming ($280), supplies ($100), short-term rental insurance ($180), repairs ($150), CapEx reserve ($150), furniture replacement ($100). Guest-paid cleaning fees assumed to cover the cleaner; lodging taxes collected from guests left out. All-in about $3,223. Keeps about $237/mo.
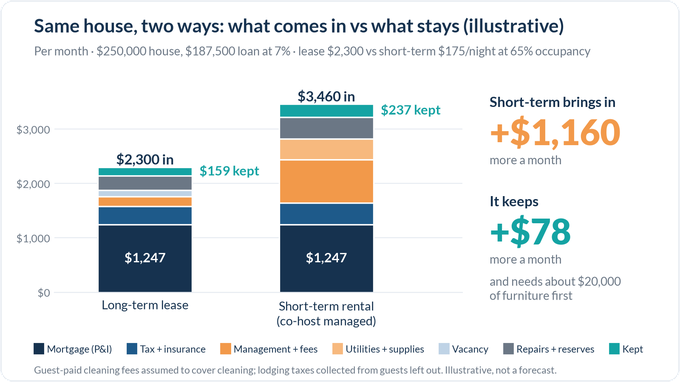
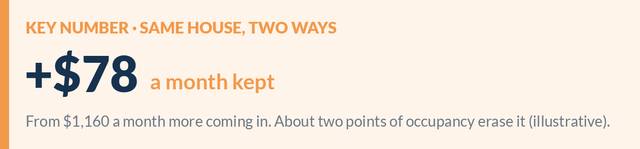
$1,160 more a month coming in; $78 more a month kept.
STRESS TEST 1: OCCUPANCY
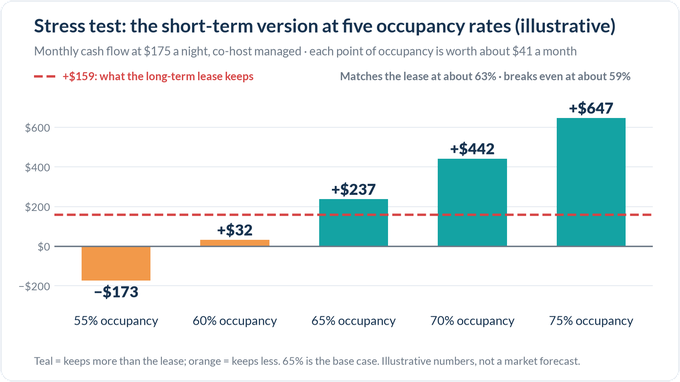
Each point of occupancy ≈ $41/mo here. 55%: about −$173/mo. 60%: +$32. 65%: +$237. 70%: +$442. 75%: +$647. Break-even against $0 ≈ 59%; matches the lease ≈ 63%. The base case has about two points of cushion.
STRESS TEST 2: NIGHTLY RATE
Rate down 10% to $157.50 at the same 65% occupancy: about −$30/mo.
STRESS TEST 3: WHO DOES THE WORK
Self-managed on both sides: lease ≈ +$343/mo, short-term ≈ +$929/mo, a $586 gap. $508 of it is the fee difference, which is pay for doing the hosting yourself.
THE FURNITURE
About $20,000 to furnish, so cash in goes from $62,500 to $82,500. At a $78/mo edge that's about 256 months (roughly 21 years) to earn it back; self-managed, about 34 months.
WHAT HAS TO BE TRUE
Local rules, HOA and mortgage terms allow it; year-round occupancy for similar places sits clearly above the break-even against the lease; the rate holds in slow months; you've priced who does the work; and you could live with the lease version as the fallback.
ONE STEP BEFORE YOU LIST IT
Break-even occupancy against the lease = (what the lease keeps + short-term fixed monthly costs) ÷ share of each dollar left after percentage fees ÷ a fully booked month. Here: ($159 + $2,427) ÷ 0.77 ÷ $5,323 ≈ 63%. Compare it with real local occupancy across a full year.
FROM ASSET AFC
For the long-term side in a spreadsheet: Cashflow Analyzer Pro – Deal Instant Analyzer from Asset AFC is an Excel workbook (one-time purchase), yours for life, with every formula visible so you can see where each number comes from. You enter the purchase price, rental income, expenses and financing terms; it calculates metrics including Cash on Cash ROI, CAP Rate and Rental Yield.
There's also a subscription version if you prefer.
Also on Etsy.
The full guide on the Asset AFC website has the same house with all the charts.
It's a tool for organizing your own assumptions, not a promise of returns. Do your own research for your market and goals, including local short-term rental rules.
