Vacancy & Maintenance Buffers: How +$300 Cash Flow Thins to +$80

HaveEducationWebsite
Classifieds

Vacancy & Maintenance Buffers: How +$300 Cash Flow Thins to +$80

Developer · Member since 2024 · 34 posts · 10 votes

The deal looked fine until vacancy and repairs got a real line.

Illustrative rental (not a real deal):

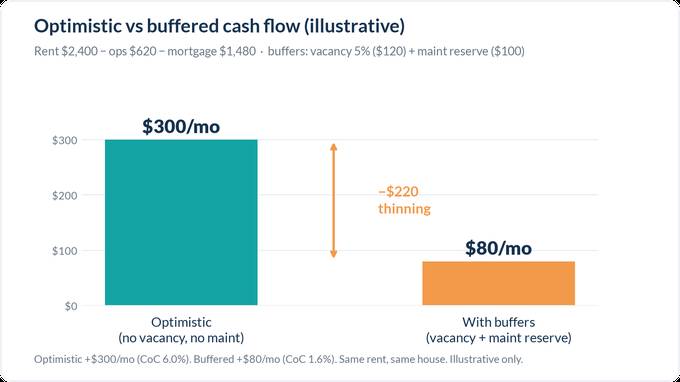
  • Rent $2,400 · ops $620 · mortgage P&I $1,480

  • Optimistic (no vacancy, no maint): +$300/mo · CoC 6.0% on $60k

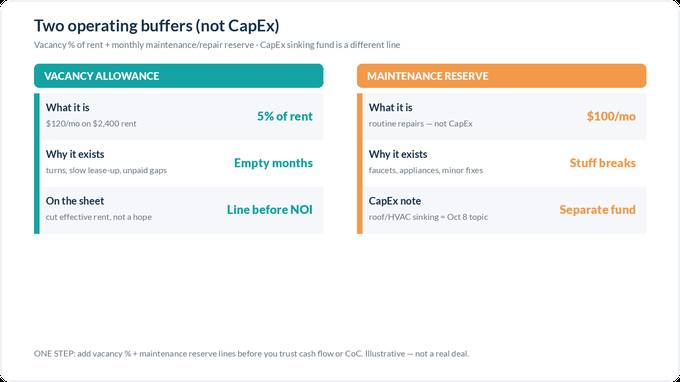
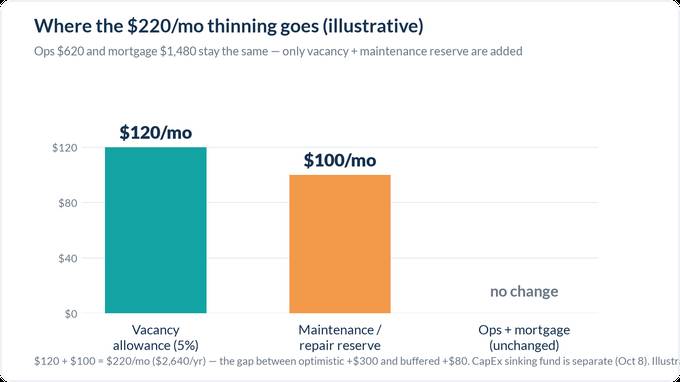
  • Vacancy 5% = $120 · maintenance reserve $100

  • With buffers: +$80/mo · CoC 1.6% · thinning $220/mo ($2,640/yr)

Vacancy rate = % of rent. Maintenance reserve = routine repairs. CapEx sinking fund is separate.

ONE STEP: add vacancy % + maintenance reserve lines before you trust cash flow or CoC.

Try Cashflow Analyzer Pro — rental analysis with vacancy and repair reserves among the outputs.

More from Asset AFC.

Illustrative numbers only; not investment advice.

0Reply
118 views

1 Reply

Jump to latestLatest
  • Drew SygitBusiness Member
    Property Manager · Royal Oak, MI · Member since 2012 · 12k+ posts · 9k+ votes
    2d

    Why would an investor buy anything w/o taking into account vacancy and maintenance?

    They should also add "Tenant nonPerformance" - especially if NOT a Class A rental.

    We recommend:

    Class A: 0-5%

    Class B: 5-10%

    Class C: 10-20%

    Class D: 20%+

    See FICO default rates below to support this:

    Check out this chart:

    FICO Score

    Pct of Population

    Default Probability

    800 or more

    13.00%

    1.00%

    750-799

    27.00%

    1.00%

    700-749

    18.00%

    4.40%

    650-699

    15.00%

    8.90%

    600-649

    12.00%

    15.80%

    550-599

    8.00%

    22.50%

    500-549

    5.00%

    28.40%

    Less than 499

    2.00%

    41.00%

Join the conversationCreate a free account to reply, vote on answers and follow this thread.