San Diego · Member since 2024 · 44 posts · 20 votes
1y
Hey @Gloria C. -- lots of factors to consider (including your personal strategy), but here are a few high level metrics to compare the most populous zip codes in Huntsville
Welcome to drop me a message if you are interested in checking out the full report
San Diego · Member since 2024 · 44 posts · 20 votes
1y
Hey @Gloria C. -- lots of factors to consider (including your personal strategy), but here are a few high level metrics to compare the most populous zip codes in Huntsville
Welcome to drop me a message if you are interested in checking out the full report
Huntsville, AL · Member since 2018 · 577 posts · 864 votes
1y
@Minh Nguyen - what do those percentages represent?
@Gloria C. - there is no absolute answer to your question. The data @Devin Conley posted is pretty solid from my experience (I do not know Devin nor how he sourced the data, just going by my own investing experience).
If you want better cash flow, 35805, 35810, 35816, and 35811 are likely the choices. But this comes with pockets of C/D neighborhoods, and higher potential for headaches; in addition, appreciation in these zips has probably maxed out for a while.
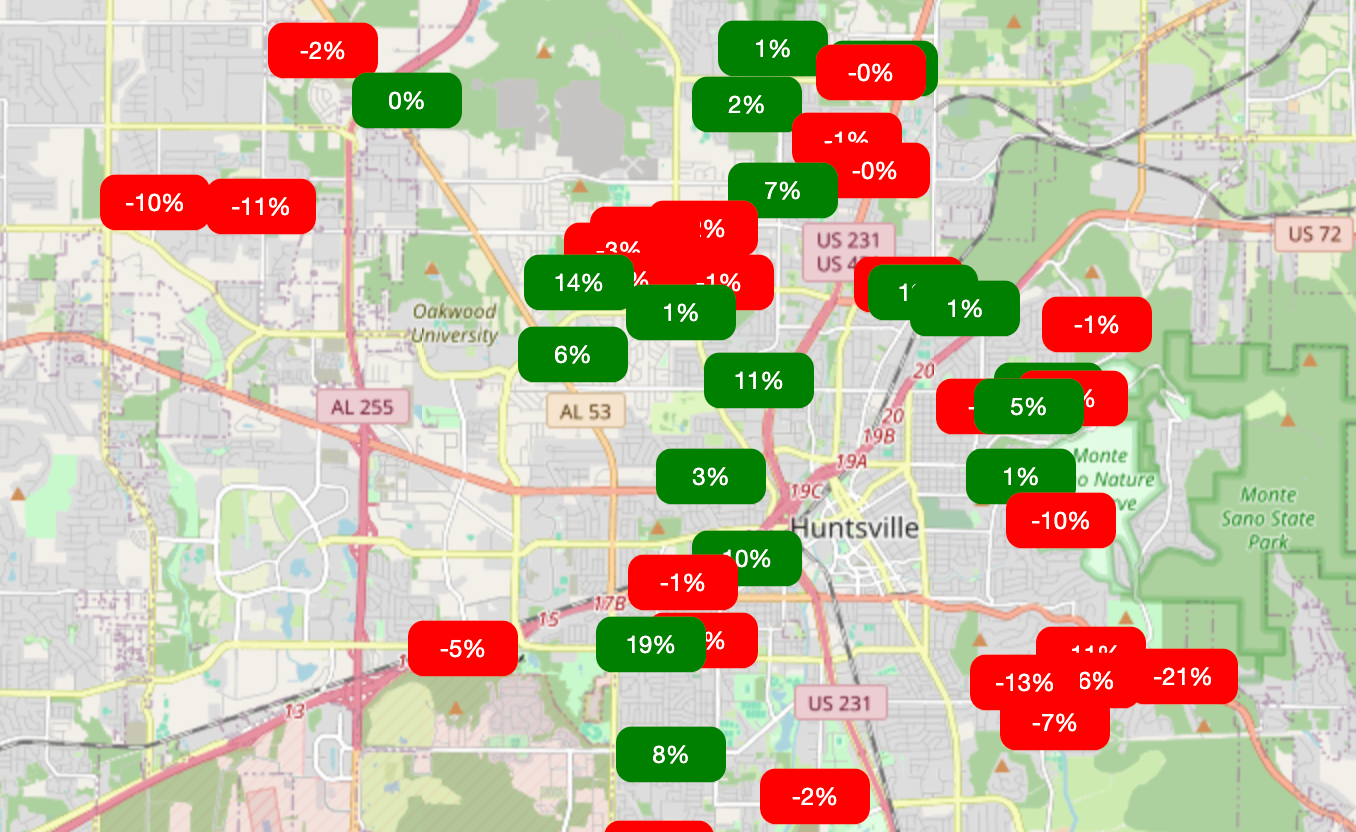
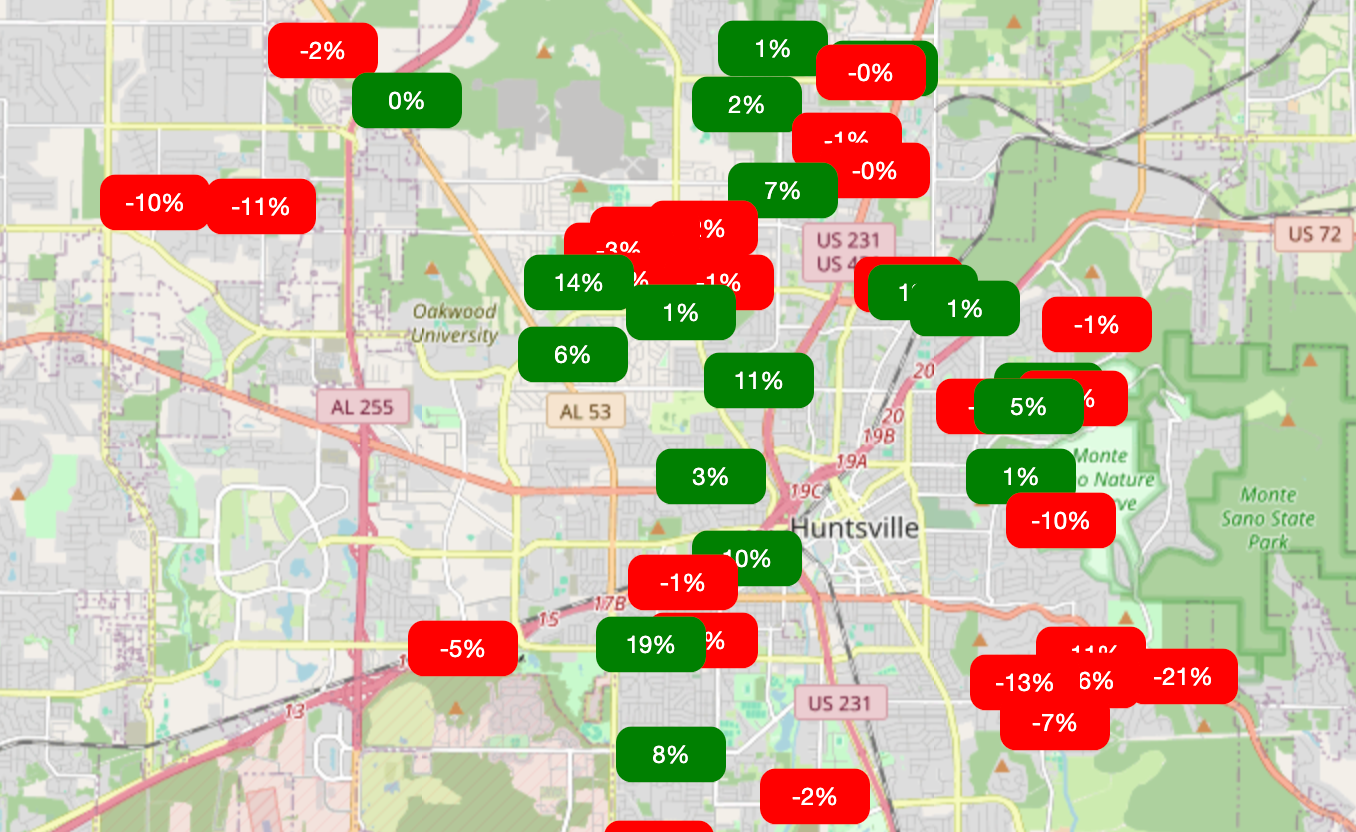
It's an estimated cash on cash return given current rental rates subtract expenses assuming 7% interest rate, 10% management fee, 5% repairs, 5% capex and other expenses like mortgage, insurance, tax.
it's a estimate to tell you what properties to analyze vs ignore
you can see the are pockets of negative returns as well as pockets of positive return.
this is to supplement the data @Devin Conley provided
@Minh Nguyen - what do those percentages represent?
@Gloria C. - there is no absolute answer to your question. The data @Devin Conley posted is pretty solid from my experience (I do not know Devin nor how he sourced the data, just going by my own investing experience).
If you want better cash flow, 35805, 35810, 35816, and 35811 are likely the choices. But this comes with pockets of C/D neighborhoods, and higher potential for headaches; in addition, appreciation in these zips has probably maxed out for a while.
It's an estimated cash on cash return given current rental rates subtract expenses assuming 7% interest rate, 10% management fee, 5% repairs, 5% capex and other expenses like mortgage, insurance, tax.
it's a estimate to tell you what properties to analyze vs ignore
you can see the are pockets of negative returns as well as pockets of positive return.
this is to supplement the data @Devin Conley provided
I like the cash on cash return visualization @Minh Nguyen ! Very useful view.
Curious, where are you pulling numbers for local mortgage, insurance, and tax rates?
Hey @Gloria C. -- lots of factors to consider (including your personal strategy), but here are a few high level metrics to compare the most populous zip codes in Huntsville
Welcome to drop me a message if you are interested in checking out the full report