Median income just jumped in every data tool. Here's why.
If you've pulled a ZIP code's median household income from any data tool this year and it came back 10 to 20 percent higher than the last time you looked, you weren't imagining it. Nearly every ZIP in the country moved at once. Nobody got a raise. What moved was the ruler.
I maintain a dataset that covers about 22,000 ZIP codes, and when the new census income numbers landed I compared every ZIP's old figure to its new one. The median change was +7.25%. The inflation adjustment between the two releases was +7.19%. Take inflation out and the median ZIP's real change is +0.06%. Roughly zero.
What the number actually is
Almost every tool's "median household income" comes from the same place: the Census Bureau's American Community Survey, specifically the five-year estimate, because it's the only version published at ZIP level. Two things about it explain the whole jump.
First, it's a rolling five-year window. The prior release covered 2018 through 2022. The current one, published January 29, 2026, covers 2020 through 2024. Tools have been rolling it in all year; mine applied it in July.
Second, and this is the part almost nobody knows: every dollar figure in a five-year file is inflation-adjusted to the dollars of the final year of the window. The old number was in 2022 dollars. The new one is in 2024 dollars. The consumer price index rose 7.19% between those two years (the Census Bureau's own deflator lands within a few tenths of that). So a ZIP whose real income didn't change at all shows up about 7% higher, purely because the base year of the dollars moved.
The national figure shows it cleanly: $75,149 in the old release, $80,734 in the new one, +7.4%. Take out inflation and it's +0.2%.
What the whole country looks like
Here's the change across the 21,780 ZIPs in my dataset that have an income figure in both releases.
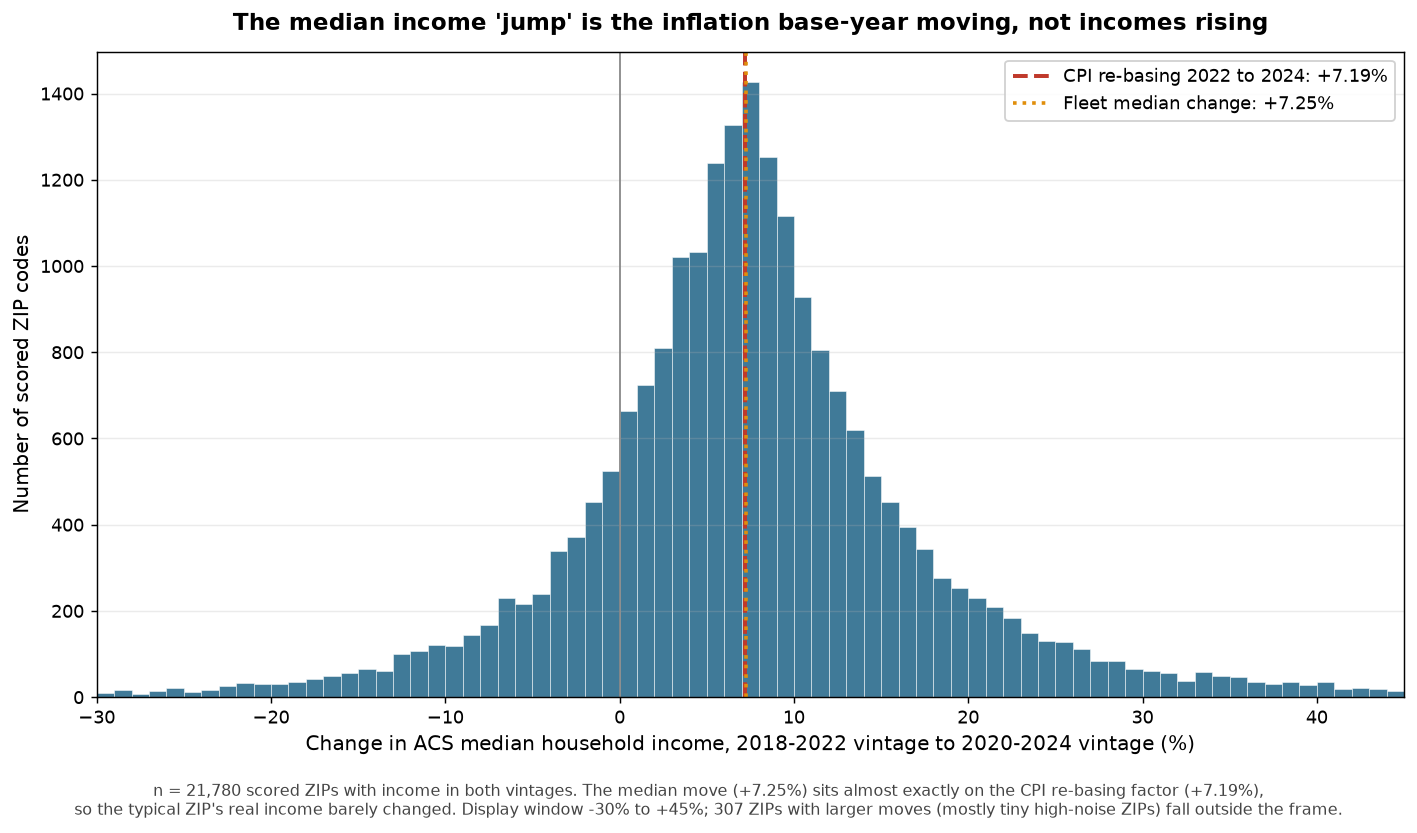
It's a bell centered almost exactly on the inflation factor. The dashed line is inflation at +7.19%; the dotted line is the median ZIP at +7.25%. They sit on top of each other. (The chart trims about 300 tiny, very noisy ZIPs beyond the frame.)
Some numbers off that distribution. A third of ZIPs (34%) show a jump above 10%. One in ten shows a jump above 20%. Meanwhile 17% of ZIPs went down in nominal dollars, even in a release where "everything jumped." Divide inflation out and the picture flips: half of all ZIPs (49.6%) lost real income across the two releases, and half gained. The headline number rose almost everywhere. Real income was a coin flip.
Where the jump is real
Above that 7% baseline, movement is real, but you have to decompose it. Manhattan's 10001 went from $106,509 to $129,852, +21.9%. About 7 points of that is the dollar base; the remaining +13.7% is real, and it's what a high-earner, high-turnover ZIP looks like when the window drops the pandemic years and adds two strong recent ones. East Nashville's 37206 went from $80,915 to $96,169, +18.9%, about +10.9% real, which is a gentrifying area doing what gentrifying areas do. Those are composition changes: different people living there.
Where it fell
Richmond, TX (77407), a Houston suburb of roughly 88,000 people, went from $106,131 to $98,913. That's -6.8% in nominal dollars, and because the ruler stretched 7% at the same time, roughly -13% in real terms. Big ZIP, tight margin of error, not noise. Half the country is in this camp once you correct for inflation; you just don't see it because the nominal number went up.
Where it's noise
ZIP-level income comes with a margin of error, and in small ZIPs it's enormous. Jamestown, SC (29453) appears to have doubled, from $33,793 to $71,328. Its published 90% margin of error is plus or minus $64,465, about plus or minus 90% of the estimate. The "doubling" is entirely inside the noise band. Even a dense urban ZIP like 10001 carries a margin of about plus or minus 19%. And in the smallest places the Census can't publish a number at all: 48 ZIPs in my dataset had an income figure last release and are suppressed in this one, Blackey, KY among them. A responsible tool shows N/A there instead of inventing something.
It wasn't just income
This is the part that explains why every tool moved the same week. Income is one of many fields that come from the same survey, and they all slid two years at once.
Rent is the big one. In my dataset, 57% of ZIPs get their rent figure from the census, because observed listing rents don't cover them; only 37% have observed rents, and the rest use HUD's numbers. Census rent is inflation-adjusted the same way income is, so those estimated rents moved +6.6% at the median in this release. Hold prices fixed and that alone nudged estimated gross yields up about a quarter of a percentage point in the ZIPs that rely on it. Vacancy rates ticked down about 0.7 points at the median. Population growth was flat at the median but noisy in the tails.
So "income jumped" is really "every census-fed number stepped forward two years in one release": income, rent, vacancy, population, and every ratio built on them, in every tool that reads the survey.
The honest part about my own numbers
The dataset I maintain scores ZIPs, and when this release landed the scores moved a little. Not from income, which is displayed but doesn't feed the scores, but through vacancy, population growth, and those census-estimated rents. A few hundred ZIPs out of 22,000 shifted category, mostly at the margins, which is about what a two-year data step should do. It's worth knowing that any tool feeding census inputs into a score did the same thing, whether or not it said so.
How to read it
Never compare an income figure from one release to one from the next and call the difference growth. Most of it is the dollar base moving. If a tool shows "income growth," ask whether it's comparing across releases; if so, subtract about 7% before you believe any of it. Remember the "2024" figure describes 2020 through 2024, centered on 2022, so it lags real conditions by a couple of years. Check the margin of error before you trust a small ZIP's number, and check whether your rent figure is observed or estimated, because the estimated ones just moved for the same reason. And the useful question for any ZIP is the inflation-adjusted one: after taking out the 7%, did income actually move? For half the country, the honest answer is no, or down.
Notes on the data
Income is ACS five-year median household income (table B19013), 2018-2022 versus 2020-2024, pulled for every ZIP from the public Census API. The inflation factor is the BLS CPI-U annual average, 2022 to 2024 (292.655 to 313.689). Margins of error are the Census-published 90% figures. Rent is table B25064, vacancy B25002, population B01003. All of it is free and public, and the whole comparison is an afternoon's work in a spreadsheet if you want to replicate it. Figures reflect the two ACS releases named; ZIP-level values refresh annually.
Name a ZIP in the replies and I'll tell you how much of its income jump was inflation and how much was real.