Case Study: 10-Unit Myrtle Beach STR Multifamily — 9% Cap, $92K/yr Modeled Cash Flow

Case Study: 10-Unit Myrtle Beach STR Multifamily — 9% Cap, $92K/yr Modeled Cash Flow

Brandon KunasekBusiness Member
Myrtle Beach, SC · Member since 2022 · 22 posts · 2 votes

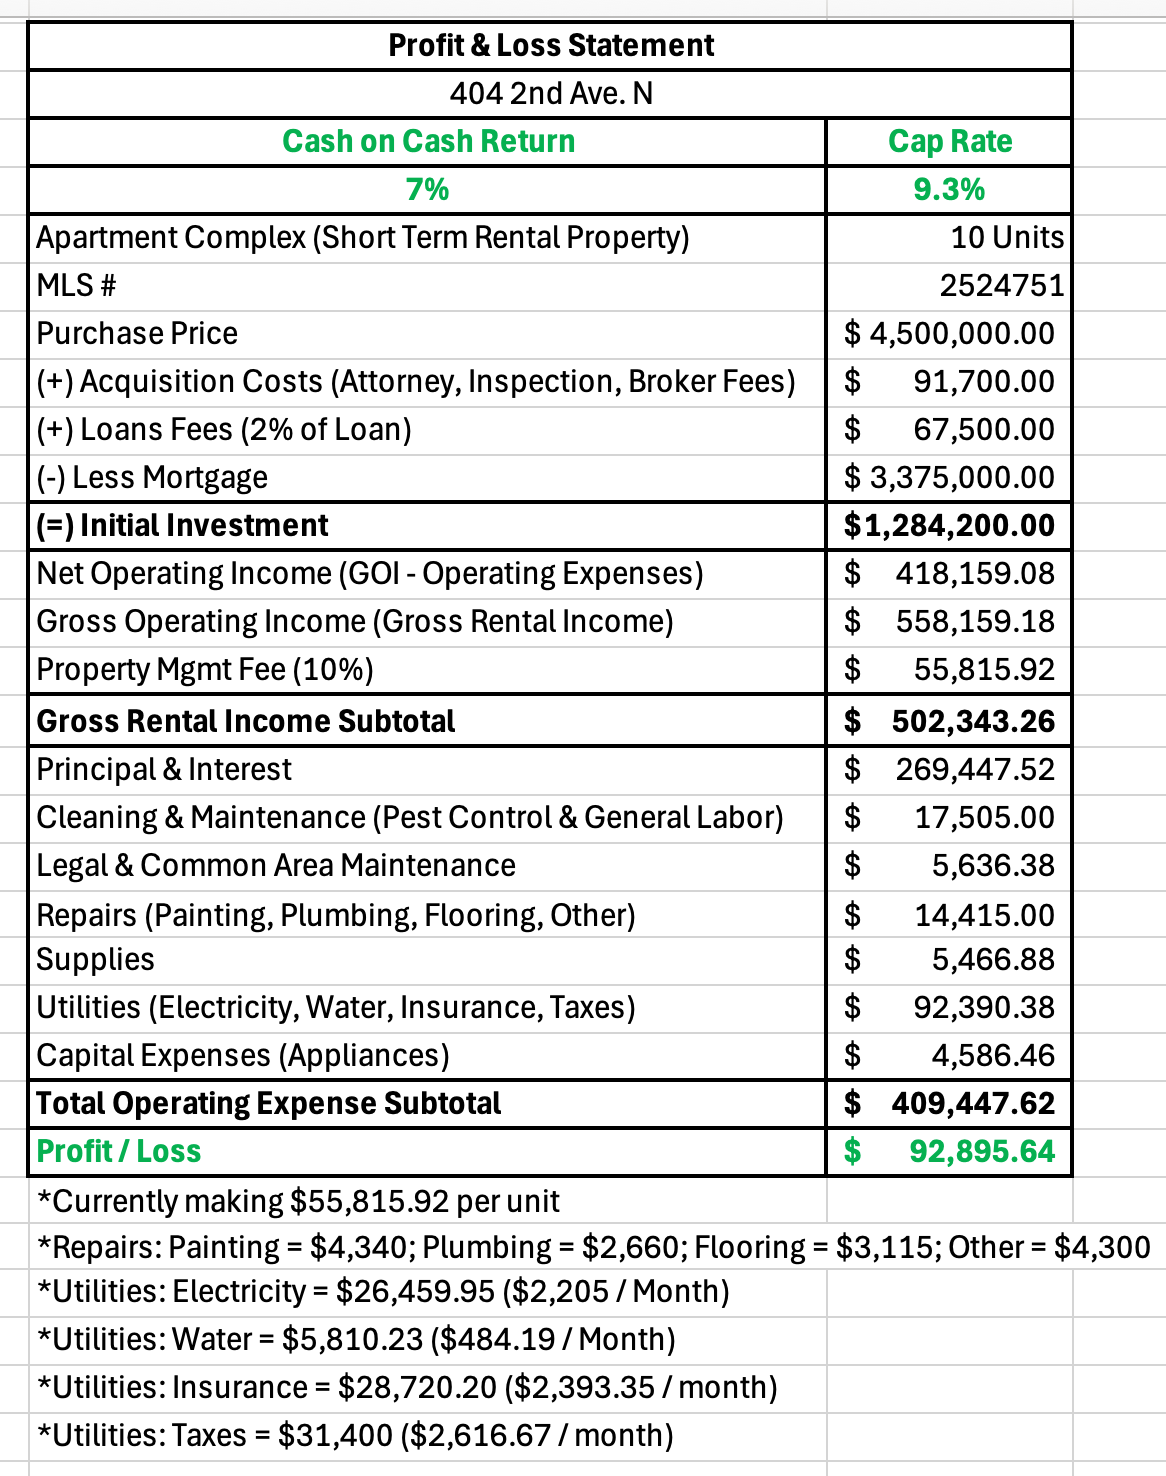
I just finished a CCIM-style breakdown of a 10-unit multifamily near Myrtle Beach that recently traded. In short: $558k gross, ~9% cap, modeled cash-flow of ~$92k/yr with professional management (or ~$140k if self-managed), and conservative 5-yr after-tax proceeds of ~$1.4M.

I’m sharing the math, assumptions, depreciation treatment, and the risks/opportunities I saw (value-add ideas, occupancy sensitivity, and market comps). If you’re curious about the model/assumptions or want a copy of the spreadsheet for educational use, please send me a direct message and I’ll share a read-only version after a quick intro.

This is intended as a learning post for investors evaluating STR vs long-term multifamily economics. Happy to discuss numbers or answer questions here (keeping it high-level).
Disclaimer: All information given is meant to be educational. I am only
passing on historical information shared with me by owners, rental
companies, and various publications. I am not guaranteeing these
numbers, nor can I guarantee future rentals or appreciation. This
information is not intended to replace your own research, or to provide
legal, investment, or financial advice. Please consult an attorney for
legal advice.

Brandon Kunasek at Shorewise Wealth5119 Reviews
0Reply
82 views

2 Replies

Jump to latestLatest
  • Member since 2021 · 166 posts · 113 votes
    10mo

    Thanks for posting this, @Brandon Kunasek. A few questions about the expenses:

    Cleaning & Maint: 3.1%
    Legal and Common Area: 1%
    Repairs: 2.8%
    Supplies: 1.0%
    Utilities: 16.6%
    Capex (appliances): 0.8%

    These expenses are very favorable, but also quite low for a 10-unit coastal STR. They are closer to LTR multifamily expense ratios than a typical STR. Repairs, cleaning and capex seem to be understated for a property this size, especially if turnover is frequent. Your OPEX ratio is ~35% of gross, but normal coastal STR multifamily trends around 45-60%.

    How would you account for this? 

  • Brandon KunasekBusiness Member
    OP
    Myrtle Beach, SC · Member since 2022 · 22 posts · 2 votes
    10mo

    Great points, Jeff — and you're right to highlight that the expense ratios are unusually efficient for a coastal STR.

    A couple of clarifications on the numbers:

    • The current owner self-manages, which keeps cleaning and maintenance costs lower than a third-party STR manager would typically charge.

    • Some of the repairs and CapEx were front-loaded in prior years (new flooring, appliances, and paint), so last year’s P&L reflects more of a stabilized-operations scenario.

    • The utilities figure is accurate — it’s higher due to being master-metered for the property — but the other OPEX categories are slightly understated if you were to underwrite this as a fully managed, third-party operation.

    If I modeled it using a professional management assumption plus normalized reserves, the operating ratio trends closer to 48–50%, which aligns with what you mentioned for coastal STR multifamily.

    I appreciate you calling that out — it’s a great reminder of how much variance there can be between owner-operated and institutional-style expense reporting, especially in hybrid STR assets like this.

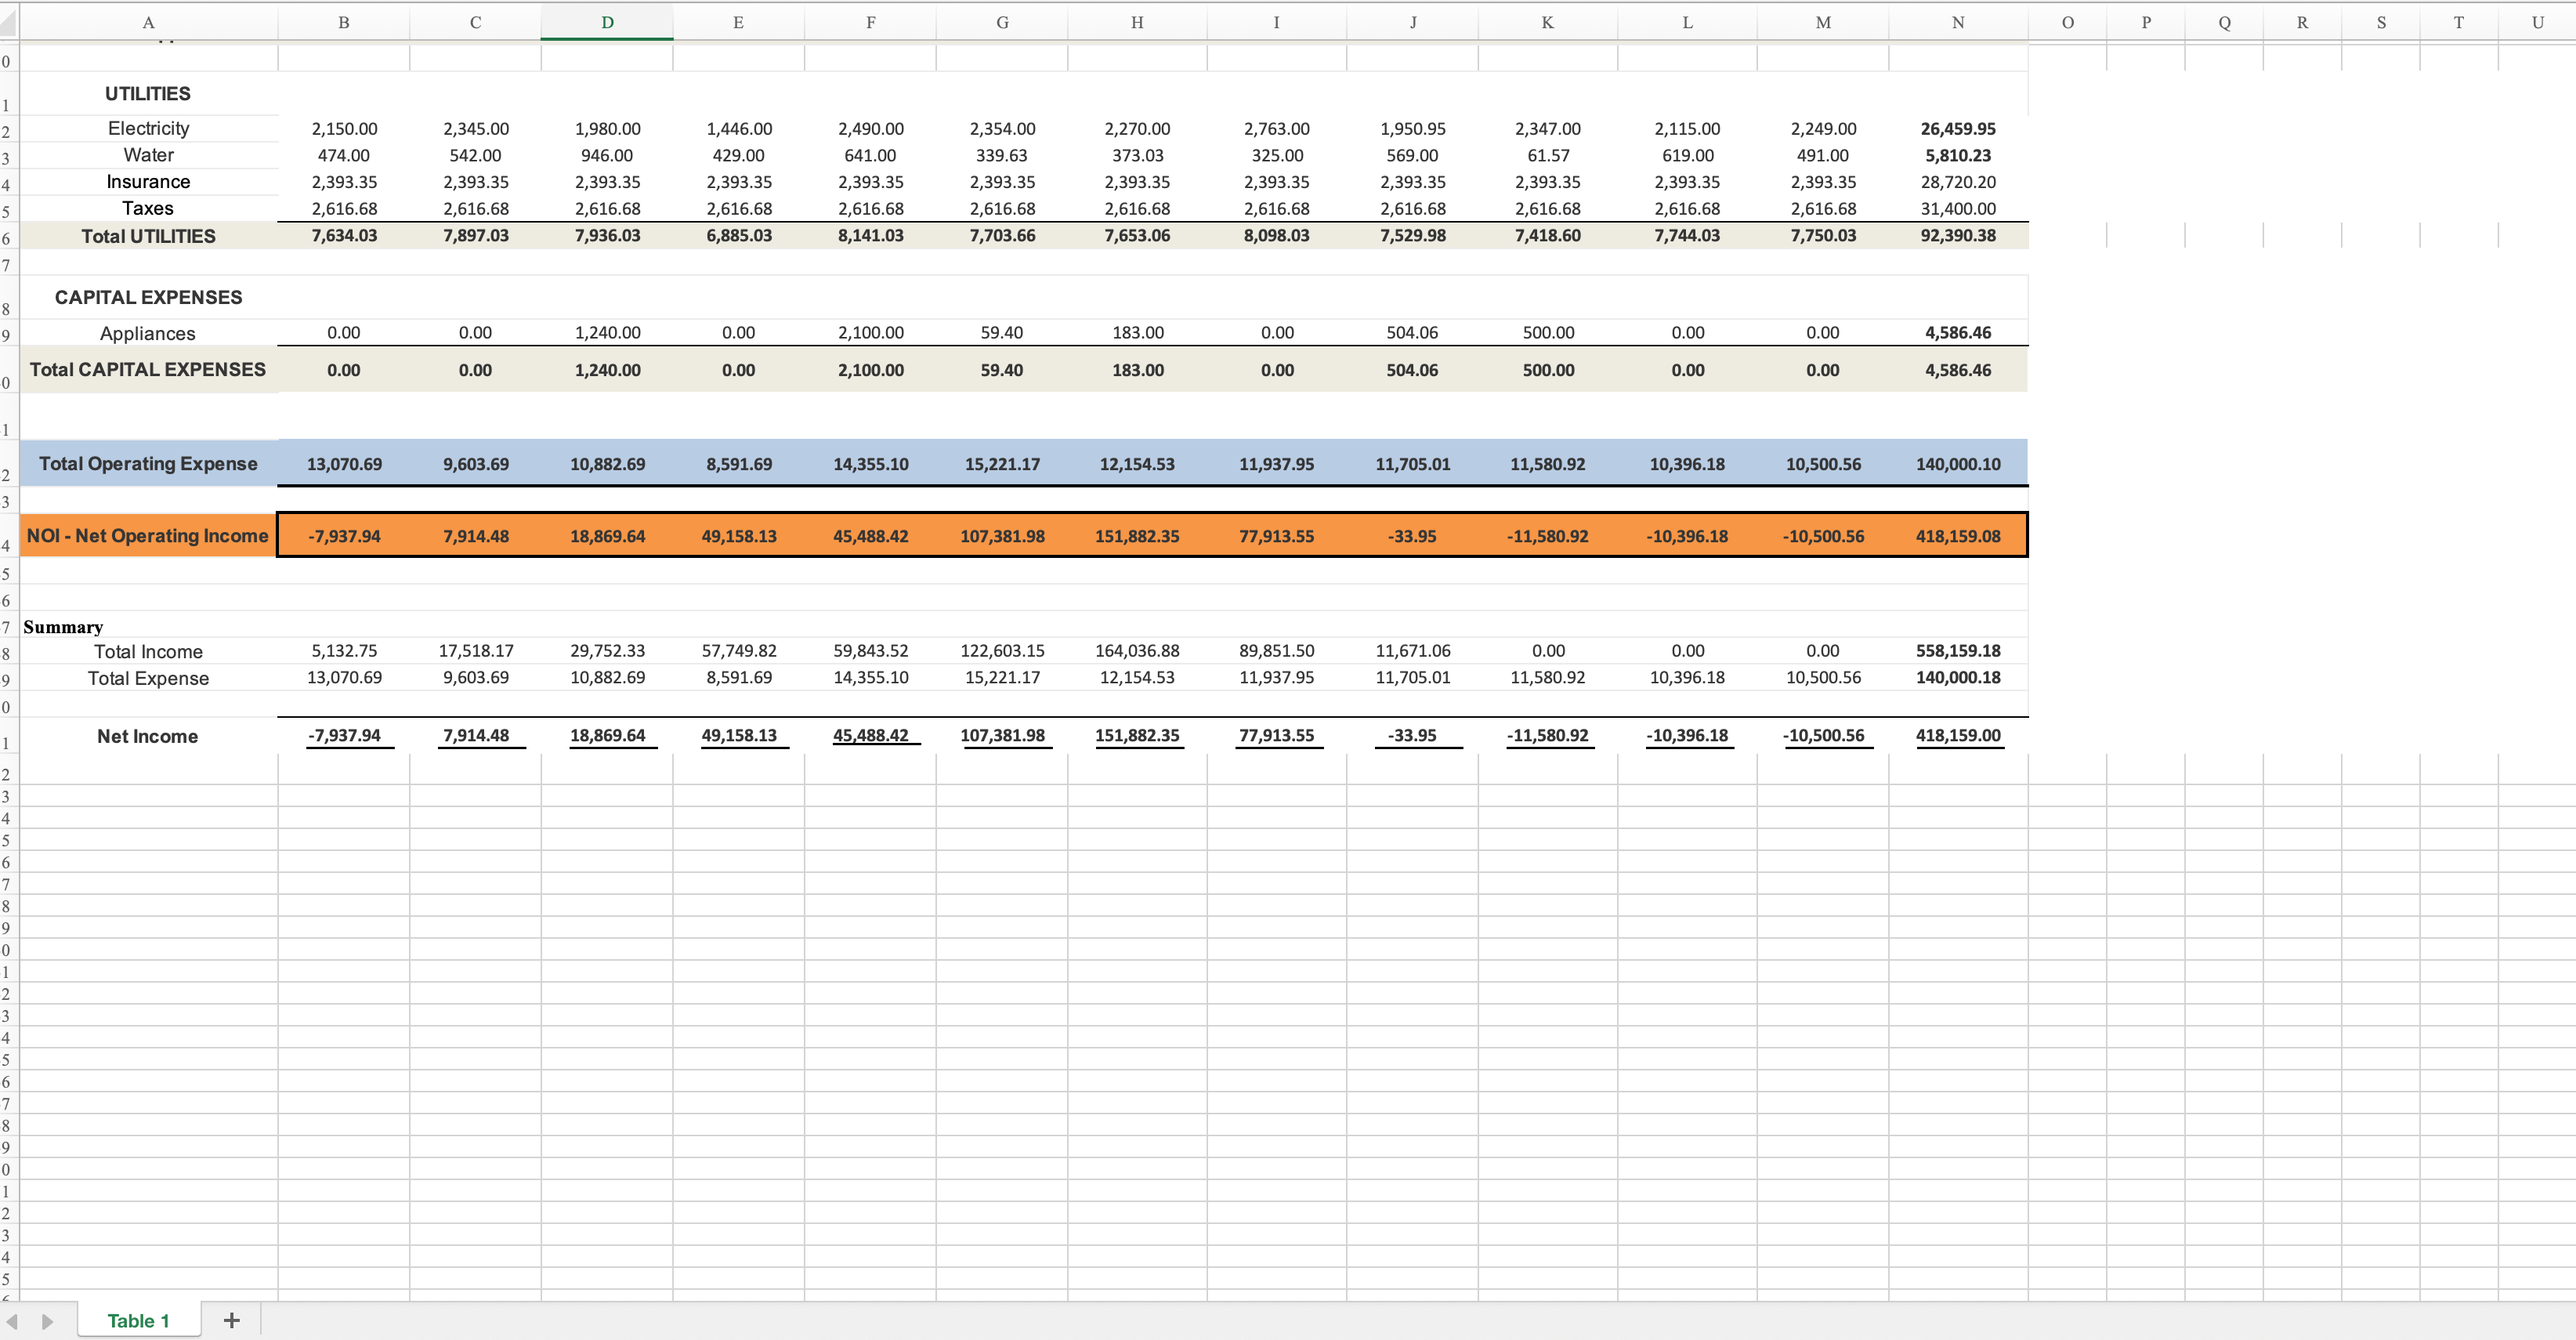
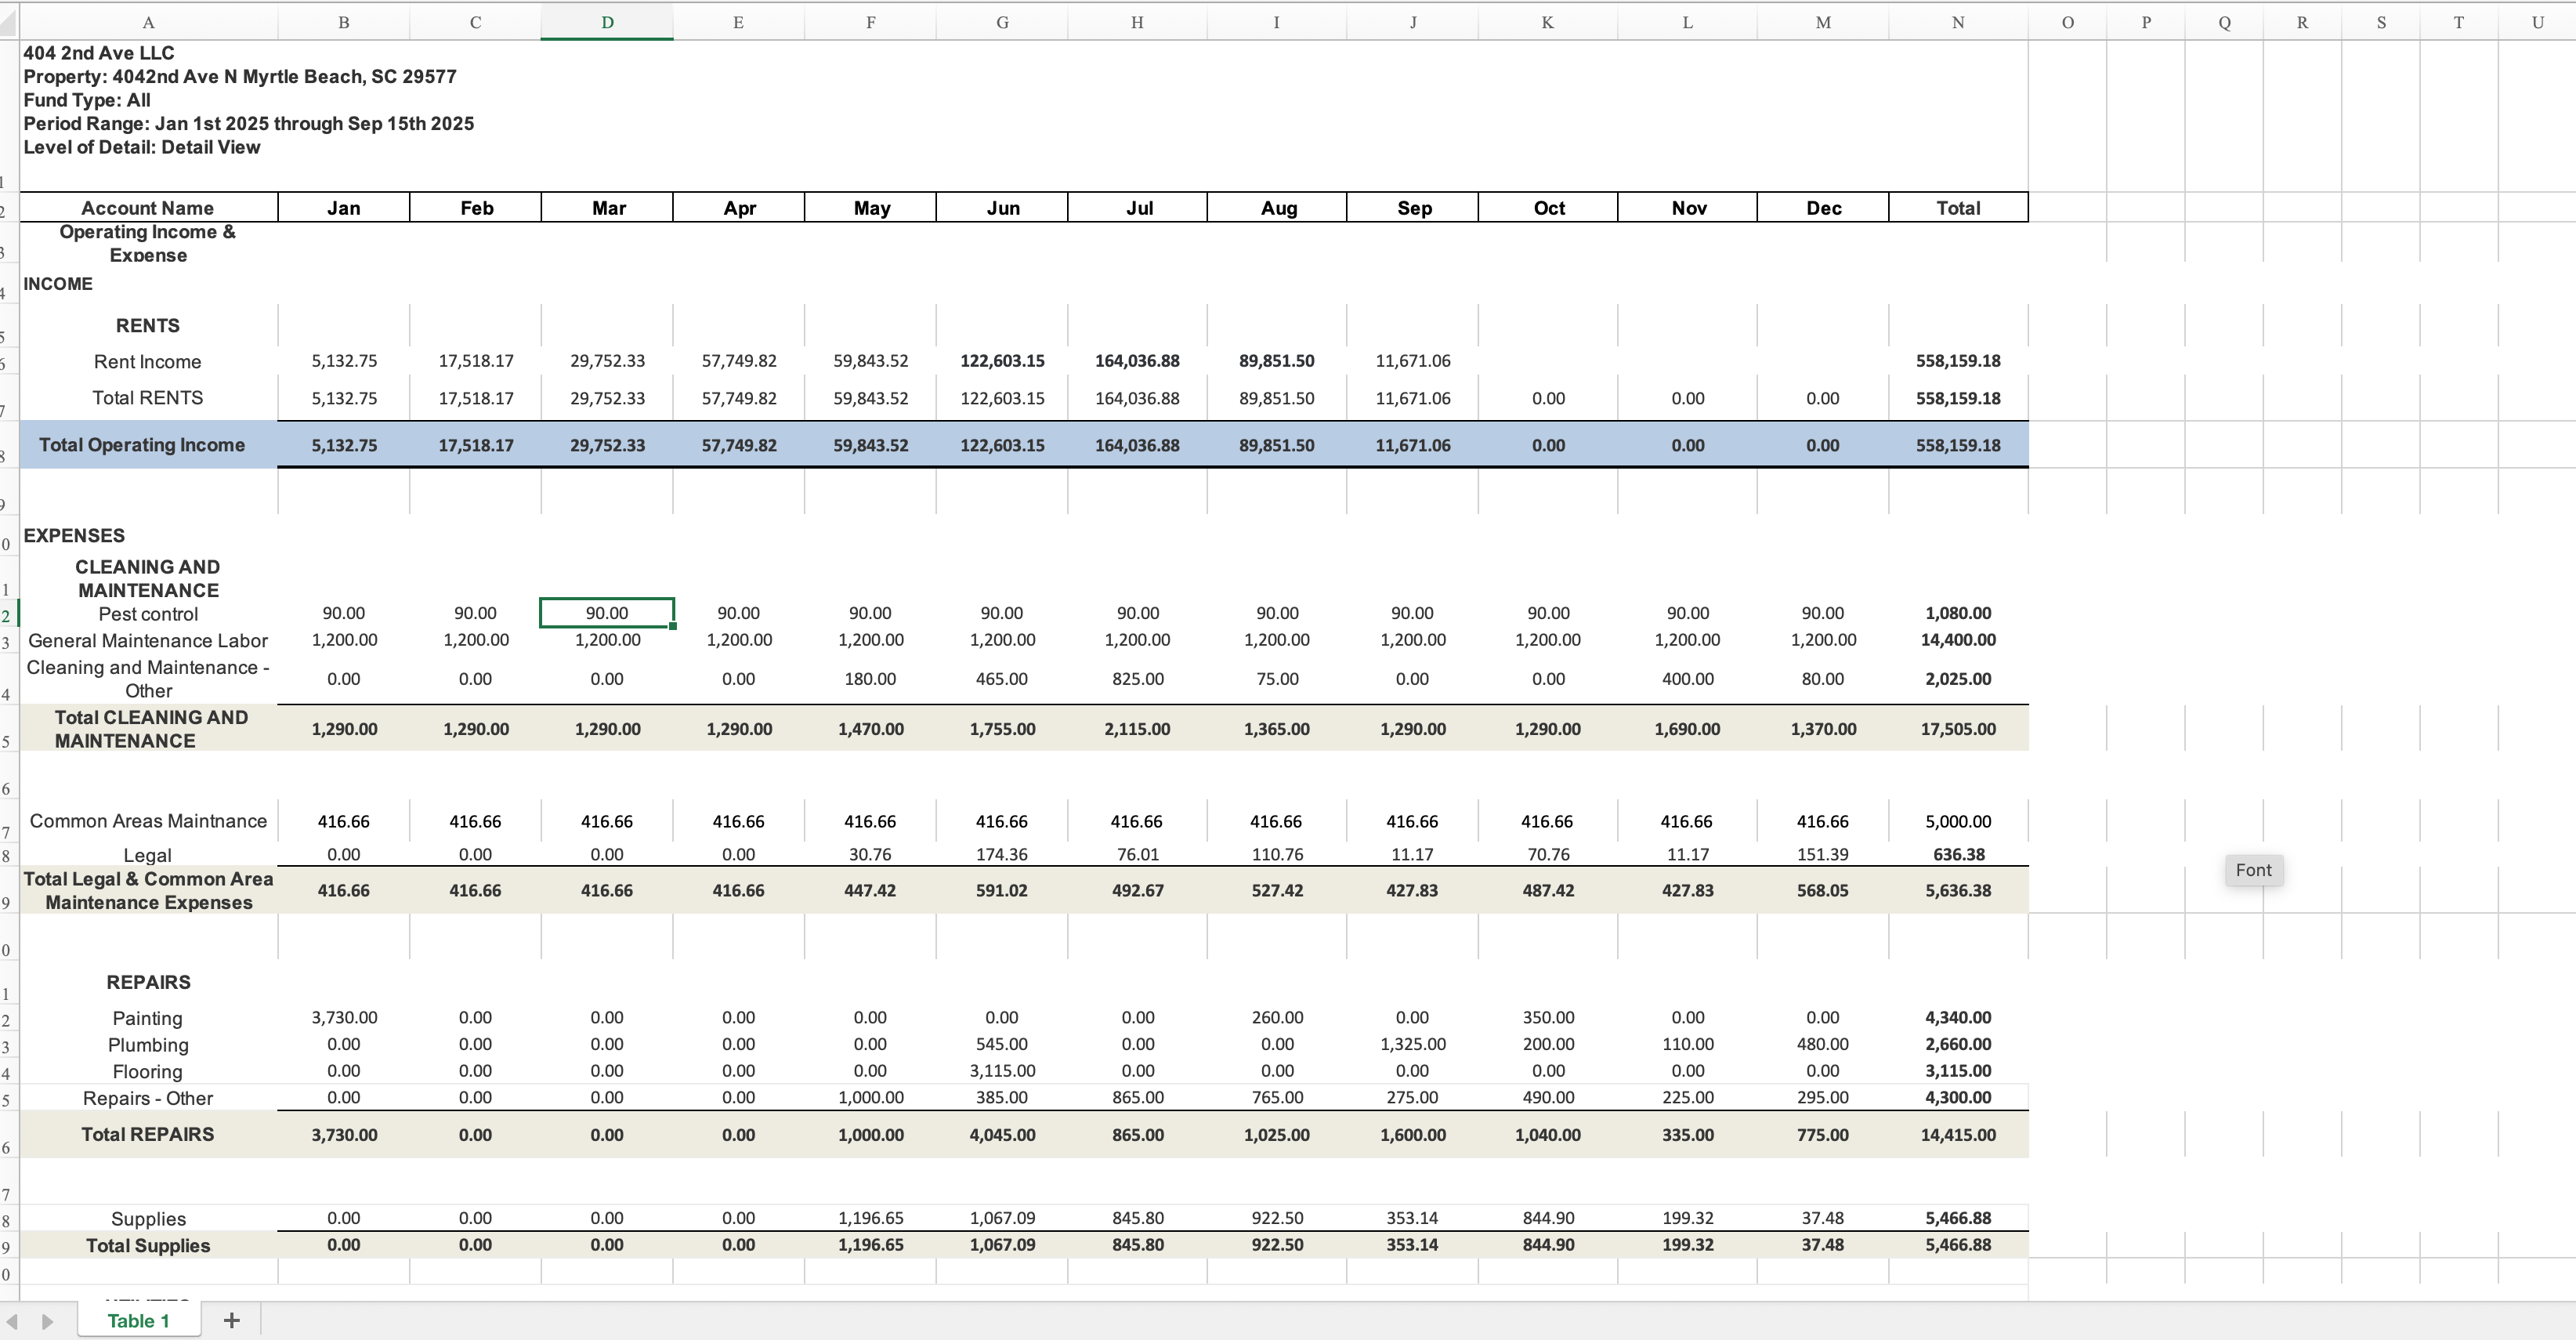
    Here's the owner's profit and loss statement for the exacts of the 2024 year. I've captured the statement in two screenshots below. 

    Jeff, let's hope on a call and see if there's any synergy for putting a deal together? 

    Brandon Kunasek at Shorewise Wealth5119 Reviews
Join the conversationCreate a free account to reply, vote on answers and follow this thread.