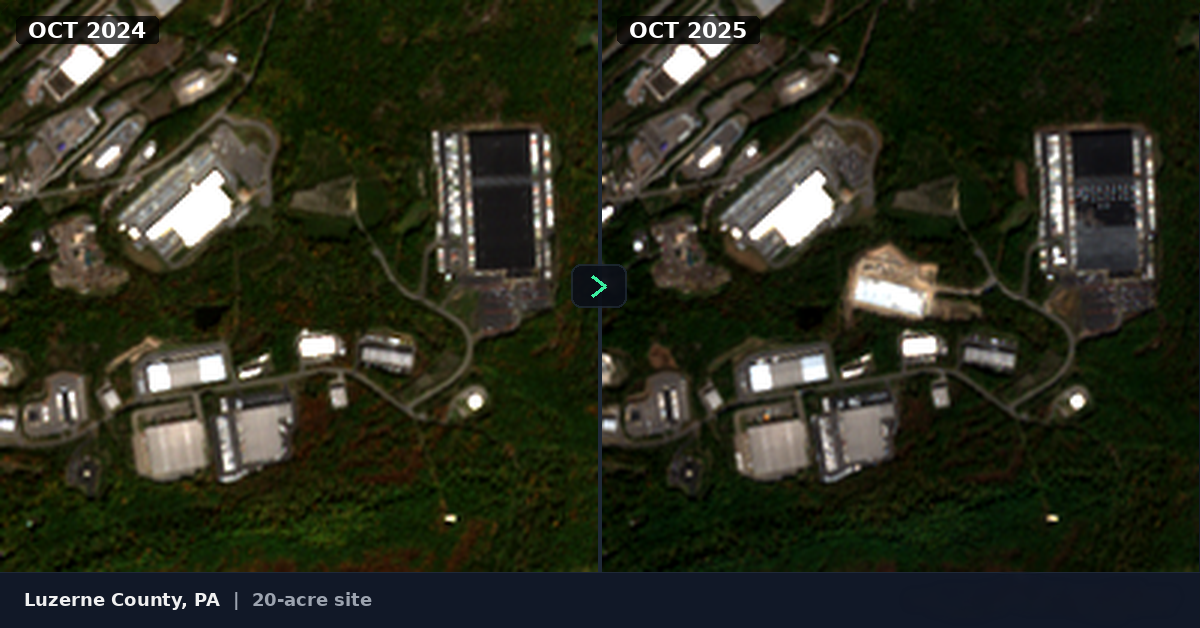
Analyzed satellite imagery across PA — here's where construction actually is:
Hey all - I work in project management in PA and as a side project I've been using satellite imagery to detect construction activity across the state. Figured this community would find the data interesting.
Quick background: Pennsylvania has 2,560 separate municipalities, each with their own permitting system. There's no single database you can search. So I started pulling free satellite imagery (Sentinel-2, 10m resolution) and wrote algorithms to pick up ground disturbance - cleared land, grading, that kind of thing. The image is an example - a 22-acre site in Montgomery County, October 2024 vs October 2025.

I've processed 5 years of imagery (2021–2025) across all 67 counties. Here's what stands out for 2025:
The 5 hottest regions by detected site count:
- Philadelphia Metro - 489 sites
- Lehigh Valley - 299 sites
- Scranton/Wilkes-Barre - 229 sites
- Pittsburgh Metro - 224 sites
- Lancaster/York Corridor - 223 sites
Scranton at #3 surprised me. The I-81 logistics corridor is pulling development northward from Lehigh Valley into Lackawanna and Luzerne counties. If you're looking at northeast PA, there's more ground being moved up there than I expected.
Lehigh Valley has some of the largest individual sites - 25+ acre projects that look like warehouse/distribution builds along I-78.
Year over year trend: 6,077 sites (2021) → 5,010 (2022) → 6,928 (2023) → 5,547 (2024) → 6,262 (2025). The 2022 dip lines up with rate hikes. The rebound since then has been stronger than I would've guessed.
Curious if anyone investing in PA sees this matching what you're experiencing on the ground? Especially interested to hear from anyone in the Scranton/Wilkes-Barre area or Lehigh Valley.
If anyone wants to know the numbers for a specific county, happy to pull it - I have all 67 loaded.