Austin Market Report - July 2026
July was another strong month for Austin-area home sales, with considerably more transactions and dollar volume than a year ago.
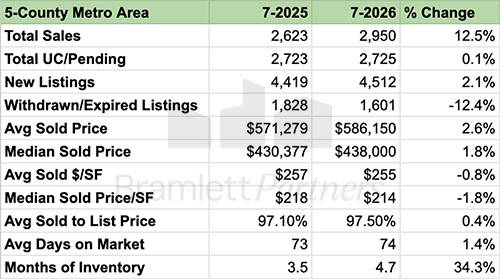
Total sales increased 12.5% year over year to 2,950, while monthly dollar volume jumped 15.4% to $1.73 billion. Year-to-date dollar volume is now 7.4% ahead of 2025, and both average and median sold prices finished modestly higher than last July.
What makes the July numbers interesting is that stronger sales have not translated into a more competitive market for buyers. Months of inventory remains elevated at 4.7 compared with 3.5 a year ago, price per square foot is slightly lower, and pending activity has finally converged with 2025 after running well ahead of last year through the spring.
So far, 2026 is shaping up as a stronger transaction market than 2025, but not necessarily a hotter housing market. More properties are changing hands while buyers continue to have considerably more choice and negotiating leverage.
Key Highlights (5-County Austin Metro)
- Total sales increased 12.5% year over year to 2,950, while monthly dollar volume rose 15.4% to $1.73 billion.
- Year-to-date dollar volume reached $10.85 billion, up 7.4% from the same period in 2025.
- Average sold price increased 2.6% to $586,150, while median sold price rose 1.8% to $438,000.
- Pending units were essentially flat at 2,725 versus 2,723 last July.
- New listings increased 2.1%, while withdrawn and expired listings declined 12.4%.
- Months of inventory came in at 4.7, up from 3.5 a year ago but slightly below June's 4.8.
Prices Are Up, But the Broader Trend Is Still Fairly Flat
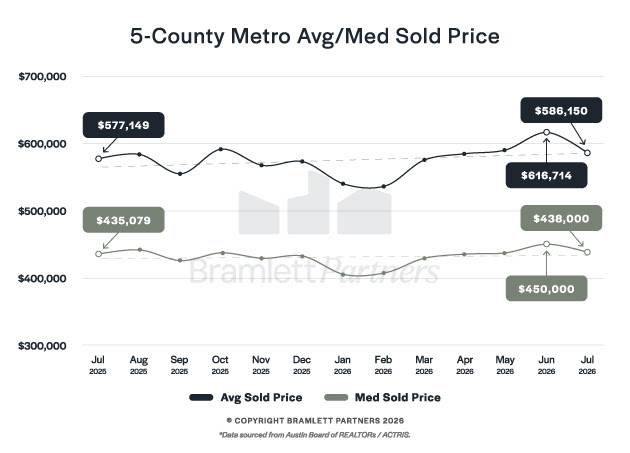
Average sold price increased 2.6% year over year to $586,150, while median sold price increased 1.8% to $438,000.
The twelve-month trend provides some useful context. Prices softened through the winter, recovered during the spring, peaked in June, and then gave some of that increase back in July. Overall, the market continues to look much more stable than either sharply appreciating or declining.
Price per square foot tells an even more restrained story. Average sold price per square foot declined 0.8% to $255, while the median declined 1.8% to $214.
That combination is important. Higher total sale prices alongside lower price per square foot suggest that at least some of the year-over-year increase in headline prices came from the mix of homes that sold, including larger properties, rather than broad appreciation across the market.
Closed Sales Were Strong, but Pending Activity Has Caught Up With Last Year
July produced 2,950 closed sales, up 12.5% from last year. That is a strong number and follows several months in which pending activity was running meaningfully ahead of 2025.
The pending data now looks different.
There were 2,725 properties pending or under contract in July compared with 2,723 last July, essentially no year-over-year change. As the chart below shows, 2026 ran well ahead of 2025 from February through June before the two lines converged in July.
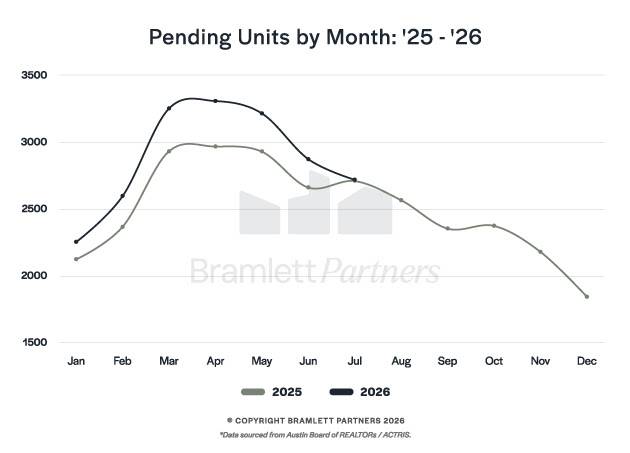
That does not necessarily signal a sudden deterioration in demand. July 2025 was a relatively strong comparison, and both years are now entering the normal seasonal slowdown. But pending units are one of the better forward indicators of future closings, so I would expect the large year-over-year gains in closed sales to become harder to maintain as we move into the fall.
Inventory Remains Elevated
New listings increased only modestly in July, up 2.1% to 4,512. As with pending units, the 2026 and 2025 new-listing curves have now moved fairly close together.
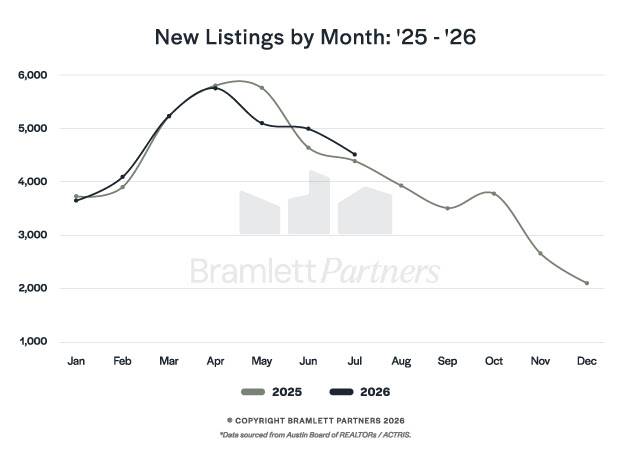
The bigger difference is the amount of inventory already available to buyers. Months of inventory finished July at 4.7 compared with 3.5 a year ago. That is slightly below June's 4.8 months, so inventory did not meaningfully increase during July itself, but it remains substantially higher than it was at this point last year.
Withdrawn and expired listings declined 12.4%, while closed sales increased 12.5%. That combination suggests sellers may be becoming more realistic about pricing and terms, allowing more listings to convert into sales rather than eventually being withdrawn or expiring.
Despite the additional supply, average days on market was nearly unchanged at 74 days, and the average sold-to-list price ratio actually improved slightly to 97.5%. This does not look like a distressed market. It looks more like a relatively balanced market with considerably more competition among sellers than we saw a year ago.
Dollar Volume Continues to Run Ahead of 2025
The combination of more sales and somewhat higher average prices pushed July dollar volume to $1.73 billion, up 15.4% year over year.
Year-to-date volume has now reached approximately $10.85 billion compared with $10.10 billion through July 2025, an increase of 7.4%.
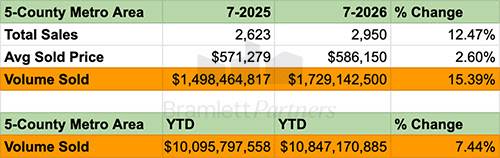
That is probably the clearest evidence that 2026 has been a stronger transaction market than 2025 so far. Even with affordability remaining difficult and inventory significantly higher, more real estate is actually changing hands.
Mortgage Rates Remain a Headwind
Mortgage rates have not provided much help on affordability. After briefly approaching 6% in early March, the 30-year fixed rate trended higher through the spring and summer and stood at 6.74% on August 7, according to Mortgage News Daily.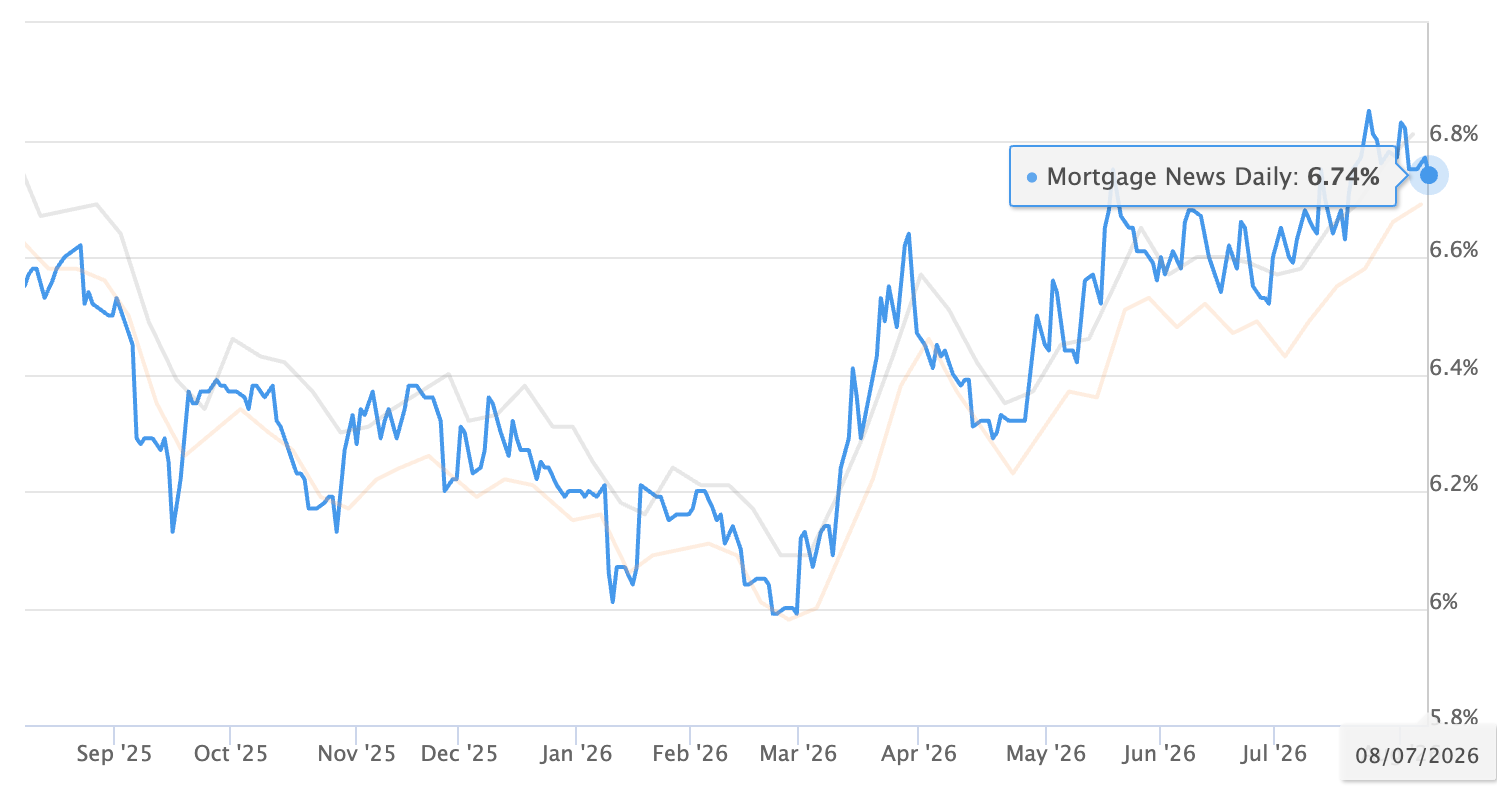 What is notable is that Austin transaction activity has improved despite that increase. In other words, the stronger 2026 sales numbers have not been driven by a major improvement in financing conditions. Buyers have instead benefited from more inventory and negotiating leverage, while sellers appear to be gradually adjusting to a market where waiting for dramatically lower rates has not been a reliable strategy.
If You’re a Buyer
The late summer and fall market should continue to offer buyers meaningful choice. Inventory remains elevated, price per square foot is slightly below last year, and the normal seasonal decline in buyer activity is beginning.
That does not mean every property is negotiable. Well-priced homes in strong locations can still move quickly. But listings that accumulate days on market may provide opportunities to negotiate on price, repairs, closing costs, or other terms.
If You’re a Seller
The good news is that buyers are active. July sales were up 12.5%, dollar volume was up more than 15%, and homes that sell are still closing at an average of 97.5% of list price.
The challenge is competition. Buyers have substantially more inventory to choose from than they did last year, and the seasonal slowdown is beginning. Pricing correctly from the outset becomes increasingly important as we move into the fall. Chasing the market with a series of small reductions is usually much harder than positioning the property correctly when it first comes to market.
As always, real estate is hyperlocal. Market conditions can vary considerably by neighborhood, property type, and price range. If you'd like to talk through what the market means for your plans, feel free to reach out.
