The Saint Paul Duplex Map: Which Neighborhoods Actually Made Money?
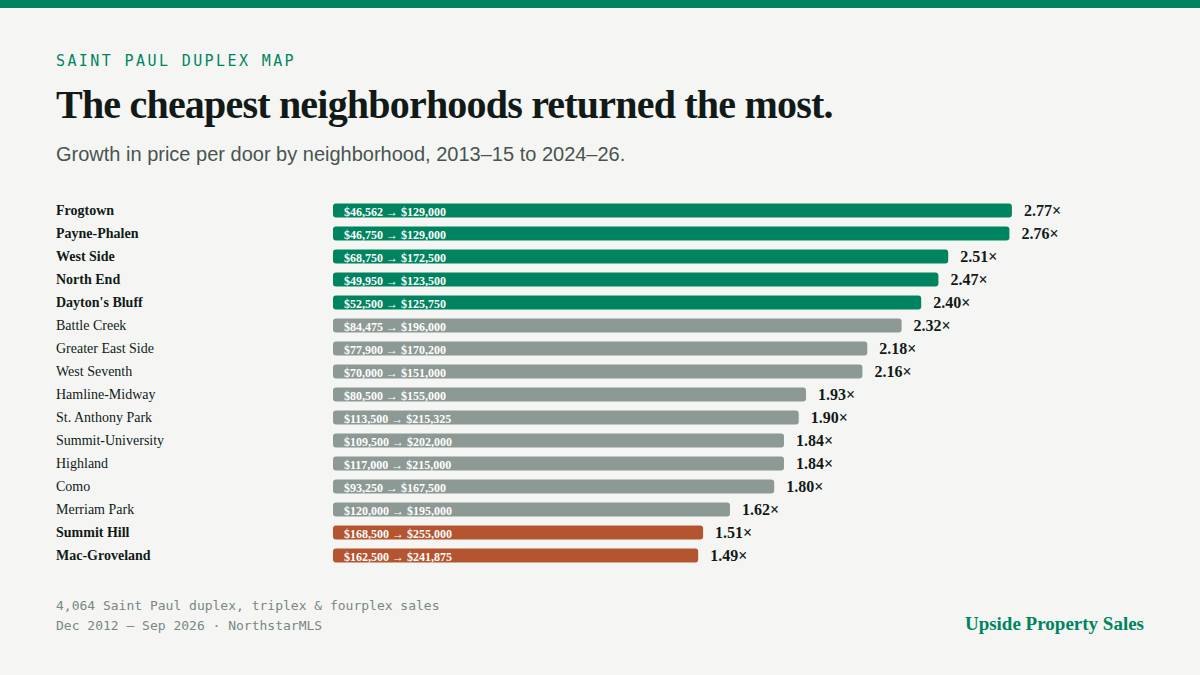
I ranked all 16 St. Paul neighborhoods by duplex appreciation over 11 years. The ranking is almost exactly inverse to price.
Method below, then the numbers, then where I think it breaks. Tell me what I got wrong.
THE DATA
4,064 closed 2-4 unit sales in Saint Paul, December 2012 through September 2026, NorthstarMLS, grouped by the MLS neighborhood field. Price per door is sale price divided by unit count.
TWO INDEPENDENT MEASURES
I did not want to publish a single-method ranking, so I ran it two ways.
First, change in median price per door between 2013-15 and 2024-26. Simple, but not quality-adjusted.
Second, matched repeat sales, which finds buildings that sold twice and subtracts. That is free of mix effects entirely, because it is the same building both times. I kept only holds of two years or more with both prices above $50,000 and no decline steeper than 35%, which gave 828 pairs.
The two rankings agree at a Spearman rho of 0.886. A separate parsing path reproduced all sixteen multiples exactly.
THE RANKING (growth in $/door, 2013-15 to 2024-26)
Frogtown 2.77x $46,562 -> $129,000
Payne-Phalen 2.76x $46,750 -> $129,000
West Side 2.51x $68,750 -> $172,500
North End 2.47x $49,950 -> $123,500
Dayton's Bluff 2.40x $52,500 -> $125,750
Battle Creek 2.32x $84,475 -> $196,000
Greater East Side 2.18x $77,900 -> $170,200
West Seventh 2.16x $70,000 -> $151,000
Hamline-Midway 1.93x $80,500 -> $155,000
St. Anthony Park 1.90x $113,500 -> $215,325
Summit-University 1.84x $109,500 -> $202,000
Highland 1.84x $117,000 -> $215,000
Como 1.80x $93,250 -> $167,500
Merriam Park 1.62x $120,000 -> $195,000
Summit Hill 1.51x $168,500 -> $255,000
Mac-Groveland 1.49x $162,500 -> $241,875
Every one of the top five started under $80,000 a door. Both of the bottom two started above $160,000.
REPEAT SALES VERSION (median annualized, same building twice)
Dayton's Bluff 8.7% (111 pairs), Frogtown 8.7% (88), North End 8.7% (58),
Payne-Phalen 8.6% (150), Greater East Side 8.5% (39), West Side 8.2% (89),
West Seventh 8.1% (43), Summit-University 7.7% (62), Battle Creek 7.6% (21),
Hamline-Midway 6.6% (32), Merriam Park 6.6% (46), Como 6.4% (14),
Summit Hill 5.4% (20), Mac-Groveland 5.1% (36)
Same story from a completely different angle.
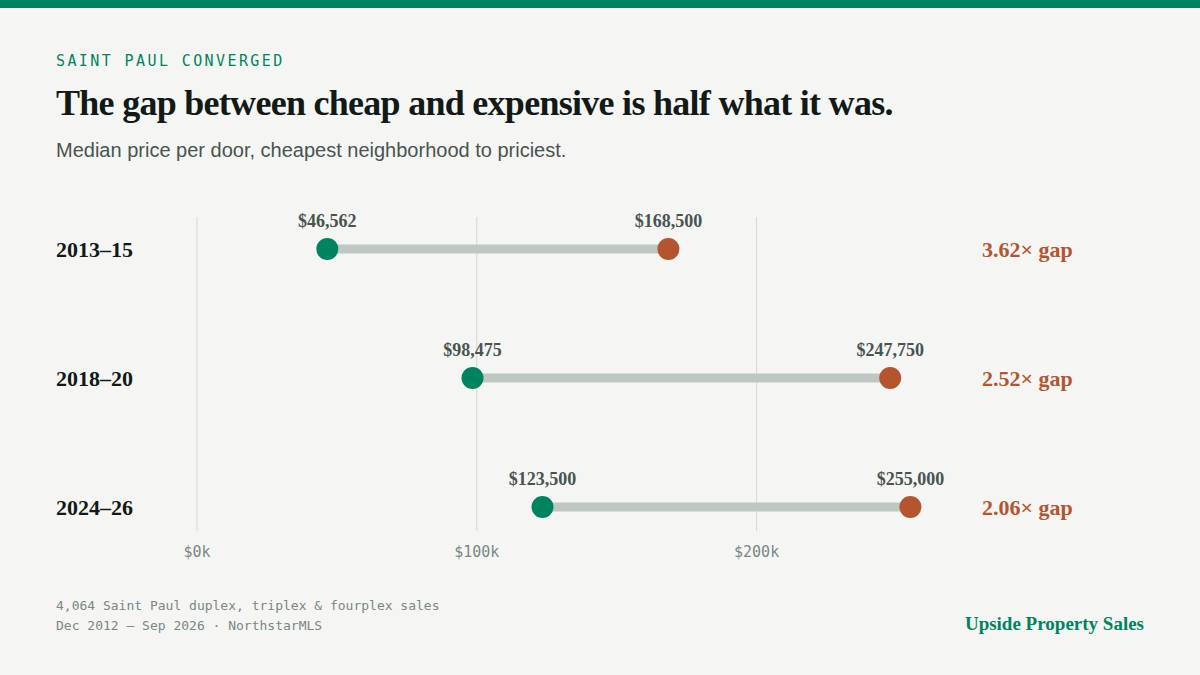
THE CONVERGENCE
The spread between the cheapest and priciest neighborhood:
2013-15: 3.62x ($46,562 Frogtown to $168,500 Summit Hill)
2018-20: 2.52x ($98,475 North End to $247,750 Summit Hill)
2024-26: 2.06x ($123,500 North End to $255,000 Summit Hill)
St. Paul's duplex market got substantially more uniform. Note that most of the compression happened before 2020, which sets up the next section.
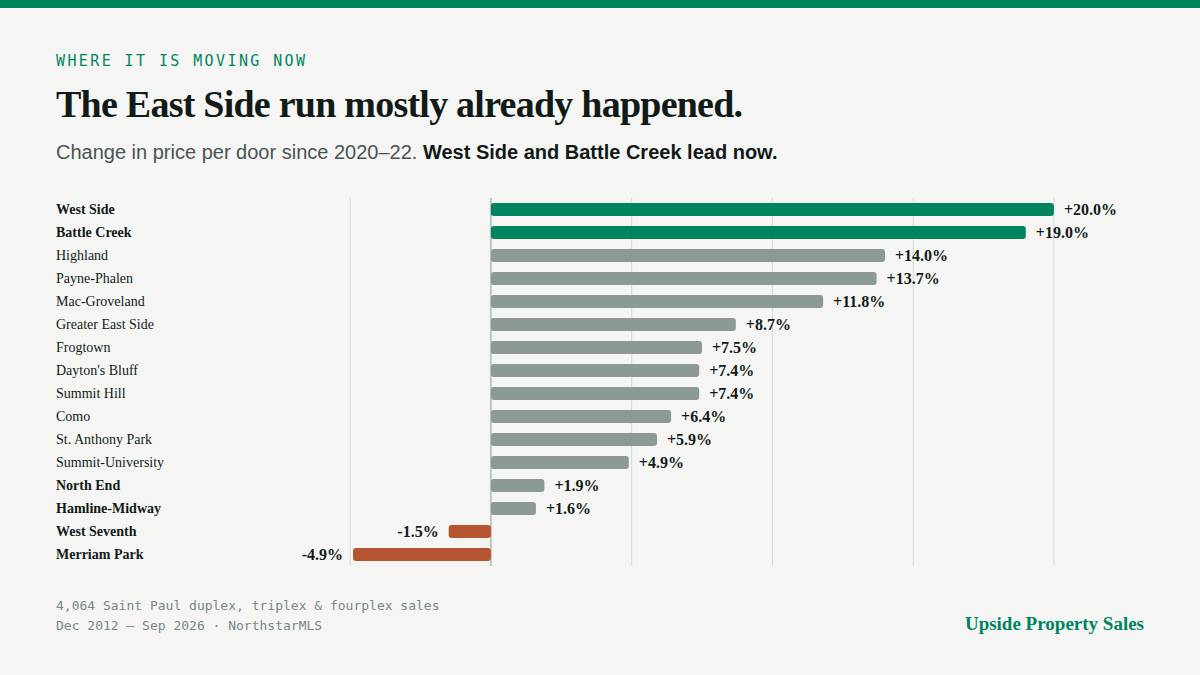
WHERE IT IS MOVING NOW
This is the part that keeps an eleven-year ranking from being misleading. Change in median price per door from 2020-22 to 2024-26:
West Side +20.0% (2.51x since 2013)
Battle Creek +19.0% (2.32x)
Highland +14.0% (1.84x)
Payne-Phalen +13.7% (2.76x)
Mac-Groveland +11.8% (1.49x)
Greater East Side +8.7% (2.18x)
Frogtown +7.5% (2.77x)
Dayton's Bluff +7.4% (2.40x)
Summit Hill +7.4% (1.51x)
Como +6.4% (1.80x)
St. Anthony Park +5.9% (1.90x)
Summit-University +4.9% (1.84x)
North End +1.9% (2.47x)
Hamline-Midway +1.6% (1.93x)
West Seventh -1.5% (2.16x)
Merriam Park -4.9% (1.62x)
Read the two columns against each other. North End grew 2.47x over eleven years and 1.9% over the last four. Mac-Groveland grew 1.49x over eleven years and 11.8% over the last four.
The order is not reversing, but it is no longer the same order. The East Side catch-up was largely a 2013 to 2020 story.
ENTRY PRICE TODAY (median $/door, 2024-26)
North End $123,500, Dayton's Bluff $125,750, Frogtown $129,000,
Payne-Phalen $129,000, West Seventh $151,000, Hamline-Midway $155,000,
Como $167,500, Greater East Side $170,200, West Side $172,500,
Merriam Park $195,000, Battle Creek $196,000, Summit-University $202,000,
Highland $215,000, St. Anthony Park $215,325, Mac-Groveland $241,875,
Summit Hill $255,000
WHERE THIS COULD BE WRONG
1. Price per door is not quality-adjusted. If Frogtown duplexes selling today are meaningfully nicer than the distressed inventory that sold in 2014, part of that 2.77x is the buildings improving rather than the neighborhood. The repeat-sales version exists specifically to check this, and it agrees at 0.886, which is reassuring but not proof.
2. 2013 was near the bottom for the cheap neighborhoods. Frogtown and Payne-Phalen were full of post-foreclosure inventory at prices that were not normal. Some of the outperformance is recovery from a crash. A different start date compresses the ranking.
3. The small neighborhoods are thin. St. Anthony Park has 55 sales over fourteen years, Highland 80, Battle Creek 21 matched pairs. Payne-Phalen with 754 sales and Dayton's Bluff with 471 are the rows you can lean on.
4. 2026 is a partial year, running through early September.
5. None of this is income. It is what buildings sold for. The neighborhoods that appreciated fastest are not automatically the ones that cash flowed best, and I have no rent data to check.
The practical read: if you are buying today on the strength of the eleven-year column, you are buying a run that already happened. The recent column is the one that applies to a purchase this month, and it points somewhere different.
Poke holes in it.