Price Cuts Are Up 42% in Ohio – Here's What That Means for Off-Market Deals

Price Cuts Are Up 42% in Ohio – Here's What That Means for Off-Market Deals

Virtual Assistant · Toledo, OH · Member since 2026 · 84 posts · 36 votes

I've been tracking Ohio market data closely, and one number stands out: about 42% of homes listed in Ohio this year have taken a price cut. That's significantly above the national average.

What does that mean for off‑market deals?

When the retail market softens, sellers who are already behind on taxes or dealing with vacancy become even more motivated. They see fewer showings, longer days on market, and price reductions happening around them. That pressure often pushes them to consider cash offers outside the MLS.

What I'm seeing in the data:

· Inventory is rising across Toledo and Cleveland

· Days on market are stretching

· Tax‑delinquent owners are getting more responsive

For investors who are sourcing off‑market, this environment often means less competition and more leverage.

What are you seeing in your local market? Are motivated sellers becoming easier to engage compared to 2025?

3Reply
176 views

8 Replies

Jump to latestLatest
  • Investor · Louisville, KY · Member since 2017 · 92 posts · 38 votes
    3mo

    Interesting observations. I'm curious whether we're entering a market where simply buying a turnkey rental off the MLS becomes even less attractive, while value-add investing starts to shine again.

    I'm still relatively new to investing, but it seems like if inventory is rising and retail buyers are becoming more selective, that should create opportunities for investors who can solve problems—whether that's buying distressed properties, using BRRRR, creative financing, or simply helping sellers who need certainty over top dollar.

    One thing I'm wondering: are tax-delinquent owners actually becoming more motivated because of the softer market, or are they just taking longer before accepting reality? Have any of you noticed your negotiation leverage improving compared to a year ago?

    Also curious whether anyone is seeing similar trends outside of Ohio. I'm in Kentucky, and it feels like we're starting to see more price reductions and longer days on market here too, but I haven't been investing long enough to know if that's translating into noticeably better deals yet.

    • Virtual Assistant · Toledo, OH · Member since 2026 · 84 posts · 36 votes
      3mo
      Quote from @Christian Grosskopf:

      Interesting observations. I'm curious whether we're entering a market where simply buying a turnkey rental off the MLS becomes even less attractive, while value-add investing starts to shine again.

      I'm still relatively new to investing, but it seems like if inventory is rising and retail buyers are becoming more selective, that should create opportunities for investors who can solve problems—whether that's buying distressed properties, using BRRRR, creative financing, or simply helping sellers who need certainty over top dollar.

      One thing I'm wondering: are tax-delinquent owners actually becoming more motivated because of the softer market, or are they just taking longer before accepting reality? Have any of you noticed your negotiation leverage improving compared to a year ago?

      Also curious whether anyone is seeing similar trends outside of Ohio. I'm in Kentucky, and it feels like we're starting to see more price reductions and longer days on market here too, but I haven't been investing long enough to know if that's translating into noticeably better deals yet.

      Christian, you're asking the exact question I've been turning over in my head.
      I think the reality is that motivated sellers and motivated buyers are like two magnets that only attract each other when both are ready. Softer retail markets tend to push more owners into the "why not sell?" category, but it takes time for the urgency to build. I've been tracking this tax‑delinquent list I'm working with closely, and I've noticed that owners who were delinquent for 2+ years are starting to be more responsive now than they were 6 months ago – but it's not a flood.
      As for whether I've seen negotiation leverage improve: yes. More owners are open to cash offers now when they see fewer showings and more price cuts around them. The awareness of market softening is creating opportunity, even if it's gradual.
      I'm also seeing that investors who are willing to solve problems – like buying as‑is, using creative financing, or handling BRRRR – are starting to find better entry points than a year ago. Have you noticed a shift in the types of deals that actually pencil out for you in Kentucky lately?
  • Member since 2026 · 119 posts · 44 votes
    3mo

    The price cut stat is a leading indicator but the more useful signal is days on market by county. Cuyahoga and Franklin tend to absorb softness differently than smaller Ohio markets like Stark or Mahoning. Sellers in those secondary markets have fewer comps to anchor to, so the motivation gap between listed and off-market widens faster when retail slows.

    • Virtual Assistant · Toledo, OH · Member since 2026 · 84 posts · 36 votes
      3mo
      Quote from @Carson Nordmann:

      The price cut stat is a leading indicator but the more useful signal is days on market by county. Cuyahoga and Franklin tend to absorb softness differently than smaller Ohio markets like Stark or Mahoning. Sellers in those secondary markets have fewer comps to anchor to, so the motivation gap between listed and off-market widens faster when retail slows.

      Carson, that's a really useful lens – looking at days‑on‑market by county rather than just the statewide price cut number.
      I've been focused on Cuyahoga and Lucas, but your point about smaller markets like Stark or Mahoning having fewer comps to anchor sellers makes a lot of sense. When retail softens, those markets likely see a wider motivation gap faster.
      When you're filtering by days‑on‑market for those secondary counties, is there a specific threshold you use – like 60+ days – to decide which owners are worth reaching out to first? Or do you combine it with other factors like tax delinquency?
    • Member since 2026 · 119 posts · 44 votes
      3mo

      @Okechukwu Treasure C Days on market alone is a weak filter. I'd stack it with tax delinquency. Either signal alone misses too much.

  • Chris SeveneyBusiness Member
    Moderator
    Investor · VA · Member since 2015 · 21k+ posts · 19k+ votes
    3mo

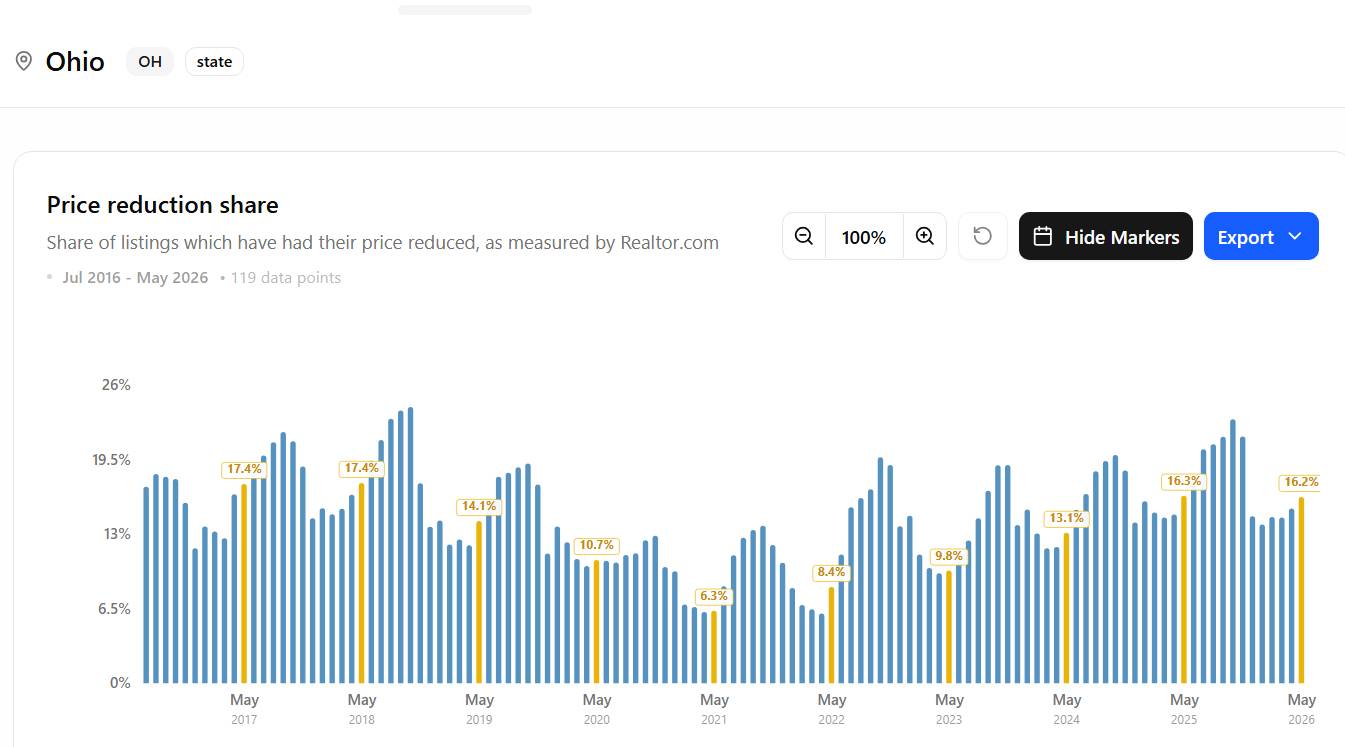
    Where are you getting your data from? Here is the data that I am seeing which is very different and stark from the data you are getting.
    7e investments53 Reviews
    • Virtual Assistant · Toledo, OH · Member since 2026 · 84 posts · 36 votes
      3mo
      Quote from @Chris Seveney:

      Where are you getting your data from? Here is the data that I am seeing which is very different and stark from the data you are getting.

      Chris, thanks for pushing back – always good to verify data sources.
      The 42% figure I referenced is the share of Ohio listings that have taken a price reduction at some point this year (cumulative), not the current active share. Your Realtor.com chart shows the current active share at 19.5%, which matches what I've seen on a point‑in‑time basis.
      Both numbers are correct – they just measure different things. The cumulative figure is useful for showing how many sellers have had to adjust their expectations over the course of 2026, while the active share shows current market conditions.
      Appreciate you keeping me honest – what are you seeing on the ground in Virginia?
  • Coral Springs, FL · Member since 2018 · 474 posts · 105 votes
    1mo

    Carson nailed it (119 posts, 42 votes): "Days on market alone is a weak filter. I'd stack it with tax delinquency. Either signal alone misses too much." That's exactly the convergence principle — but I'd push it one step further.

    Stacking 2 signals (DOM + tax delinquency) is good. Stacking 3 signals is where you stop wasting time on people who aren't actually motivated.

    Here's what I mean for Ohio markets specifically:

    Signal #1: Tax delinquency (financial pressure — county confirms they owe back taxes)
    Signal #2: Code enforcement violations (physical distress — city documents property condition issues)
    Signal #3: Clerk of court filings (legal pressure — probate, liens, foreclosure proceedings)

    When you cross-reference all three on the same property, you're not just finding someone who's behind on taxes. You're finding someone where 3 separate government agencies have independently confirmed their situation is deteriorating — financially, physically, AND legally. That's a fundamentally different conversation than calling someone on a tax list alone.

    Christian's question (92 posts, 38 votes) about whether tax-delinquent owners are "more motivated or just taking longer" — the answer depends on whether they're on JUST the tax list, or whether they also have code violations AND court filings. The ones with all 3 aren't taking longer to accept reality. Their reality is already confirmed by 3 government databases. They're not hoping the market bounces back — they're dealing with compounding pressure from multiple directions.

    For Ohio: Cuyahoga County, Lucas County, Franklin County all have these data sources online. The tax delinquent list is thousands of properties. But when you filter for the ones that ALSO have open code violations AND active court cases? That's probably 50-100 properties, not 5,000. Skip tracing 100 converged names costs $10-$15 vs $500+ for the full tax list everyone else is calling.

    Treasure's point about 2+ year delinquents being more responsive (83 posts, 32 votes) tracks — but the ones who are REALLY responsive are the ones where code enforcement has been out to the property AND there's a court filing. That's the convergence sweet spot.

    Chris Seveney's data pushback (21k+ posts, 19k+ votes, moderator) is valuable — cumulative vs point-in-time matters. But the convergence approach works regardless of which metric you're using, because you're not looking at market-wide stats. You're looking at specific properties where 3 government sources confirm distress.

Join the conversationCreate a free account to reply, vote on answers and follow this thread.