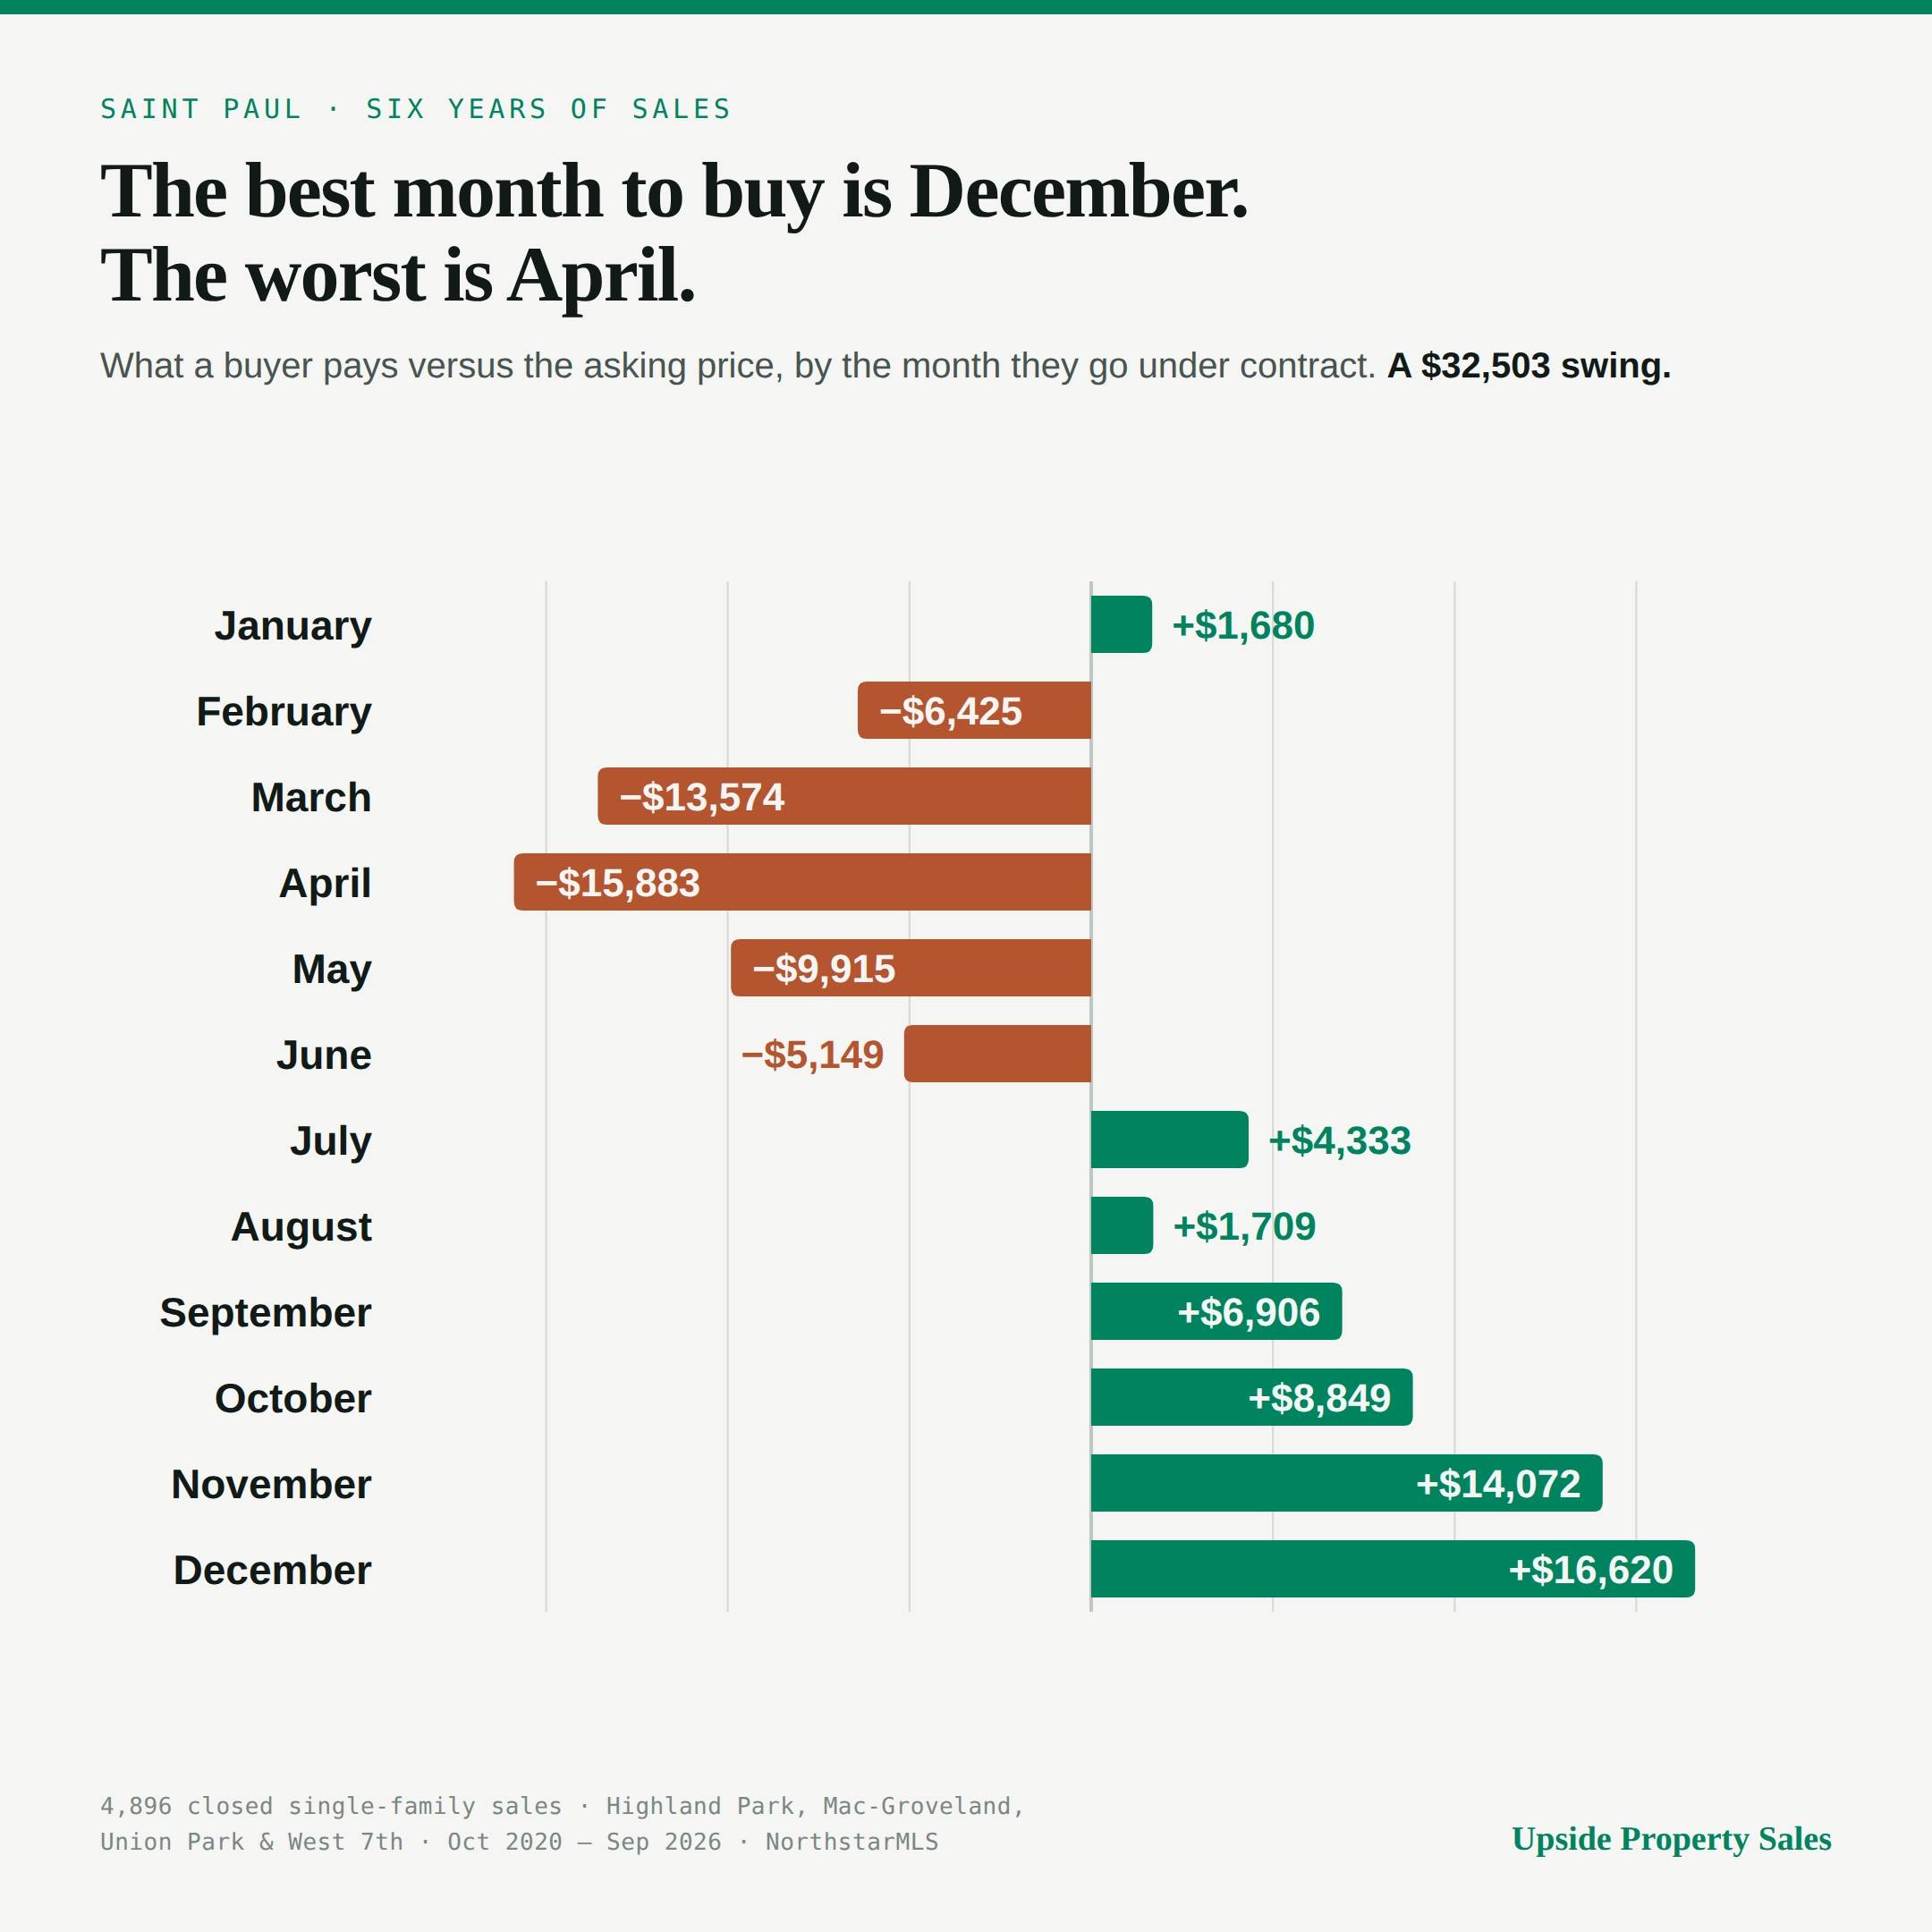
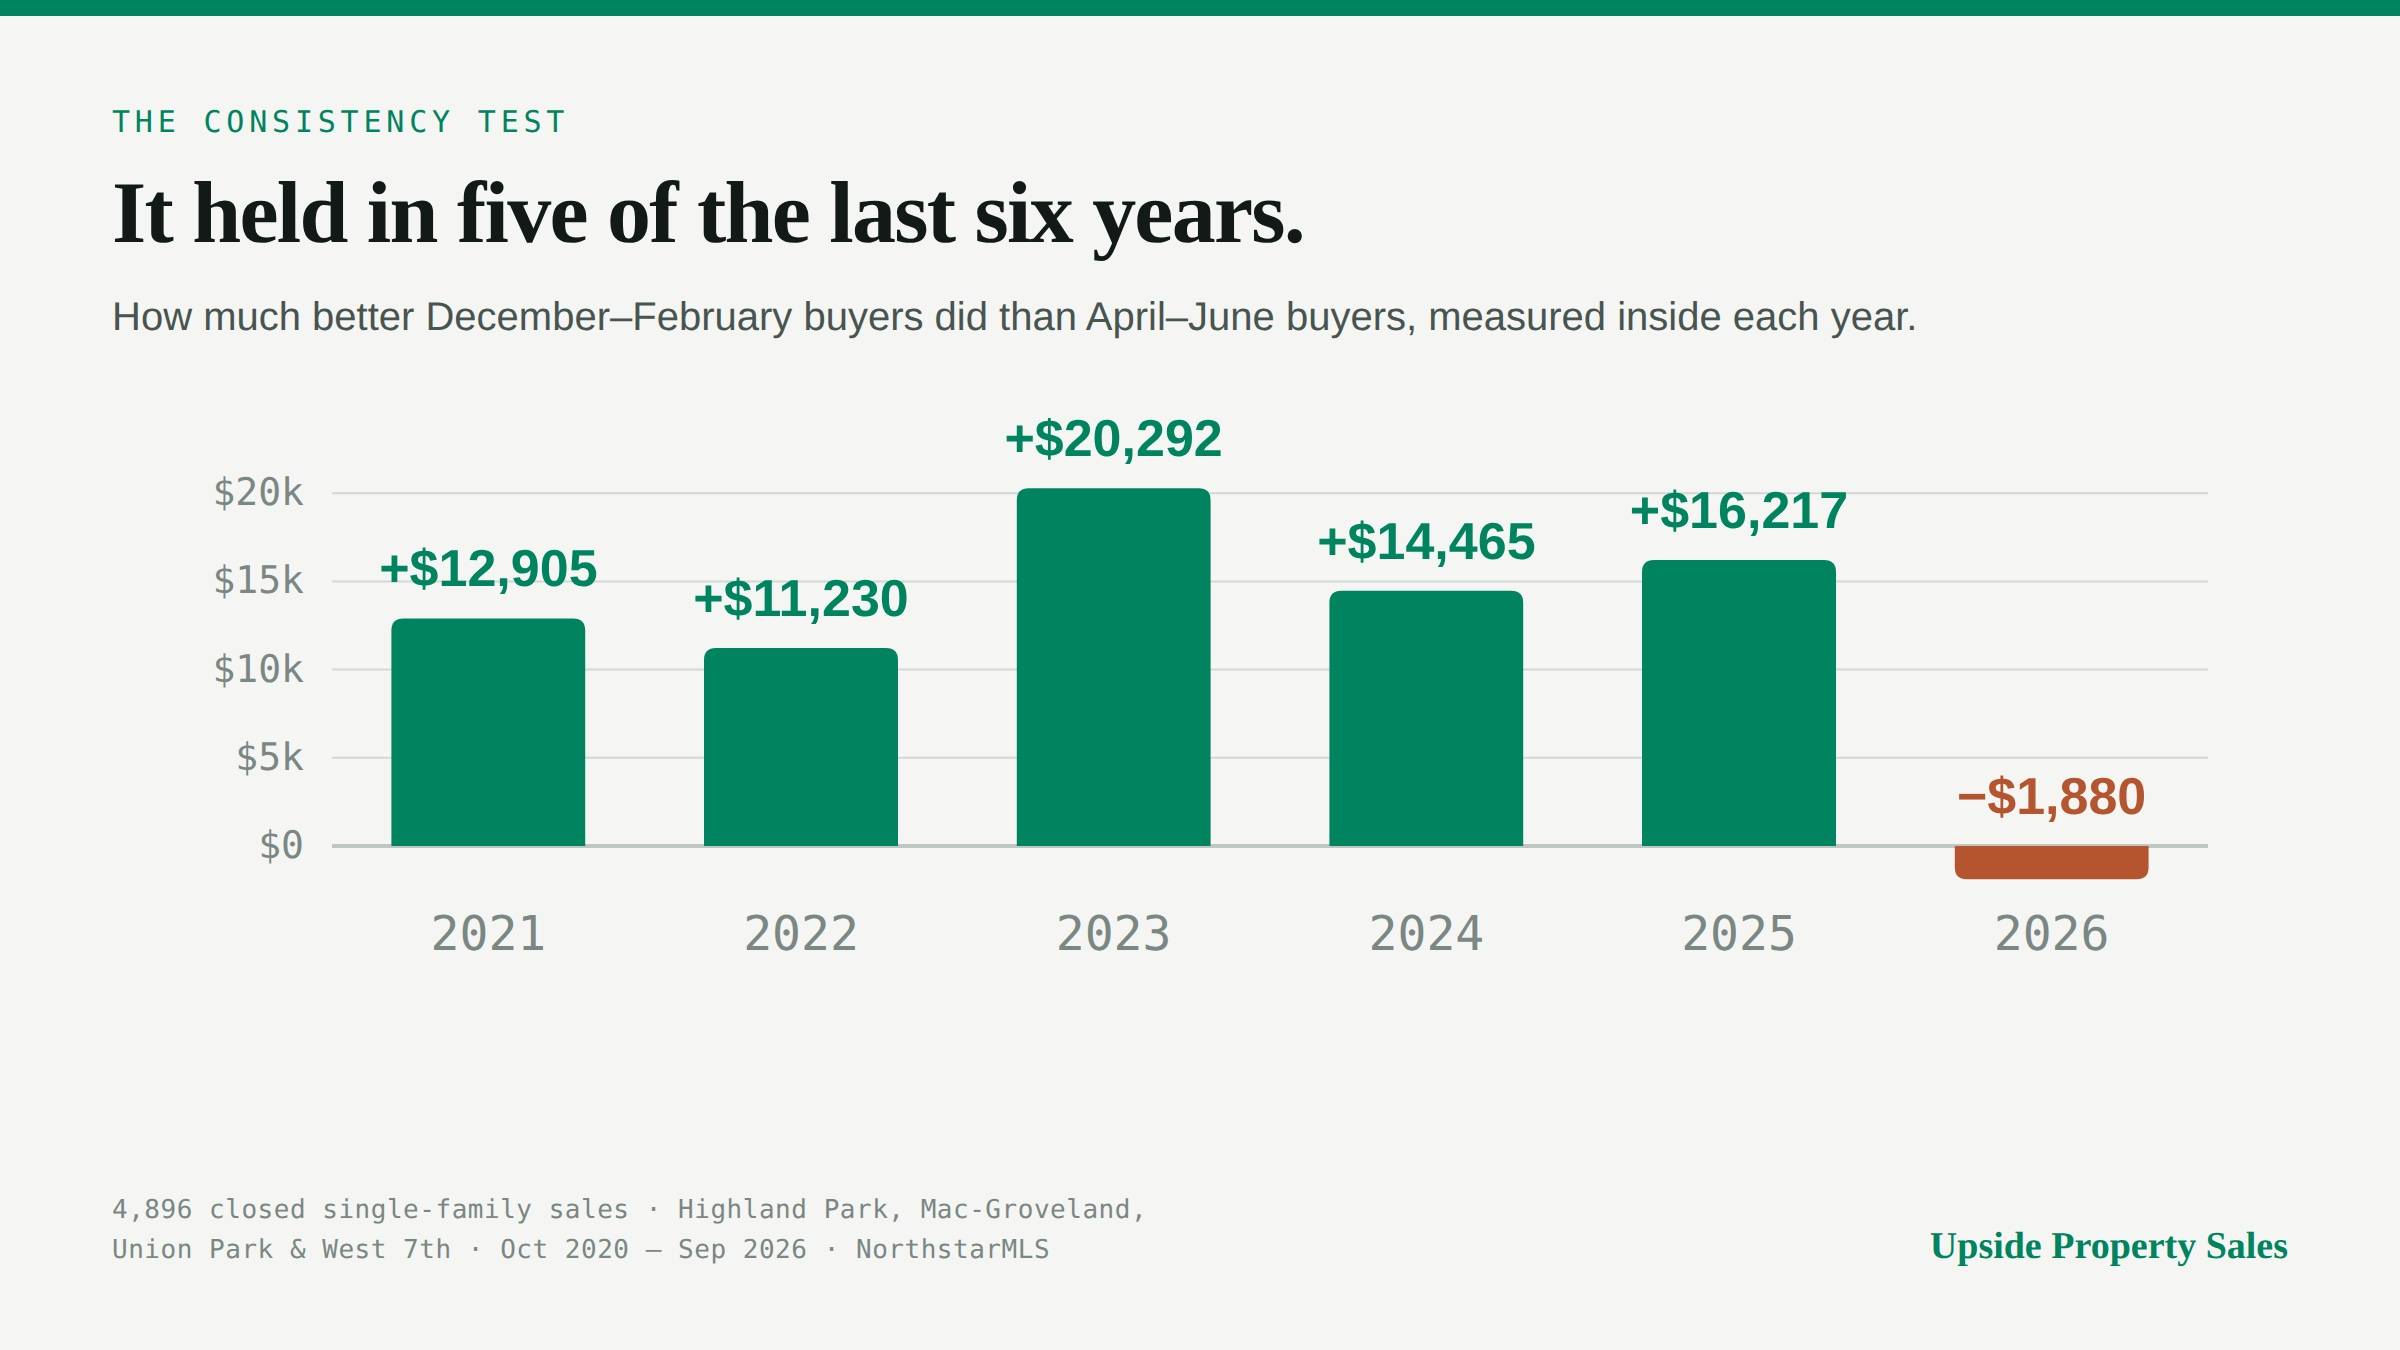
Adam — this is good work, but I think there’s an even more interesting result hiding underneath it.
I would make one important distinction before calling the $32,503 a seasonal “buyer advantage.”
Right now you’ve demonstrated a monthly difference in transaction outcomes.
You haven’t quite demonstrated a $32,503 constant-quality seasonal discount yet.
Those are different claims.
If this were my dataset, I’d take it one more layer down.
First, freeze the primary sample at August 31. September is still incomplete. Then keep 2026 as a holdout year because the fact that it’s already behaving differently is actually useful — it gives you a live test of whether the relationship generalizes.
Then I’d separate three things that are currently bundled together:
1. Seller repricing
Original list price → final list price.
2. Buyer negotiation
Final list price → contract/sale price.
3. Market selection
Which houses and sellers are actually transacting in December versus April.
That decomposition matters.
If a house starts at $500K, gets reduced to $470K after 35 days, and sells for $465K, the buyer did not negotiate a $35K discount. The market forced $30K of repricing before the buyer ever arrived, and the buyer negotiated the final $5K.
Both are valuable to the buyer, but they are different mechanisms.
Then I’d normalize the property mix.
At minimum:
neighborhood
year
square footage
beds/baths
lot size
age
garage
condition/renovation where available
price tier
And I wouldn’t use fixed nominal price buckets like $650K across six years. A $650K house occupied a different part of the market in 2021 than it does in 2026. I’d use inflation-adjusted thresholds or, even better, price percentiles within each year.
Then run the seasonal model twice.
Model A: Total seasonal effect
Do NOT control for days on market or price reductions.
That tells you what advantage a buyer actually experiences by entering the market in December rather than April.
Model B: Mechanism
Now add days on market, prior reductions and inventory conditions.
If the December effect collapses, you’ve identified the mechanism: winter doesn’t magically make houses cheaper — it creates stale inventory and motivated sellers, which creates negotiating leverage.
That is a much stronger finding.
I’d also track:
probability of selling below final ask
probability of a pre-contract price reduction
sale/final-list ratio
sale/original-list ratio
median cumulative DOM
seller concessions if MLS data has them
withdrawn/expired listings if you can get them
That last one matters because looking only at completed sales creates survivor bias. Some sellers simply refuse to transact when the market gets thin.
And then put confidence intervals around the monthly effects.
At that point the headline becomes something much stronger than:
“December buyers saved $32,503.”
It becomes:
“After holding property quality, neighborhood and market regime constant, buying in December changed a buyer’s probability of purchasing below asking by X points and reduced the expected acquisition price by Y%, with Z% of that advantage explained by stale inventory and seller repricing.”
Now you don’t just have an interesting seasonal chart.
You have a market-timing model.
And I suspect your 36-day-versus-6-day observation is actually the most valuable thing in the entire dataset. The month may not be the signal.
Seller fatigue may be the signal.
If that holds, the practical strategy isn’t merely “buy in December.”
It’s:
Find listings carrying December-type seller leverage regardless of what month the calendar says it is.
That would be the finding I’d chase.