My funnel killed 69 of 70 Memphis ZIPs. A 22-year operator graded every call.

My funnel killed 69 of 70 Memphis ZIPs. A 22-year operator graded every call.

Haseeb DurraniPro Member
Investor · Arlington, NY · Member since 2026 · 44 posts · 19 votes

Three weeks ago I posted the funnel I use to narrow 22,000 ZIP codes down to five worth researching. A few days later I got a DM from James Jones, a Memphis operator: 22 years, a few hundred doors, heavy Section 8, runs his own crews and management. He offered something no screen can produce: run your funnel on my market, show me where every ZIP dies, and I’ll grade your calls against what I know from owning here.

So I did. Full disclosure: we compared notes over DM first, and I’m posting the exchange with his permission because it’s the most useful version of something I keep saying: the screen gets you to the door, locals open it. James is in the replies.

The funnel on Memphis

Same thresholds as the original post, applied to the 70 scored ZIPs in the Memphis metro (TN-MS-AR).

Screen 1 (population 10K+, price $80K to $250K) kills 50. About thirty of them are the expensive suburbs over $250K, Germantown and Collierville country; the rest are the cheap core and the small towns. Screen 2 (yield 8%+) kills 10 more. Screen 3 (values up over 3 years, not down more than 2% over 1) kills 9, and they’re a contiguous cluster in the core. Screen 4 (vacancy and population growth) kills nobody.

One survivor: 38637 Horn Lake, MS. Yield 8.9%, three-year appreciation +2.1%, growing DeSoto County suburb. Two near-misses that clear everything but yield: 38671 Southaven at 7.6% and 38134 in NE Memphis at 6.7%.

The full ZIP-by-ZIP death table is at the bottom of this post.

His grade on the survivor

“38637 Horn Lake is a legitimate answer for exactly the audience your funnel serves - growing DeSoto County suburb, Mississippi’s landlord-friendly, property taxes run lighter than Memphis proper, and the tenant pool is stable working families.”

His caveats, which make it more useful, not less: at retail prices that 8.9% is honest but thin once you fund reserves properly, and voucher density is lower across the state line, so it’s a market-rate play with Section 8 as a bonus, not a Section 8 play. And on Southaven: real, but “it’s crossed into a homeowner’s market - you’re bidding against people who fall in love with kitchens. Fine for stability, wrong for yield.”

The $80K floor: an artifact doing accidental good work

I flagged to him that my price floor throws out the sub-$80K core, 38106 at $57K, 38108, 38114, 38126, for being cheap, not for anything the market did, and that this happens to remove the densest Section 8 territory in the metro. I called it an artifact and half expected him to tell me to drop it.

He told me to keep it: “38106, 38108, 38114, 38126 are precisely where the voucher spread is fattest AND where execution eats remote buyers alive - deep rehab stock, block-by-block variance, security during vacancy, contractors who smell out-of-state money. The floor removes the best spread zips for the wrong reason and protects your users for the right one.”

His label for that part of the map: operator territory. Those ZIPs are his business, and he has crews and 22 years of knowing which block. A remote buyer with a screener does not. If your funnel has a threshold like this, it’s worth knowing which side of it you’re on.

The falling-values cluster: where the index lies, and where it doesn’t

The screen 3 kills are a contiguous cluster of core ZIPs with falling three-year values, 38112 the worst at -15.2%. I asked him the question I can’t answer from a spreadsheet: is that decline real on the ground, or is the index misreading distressed, investor-heavy stock?

His answer was a mechanism first: “In those zips two different products trade under one median - unrenovated houses at $50-70/ft moving between investors and estates, and renovated product at $110-130/ft. When tired landlords exit in a wave (which is what the last 18 months were), the unrenovated pile dominates transactions and drags the index into a ‘decline’ the renovated product never experienced.”

Then a differentiated grade, ZIP by ZIP. 38112 is the headline artifact: that -15.2% is distressed-trade composition, not market truth, and renovated small multis near the Overton Park corridor rent and sell fine. 38122 is the second artifact, the Berclair/Highland split. 38111 is half-artifact: the University of Memphis side holds, the index blends it with blocks that don’t. 38118 sits in between: real softness, overstated print. And 38127 and 38109 are real: “investor churn there reflects actual operating difficulty; trust the index’s direction if not its magnitude.”

Notice what he did not do: tell me the index is wrong about his market. He confirmed two real declines in the core he operates in and separated them from the artifacts with a mechanism I can’t see in my data. That’s what credible ground truth looks like, and it’s also why I trust the artifact calls more than if he’d graded everything in his favor.

The sharpest question: is the voucher spread compensating for depreciation?

Quick background for anyone new to it: housing authorities pay Section 8 rents up to an administratively set payment standard, and in cheap ZIPs that number can sit well above what the open market pays. In Memphis's core, HUD's fair market rent runs 29 to 38% above observed market rent in ZIPs like 38116, 38106, and 38115. At voucher rents those ZIPs would clear my 8% yield floor easily. But all three fail the values screen: down over three years, or falling hard over one. So I asked him straight: is the voucher spread compensating for depreciation, or are you seeing appreciation the index can't?

“Mostly the first. Model those zips as bonds, not growth stocks. The voucher spread is a fat government-backed coupon on an asset whose face value drifts. Operators still win there… we don’t pay the index price - we buy from the distressed pile at 60-70% of even that declining median - and the coupon at voucher rents on a distressed basis runs well into double digits. But that’s a buy-price edge plus an operations edge, not appreciation.”

That’s a description of his game, not advice for yours. The point for a remote investor reading this: the same ZIP can be a good bond for a local operator with crews and a bad growth stock for you, and a yield screen can’t tell you which one you’d be buying.

One more catch worth stealing

38134 (Bartlett) clears my values screen on Zillow’s index. James pointed out that Redfin’s median sold price there is down double digits year over year with inventory up. Both can be true at once: a median-sold number is sensitive to what mix of houses traded, a hedonic index isn’t, and the honest read is a softening Bartlett with more small dated stock changing hands. Most tools, mine included, lean on one index. Before you buy in a ZIP, checking a second one is cheap insurance, and disagreement between them is information.

What I’m taking from this

The survivor held up under 22 years of scrutiny, with caveats that sharpen it. Differentiated grades beat blanket validation, and the fact that he confirmed real declines in his own backyard is exactly why I believe his artifact calls. Thresholds tuned for one audience quietly discard another audience’s whole market, so know which audience you are. And where a median hides two different products, the index drags: in distressed cores, trust direction over magnitude.

James is in the replies. Ask him the Memphis questions I can’t answer. And the offer from the original thread still stands, upgraded: name a metro and I’ll run the same funnel on it.

MEMPHIS TN-MS-AR FUNNEL: where each of 70 scored ZIPs dies (original post's thresholds)

S1 pop>=10K & price $80K-250K | S2 yield>=8% | S3 3yr>0 & 1yr>-2 | S4 vac<=10 & popgrowth>=0

ZIP

Place

Outcome

38106

Memphis, TN

died S1: price $57,039 (under $80K)

72331

Earle, AR

died S1: pop 2,316 + price $66,893

38108

Memphis, TN

died S1: price $70,295 (under $80K)

38114

Memphis, TN

died S1: price $74,233 (under $80K)

38126

Memphis, TN

died S1: pop 5,946 + price $76,398

38105

Memphis, TN

died S1: pop 5,534 (under 10K)

38676

Tunica, MS

died S1: pop 4,995 (under 10K)

38603

Ashland, MS

died S1: pop 2,530 (under 10K)

38659

Potts Camp, MS

died S1: pop 1,999 (under 10K)

38633

Hickory Flat, MS

died S1: pop 2,212 (under 10K)

38626

Dundee, MS

died S1: pop 1,237 (under 10K)

72348

Hughes, AR

died S1: pop 2,135 (under 10K)

38685

Waterford, MS

died S1: pop 1,301 (under 10K)

38642

Lamar, MS

died S1: pop 2,126 (under 10K)

38664

Robinsonville, MS

died S1: pop 3,465 (under 10K)

38049

Mason, TN

died S1: pop 3,957 (under 10K)

38015

Burlison, TN

died S1: pop 1,950 (under 10K)

38661

Red Banks, MS

died S1: pop 2,126 (under 10K)

38665

Sarah, MS

died S1: pop 3,514 (under 10K)

38618

Coldwater, MS

died S1: pop 9,866 (under 10K)

38104

Memphis, TN

died S1: price $254,665 (over $250K)

38680

Walls, MS

died S1: pop 6,839 + price $262,445

38117

Memphis, TN

died S1: price $269,353 (over $250K)

38011

Brighton, TN

died S1: pop 9,948 + price $273,482

38133

Memphis, TN

died S1: price $275,183 (over $250K)

38023

Drummonds, TN

died S1: pop 5,682 + price $275,710

38125

Memphis, TN

died S1: price $279,757 (over $250K)

38611

Byhalia, MS

died S1: price $280,389 (over $250K)

38058

Munford, TN

died S1: price $289,070 (over $250K)

38018

Cordova, TN

died S1: price $291,199 (over $250K)

38119

Memphis, TN

died S1: price $294,534 (over $250K)

38016

Cordova, TN

died S1: price $294,872 (over $250K)

38057

Moscow, TN

died S1: pop 3,563 + price $296,200

38135

Memphis, TN

died S1: price $301,003 (over $250K)

38068

Somerville, TN

died S1: price $303,788 (over $250K)

38103

Memphis, TN

died S1: price $321,396 (over $250K)

38641

Lake Cormorant, MS

died S1: pop 2,450 + price $329,854

38654

Olive Branch, MS

died S1: price $336,390 (over $250K)

38672

Southaven, MS

died S1: price $337,221 (over $250K)

38632

Hernando, MS

died S1: price $350,086 (over $250K)

38060

Oakland, TN

died S1: price $354,523 (over $250K)

38004

Atoka, TN

died S1: price $355,903 (over $250K)

38651

Nesbit, MS

died S1: pop 8,731 + price $361,940

38002

Arlington, TN

died S1: price $411,778 (over $250K)

38120

Memphis, TN

died S1: price $428,170 (over $250K)

38138

Germantown, TN

died S1: price $440,152 (over $250K)

38017

Collierville, TN

died S1: price $513,708 (over $250K)

38066

Rossville, TN

died S1: pop 3,446 + price $532,295

38139

Germantown, TN

died S1: price $596,741 (over $250K)

38028

Eads, TN

died S1: pop 7,992 + price $610,720

38053

Millington, TN

died S2: yield 7.8% (under 8%)

38115

Memphis, TN

died S2: yield 7.6% (under 8%)

38671

Southaven, MS

died S2: yield 7.6% (NEAR-MISS: clears every other gate)

38116

Memphis, TN

died S2: yield 7.0% (under 8%)

38134

Memphis, TN

died S2: yield 6.7% (NEAR-MISS: clears every other gate)

72301

West Memphis, AR

died S2: yield 6.6% (under 8%)

72364

Marion, AR

died S2: yield 5.1% (under 8%)

38635

Holly Springs, MS

died S2: yield 4.7% (under 8%)

38019

Covington, TN

died S2: yield 4.5% (under 8%)

38668

Senatobia, MS

died S2: yield 4.0% (under 8%)

38128

Memphis, TN

died S3: 3-yr -1.4% (values falling)

38118

Memphis, TN

died S3: 3-yr -3.3% (values falling)

38122

Memphis, TN

died S3: 3-yr -4.3%, 1-yr -3.6%

38141

Memphis, TN

died S3: 3-yr -4.6% (values falling)

38107

Memphis, TN

died S3: 3-yr -5.3%, 1-yr -4.3%

38109

Memphis, TN

died S3: 3-yr -5.6%, 1-yr -7.7%

38127

Memphis, TN

died S3: 3-yr -6.1%, 1-yr -6.8%

38111

Memphis, TN

died S3: 3-yr -8.8% (values falling)

38112

Memphis, TN

died S3: 3-yr -15.2%, 1-yr -10.4%

38637

Horn Lake, MS

SURVIVOR: cleared all 4 (yield 8.9%, 3-yr +2.1%, vac 8.3%)

3Reply
1,139 views

Most Popular Reply

James JonesPro Member
Investor · Collierville, TN 38017 · Member since 2017 · 589 posts · 445 votes
3w

Confirming my half of this exchange, and adding what didn't fit in Haseeb's write-up.

What made this worth my time - and I've turned down plenty of "can you validate my spreadsheet" asks: Haseeb never asked me to bless his output. He asked mechanism questions. Is this decline real or compositional? What's actually trading under that median? Which side of the split does the index see? Those questions have answers. "Is Memphis a good market" does not.

Two additions for anyone thinking about acting on this.

If Horn Lake caught your eye, the funnel's read is right, and here's the operator homework that goes with it: check DeSoto County property taxes against Memphis proper on any specific address - the gap is real and it's part of why the yield holds. Get the insurance quote BEFORE you underwrite, not after; Mississippi wind exposure surprises people. And take the "honest but thin at retail" caveat seriously - at full retail price with reserves funded properly, 8.9% gross becomes a fairly ordinary levered return. The number works much better if you buy right, which is true everywhere but decisive there.

And the two-products-under-one-median problem travels to every distressed-core metro in the country - Cleveland, St. Louis, Birmingham, Baltimore all have versions of it. You don't need me to test for it: pull the last 90 days of solds in the zip, sort by price per square foot, and look for a barbell - one pile at $50-70/ft, another at $110-130/ft, a valley between them. See the barbell, and the index is blending two different markets: trust its direction, not its magnitude. See one smooth hump, and the index means what it says.

The floor's open. Ask the Memphis questions a spreadsheet can't answer - block-level stuff, voucher mechanics, which of these zips I actually operate in and which I avoid despite the fat spread, why 38126's numbers look like 38106's but the streets don't. And if you're an operator in another metro: when Haseeb runs your market, do what I did for mine. Threads like this are only as good as the locals willing to get specific in public.

See this reply in the discussion

39 Replies

Jump to latestLatest
  • James JonesPro Member
    Investor · Collierville, TN 38017 · Member since 2017 · 589 posts · 445 votes
    3w

    Confirming my half of this exchange, and adding what didn't fit in Haseeb's write-up.

    What made this worth my time - and I've turned down plenty of "can you validate my spreadsheet" asks: Haseeb never asked me to bless his output. He asked mechanism questions. Is this decline real or compositional? What's actually trading under that median? Which side of the split does the index see? Those questions have answers. "Is Memphis a good market" does not.

    Two additions for anyone thinking about acting on this.

    If Horn Lake caught your eye, the funnel's read is right, and here's the operator homework that goes with it: check DeSoto County property taxes against Memphis proper on any specific address - the gap is real and it's part of why the yield holds. Get the insurance quote BEFORE you underwrite, not after; Mississippi wind exposure surprises people. And take the "honest but thin at retail" caveat seriously - at full retail price with reserves funded properly, 8.9% gross becomes a fairly ordinary levered return. The number works much better if you buy right, which is true everywhere but decisive there.

    And the two-products-under-one-median problem travels to every distressed-core metro in the country - Cleveland, St. Louis, Birmingham, Baltimore all have versions of it. You don't need me to test for it: pull the last 90 days of solds in the zip, sort by price per square foot, and look for a barbell - one pile at $50-70/ft, another at $110-130/ft, a valley between them. See the barbell, and the index is blending two different markets: trust its direction, not its magnitude. See one smooth hump, and the index means what it says.

    The floor's open. Ask the Memphis questions a spreadsheet can't answer - block-level stuff, voucher mechanics, which of these zips I actually operate in and which I avoid despite the fat spread, why 38126's numbers look like 38106's but the streets don't. And if you're an operator in another metro: when Haseeb runs your market, do what I did for mine. Threads like this are only as good as the locals willing to get specific in public.

  • Haseeb DurraniPro Member
    OP
    Investor · Arlington, NY · Member since 2026 · 44 posts · 19 votes
    3w

    Thanks @James Jones, the barbell test alone is worth the thread. Worth being explicit about why: my index literally cannot see the barbell. It's one number per ZIP. Ninety days of solds sorted by price per square foot is the check a spreadsheet can't run, and it's exactly what I'd do before trusting my kind of number in any distressed-core metro, not just Memphis.

    And the offer from the post stands: name a metro in the replies and I'll run the same funnel on it, same thresholds, same death table. If you operate in that metro, grade the output like James did. That's the version of this that's actually useful.

  • James JonesPro Member
    Investor · Collierville, TN 38017 · Member since 2017 · 589 posts · 445 votes
    3w

    Haseeb's offer in the post is the valuable part and it's sitting there unclaimed, so let me make it easy to claim: I'll go first and put predictions on the board for four metros I don't operate in. If you're local to one, tell me I'm wrong. That's the whole game.

    Detroit: I'd bet the barbell is the widest in the country there - a deep unrenovated pile trading between investors and estates, and a renovated pile selling to owner-occupants, blended into one median that describes neither. Prediction: the index reads worse than the renovated product actually performs, and the gap is bigger than Memphis's.

    Cleveland east side: barbell present but narrower, because voucher-heavy rentals trade on income rather than condition. Prediction: the falling-value print is more real than Detroit's, and the operators there are buying for yield anyway so they don't care.

    St. Louis: I'd expect the split to run north/south more than by condition - a geography barbell rather than a renovation barbell, which would show up as two clusters at similar price-per-foot in different halves of the same zip.

    Indianapolis: I'd actually predict the LEAST barbell of the four. More consistent stock, more owner-occupant depth, and a housing authority that pays above the published standard - which pulls renovated and unrenovated rents closer together than they'd otherwise be.

    I could be wrong on all four, and that's the point - these are falsifiable in about twenty minutes with the 90-day price-per-foot check.

    @Drew Sygit, you've argued Detroit specifics with me more than once and you'd know that market's composition better than anyone here. Does the barbell match what you see on the ground?

    @Harvey Levin, you placed your first Section 8 tenant in 1985 and had 600 Indy tenants at peak - is my Indy prediction naive, and does IHA paying above the published standard actually compress the two piles the way I think it does?

    Name your metro in this thread and Haseeb will run the same funnel on it. The only thing that makes the output worth anything is a local willing to grade it in public, which is exactly what I did for mine - including confirming the two declines that are real in my own backyard.

    • Drew SygitBusiness Member
      Property Manager · Royal Oak, MI · Member since 2012 · 12k+ posts · 9k+ votes
      3w

      Detroit is way more fragmented than any OOS typically understands.
      As you mentioned about Memphis, it really is "block-by-block".

      It's our OPINON an OOS investor has a high chance of losing a significant portion of their investment if they buy using Zip Codes in the City of Detroit - but, they can use them in the suburbs.

      We've gone the extra proverbial mile and analyzed the City or Detroit's 178 residential Neighborhoods and ranked them as Class A, B, C or D.

      Really don't have a barbell situation here.

      1/3 of the city is Class D

      1/3 is Class C

      1/3 is mix of Class B & A.

    • Haseeb DurraniPro Member
      OP
      Investor · Arlington, NY · Member since 2026 · 44 posts · 19 votes
      1w

      Thanks for weighing in, @Drew Sygit, and your rule lines up with the table better than I expected. ZIPs in the suburbs, not the city, is exactly what the funnel did without knowing it: six survivors, all inner ring, not one city ZIP. The city ZIPs died at three different points, price floor, then values, then vacancy, which doesn't argue with your thirds. That's also the line I'd draw for my own numbers anywhere, not just Detroit: they point at where to look, not what to pay.

      On the barbell, I'm not going to referee it from ZIP data, because ZIP data can't see neighborhoods or who's buying. My guess is you and James are measuring different things. Yours is where the neighborhoods sit, his is what sells inside one, and a Class C block can still have renovated and unrenovated selling as two different products. Could be both are true, and I can't test either from here.

      Your 178 neighborhood map is the layer this thread keeps asking for. Two questions if you're willing. Do the six suburban survivors line up with where you'd actually send an out of state buyer? And of the city ZIPs in the table, which are mostly one class and which are a mix? A ZIP number means something in a ZIP that's all one thing and nothing in one that's a third of each.

  • Haseeb DurraniPro Member
    OP
    Investor · Arlington, NY · Member since 2026 · 44 posts · 19 votes
    3w

    Offer's live, and to make it concrete: first metro named in this thread gets its death table within a day, same thresholds, same format as the Memphis one above. James's four predictions are exactly the kind I can't test from my desk. My index sees one number per ZIP, which is the whole reason the 90-day price-per-foot check belongs to whoever's on the ground. Floor's open.

    • Jay HinrichsBusiness Member
      Real Estate Consultant · Summerlin, NV · Member since 2014 · 45k+ posts · 66k+ votes
      3w

      Biggest take away inner core is operator territory extremely risky for out of state. And its not tired landlord its landlords that are burnt out tired of losing money every month tired of having their houses trashed tired of condenser units getting stolen tired of their house getting stripped between tenants its not just they are tired and dont like being landlord the drama and money losses are real. it takes someone like James who is local has 100s of doors a crew etc etc thats the only folks that really make this work in the inner section 8 core of really any of these heavy duty section 8 areas regardless of city or state.

    • Haseeb DurraniPro Member
      OP
      Investor · Arlington, NY · Member since 2026 · 44 posts · 19 votes
      3w

      @Jay Hinrichs, that distinction matters. "Tired" undersells it, and burnt out from real monthly losses is also exactly what feeds the index effect James described: capitulation selling concentrates in the roughest stock, so the median prints freefall while renovated product trades in a different world. None of which helps an out-of-state buyer, because condenser theft and between-tenant stripping don't show up in any dataset I can build. That's why the floor stays in the funnel and why "operator territory" is the honest label. Appreciate you weighing in.

  • Josh HandlerPro Member
    Contractor · Memphis, TN · Member since 2026 · 54 posts · 59 votes
    3w

    Disclosure first so nobody thinks Memphis is speaking twice here: James and I are part of the same ownership group in town. He's the operator side, I'm the construction side. Count us as one voice, not two.

    What I can add is the reason the barbell exists, because it's a construction fact more than a market fact.

    Moving a house from the $50-70 per foot pile to the $110-130 pile costs about the same in 38112 as it does in 38134. Same roof, same panel, same repipe on a pre-1965 house, same HVAC, same cabinets. Labor and material don't know what ZIP they're in. So the gap between the two piles isn't a spread that arbitrage closes over time. It's a fixed cost sitting between them, and it stays roughly constant while the ARV on the top side moves with the neighborhood.

    That's what makes the cheap core operator territory in a way a spreadsheet can't show. In a ZIP where the renovated comp supports the work, the two piles converge because it's rational for somebody to spend the money. In a ZIP where the renovated comp caps out below cost, nobody closes the gap, so the unrenovated pile just keeps trading between investors and estates at whatever it trades at, forever. The barbell isn't a temporary distortion there. It's the equilibrium.

    Practical version of that for anyone reading this from out of state: before you buy in one of these ZIPs, don't just look at the median. Pull the highest renovated sale on that street in the last year, and ask whether the work to get there costs less than the gap between it and your purchase price. In some of these ZIPs the answer is a comfortable yes and in some it's a no that no amount of good project management fixes. That check takes twenty minutes and it's the same twenty minutes as Haseeb's price-per-foot barbell test, just run from the cost side instead of the price side.

    Jay's point about the burned-out landlords is the part people skim past. Condensers get stolen out of vacant houses here. Copper gets pulled. That isn't a maintenance line item, it's a reason the vacancy math in those ZIPs is different from everywhere else, and it's a big part of why remote ownership there goes badly even when the yield screen said yes.

    • Haseeb DurraniPro Member
      OP
      Investor · Arlington, NY · Member since 2026 · 44 posts · 19 votes
      3w

      @Josh Handler, appreciate the disclosure, and even more the explanation. "The barbell is the equilibrium" is the cleanest line in this thread: a fixed renovation cost sitting under a moving ARV ceiling explains why James's two piles never converge in some ZIPs no matter what the yield math promises. Your cost-side check and James's price-per-foot test upthread are the same twenty minutes run from opposite directions, and between them they cover exactly what my funnel can't. A spreadsheet can see the gap between the piles; it has no idea whether the gap is closable, because whether the renovated comp supports the work is a street-level fact.

      By my count the thread has now named two things ZIP-level data structurally can't see: whether the gap closes (yours and James's test), and what vacancy actually costs when the condensers walk (Jay's point). That's the honest limit of screening, and it's why the funnel's job ends at the door.

    • Jay HinrichsBusiness Member
      Real Estate Consultant · Summerlin, NV · Member since 2014 · 45k+ posts · 66k+ votes
      3w

      I had 200 doors in south Jackson and Jackson proper of section 8 and boy it was 2 steps forward and 1 back I sold out after bout 20 months just could not handle the calls of our house getting hit/stripped.. or driving up to a home and they jacked the power by using a coat hanger to plug into the meter base or going around the water meter with a hose and water leaking and running down the street.. A lot of these things are just how things are done or how they live for many of us not raised there and not exposed to this is pretty mind boggling.. I just cant see how a one of investors can make that work or why they would risk it.. its not only the cash but its their credit just like what is talked about the rehabbed home is worth 100 a foot or more thats where many investors come into this paying those numbers.. and the fixers and burnt out landlord homes sell for 50 a foot they lose half the value after a few years.. And so not only lose thier cash but have to write a check to save their fico IF they can.. my advice is to leave these areas to the LOCAL PROS who can make it work and the Juice they get from these type of investments is worth the squeeze.. By the way the guys who bought me out on the 200 homes ended up losing the whole portfolio within another 24 months just ran out of money to keep them up.. negative cash flow and such killed them and they handed them back to the banks .One of my finest days when they wrote a check to get rid of me :)

    • Haseeb DurraniPro Member
      OP
      Investor · Arlington, NY · Member since 2026 · 44 posts · 19 votes
      3w

      @Jay Hinrichs, that last part closes the loop. The guys who bought you out weren't dumb money, they were just the next round of inputs. Someone pays renovated-comp prices, operations grind them down, they capitulate, and their fire-sale exits become the $50/ft pile that wrecks the median for the next guy's spreadsheet. Out-of-state money paying $100 a foot is literally what feeds the machine.

      And add "the check you write at exit to save your FICO" to the list of numbers no dataset shows. Honestly, your 20 months makes the case for my price floor better than anything in my death table. The funnel's only real job is keeping people from becoming an input.

    • Jay HinrichsBusiness Member
      Real Estate Consultant · Summerlin, NV · Member since 2014 · 45k+ posts · 66k+ votes
      3w

      not to mention the investor is going to have recapture and Owe Uncle sam a chunk as well.. again these assets are best handled by the local pro's who can check on a property with 30 minutes notice.. or when the tenant moves out their team is there removing the condenser same day and storing it before new tenant moves in.. that type of thing. Vacant home can have all components stripped in one night. :)

      I bought a foreclosure is a NICE part of Atlanta back in the day and when we went to run on the power the bad guys got into the roof and just pulled all the copper out so the face plates looked fine just no wires behind them.

    • Haseeb DurraniPro Member
      OP
      Investor · Arlington, NY · Member since 2026 · 44 posts · 19 votes
      3w

      That Atlanta story is basically a yield trap in physical form. Everything visible checks out, the wiring behind it is already gone. And good point on recapture, one more cost on the way out that nobody models going in.

    • Jay HinrichsBusiness Member
      Real Estate Consultant · Summerlin, NV · Member since 2014 · 45k+ posts · 66k+ votes
      3w

      to be fair that was a courthouse steps with no interior inspection I bought 55 homes on the court house steps in 2012 2013 until the hedge funds came in and out bid everyone.. U win some you lose some nature of the game..

  • Real Estate Investor · Memphis, TN · Member since 2016 · 402 posts · 129 votes
    3w

    @Haseeb Durrani

    From a data analyst perspective, great analysis. Hard constraints and 3 filters to trim the fat. The point made about "type of inventory" is could be negatively attributed to areas like 38106, 38108 in the first round and 38107 in the 3rd round. New construction in those zip codes is on the rise. I will not attempt to calculate "outlier" data to support that claim but the acquisition of the land is typical 3-15k, 20k max.

    NOTE:

    There is such an heavy Institutional presence in memphis, I have heard/seen funds dumping properties under market value driving down the median price in those areas, as those properties are reabsorbed into the market.

    While the returns are not the benchmark you are looking to achieve, 38107 has the widest gap between the top and bottom of the submarket. @James Jones and @Josh Handler are the type of players you need to have if you are investing from long range. Even if you are in the "Hot Zip Codes" understanding the market from a ground level speaks volumes vs comping the property and nerding out on excel.

    I think one constraint you should add is Average Days on Market change year over year.

    • Haseeb DurraniPro Member
      OP
      Investor · Arlington, NY · Member since 2026 · 44 posts · 19 votes
      3w

      @Jamie Parker That's a third way the median lies. James's version was renovated vs unrenovated resales under one number. Yours is new construction hitting that same median off $3-15k land. And funds dumping below market is Jay's exit wave at fund scale. None of that is visible from my desk.

      The 38107 call is interesting because James skipped that one. Widest gap top to bottom is the barbell signature, and it's testable. If you can pull 90 days of solds there with price and square footage, we can run the price-per-foot check right in the thread and see how wide it actually is. Would be the first contested ZIP to get the real test.


      Fair point on days on market too. I kept the funnel to prices, rents, and census on purpose, free data anyone can replicate. Demand speed is the natural next filter and you're right that change matters more than level. Guilty as charged on the excel nerding.

    • Real Estate Investor · Memphis, TN · Member since 2016 · 402 posts · 129 votes
      3w

      @Haseeb Durrani

      As a fellow data junkie, I have an MBA in Business Analytics and greatly appreciate your methodology in looking for Hot Zip Codes. Being an excel enthusiast, I would like to know what happens if other constraints are added. I would be curious to see what drops off depending were Average Days on Market is filtered [ie <60, 90, 120 days ] Starting with days on market as a the first step versus the last step, to see the velocity of transactions before assessing the quality of transactions.

      I am not sure how to access 90 days of solds data for delivery. I dont have MLS access. I point to 38107 not because I "know" the area in great detail, However I know that 38107 cuts through Breedlove and New Chicago with uptown and Vollintine-Evergreen on either side.

      Vollintine and Uptown doesn't make an investment a definite "go", However investors that would consider those areas, they will further refine each side of that zip code. Exact location versus Generalized location to get an apples to apples comparison.

    • Haseeb DurraniPro Member
      OP
      Investor · Arlington, NY · Member since 2026 · 44 posts · 19 votes
      3w

      Now you're speaking my language. Two honest answers on the ordering question.


      The boring one first: if every filter has to pass, order doesn't change who survives. The intersection is the intersection. What order changes is the story, which screen gets credit for each kill. Run DOM first and you learn how many ZIPs fail on pure velocity before quality even gets asked. Good diagnostics.


      The practical one: I left DOM out because I kept the funnel to two free sources anyone can replicate, Zillow and census. But realtor.com's research page publishes median days on market by ZIP monthly, free download, so your experiment is runnable. I'll run the DOM-first variant on the Memphis 70 at your three cutoffs and post what velocity alone kills. Curious myself whether it pre-kills the same core or catches something the price screens miss.


      And your 38107 geography point is the artifact thesis in one ZIP. Four neighborhoods, one median, describing none of them. No MLS access needed on your end. If anyone reading this has it, 90 days of 38107 solds with price and square footage is one export, and the price-per-foot test runs right here in the thread.

    • Real Estate Investor · Memphis, TN · Member since 2016 · 402 posts · 129 votes
      3w

      I just remembered I have the Reventure App. its actually good for this kinda stuff. Its more of a presentation side

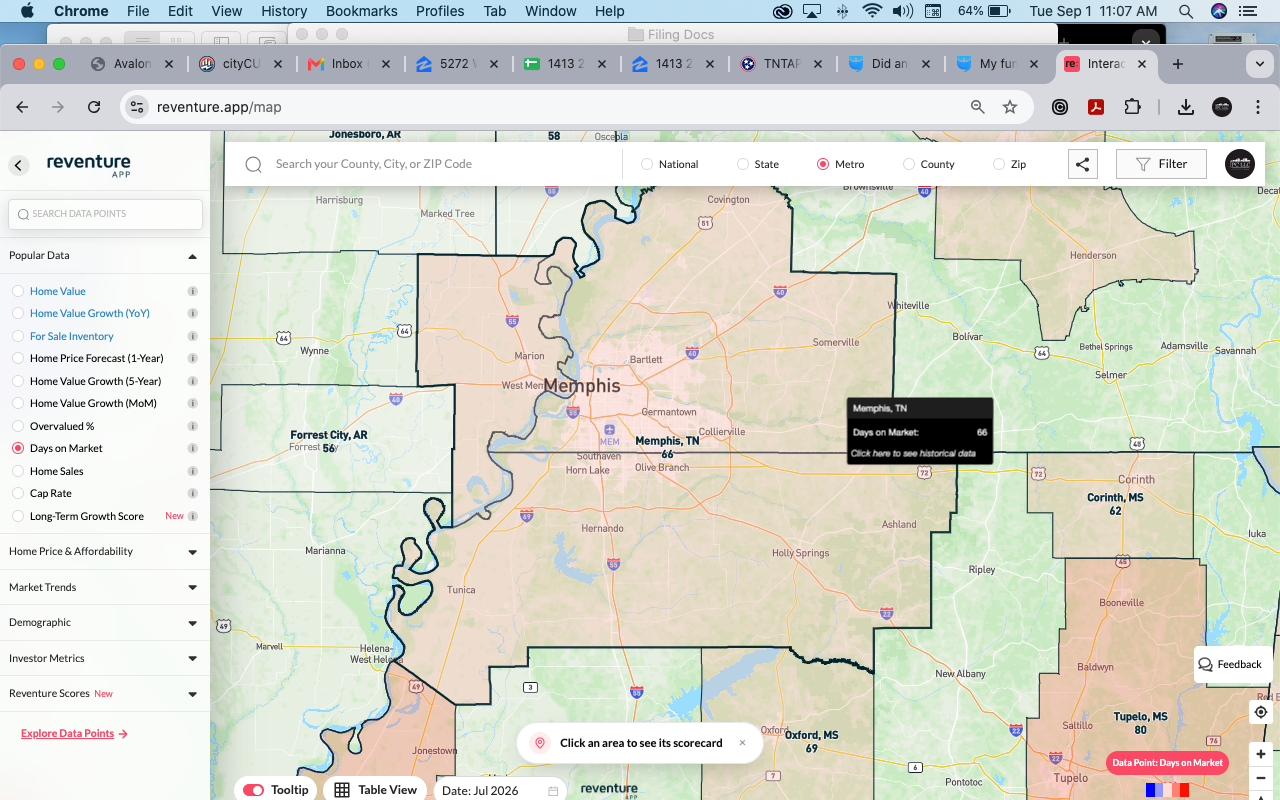
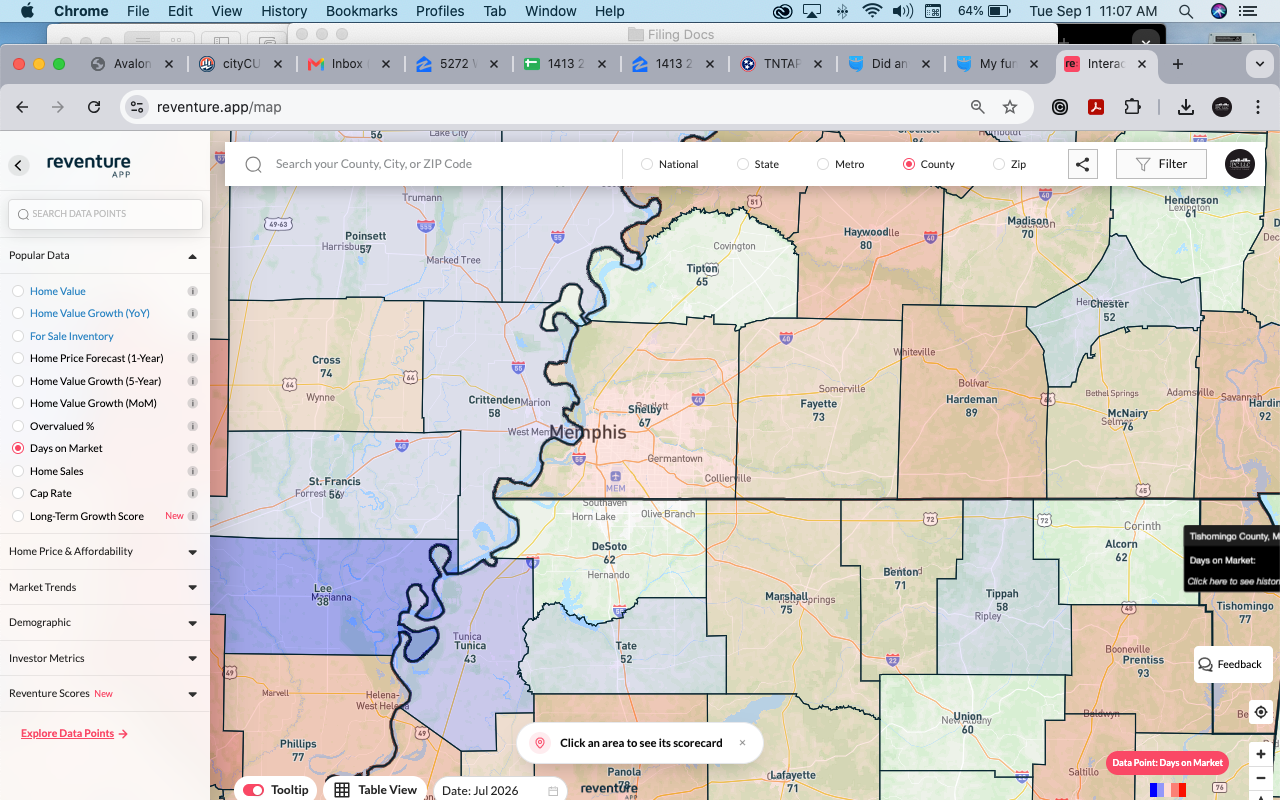
      Average Days on market for The Memphis MSA is 66 days

      Average DOM for Shelby County is 67, Desoto County is 62. Crittenden County AR is Actually lower than Both MS/ TN with 58

      38107 is 72, which puts it above the average . When compared to areas in blue,. The desirability obvious. With 38126 being 1 of 2 Urban zip codes being at or below the MSA's Average.

      • ***the app doesn't allow me to compare across the state lines.

    • Haseeb DurraniPro Member
      OP
      Investor · Arlington, NY · Member since 2026 · 44 posts · 19 votes
      3w

      Good timing, this landed while I was mid-writeup, so the experiment numbers went in without yours to check against. They line up well. Your MSA average of 60 against about 65 median across our 70, different app, different stat, same neighborhood. One honest caveat before calling that corroboration: if your app's DOM ultimately traces to the same Realtor feed this file does, agreement is the minimum, not a victory. Direction still counts.


      The Crittenden number is the fun one. Your app has it fastest of the three core counties at 58. The ZIP-level file (Realtor.com Economic Research, same one as above) has the slowest ZIP in the entire metro inside that county: Earle, 190 days. Re-verifying for this reply turned up 190 for Earle rather than the 180 upthread, so I've corrected the post. Both of our numbers are true at once, and the anatomy is worth spelling out. Eight ZIPs in the file touch Crittenden:


      West Memphis: 65 DOM, 85 active

      Marion: 43 DOM, 59 active

      Hughes: 124 DOM, 19 active (straddles into St. Francis County, so charge this one to Crittenden loosely)

      Crawfordsville: 20 DOM, 2 active

      Proctor: 124 DOM, 5 active

      Gilmore: 72 DOM, 1 active

      Edmondson: 5 DOM, 1 active

      Earle: 190 DOM, 5 active


      West Memphis and Marion hold 81 percent of the county's inventory between them, and Marion at 43 is what pulls the county average under West Memphis's own 65. That is your 58: two towns with real volume, one of them quick. The other six ZIPs hold 33 listings combined, five of them in single digits, so they cannot move the number no matter how slow they sit. Earle's 190 is the median of exactly five listings. Hold the magnitude loosely, but the direction is real: houses there sit.


      So that is now three zoom levels in one thread where one number hides two markets. James found it inside ZIPs with the barbell. You found it inside 38107 with four neighborhoods on one median. And the county layer, which is the first thing most out of state buyers look at, does the same trick with a straight face.


      Your 38126 read checks out here too: 55 days in July on 10 actives, under your 60 MSA average and under our metro median.


      And noted on the state line limit in the app. The seam is where the interesting stuff sits. Crittenden being exhibit A.

    • Haseeb DurraniPro Member
      OP
      Investor · Arlington, NY · Member since 2026 · 44 posts · 19 votes
      3w

      @Jamie Parker

      Ran your experiment. DOM first, three cutoffs, all 70 ZIPs. Short version: order doesn't change who survives, but it changes what you learn, and 90 is the setting where it teaches something.


      VELOCITY SCREEN ON THE MEMPHIS 70 (median days on market, applied FIRST)
      Current month, July 2026. Coverage 70 of 70.
      Memphis DOM spread: fastest 21 days, median 65, slowest 190 (Earle AR).


      DOM <= 60 days
      kills 42 of 70 (28 survive)
      22 of those were already dead on the price screens (pure overlap, no new information)
      20 die on velocity alone, but 8 of them the size screen already kills
      net new signal: 12 ZIPs that had cleared size AND price still fail on speed
      38122 (106), 38019 Covington (105), 38112 (98), 38635 Holly Springs (94), 38115 (94), 38111 (78), 38109 (76), 38107 (72), 38127 (67), 38116 (65), 72301 West Memphis (65), 38128 (62)


      DOM <= 90 days
      kills 11 of 70 (59 survive)
      4 overlap with price kills: 72331 Earle (190), 38108 (111), 38028 Eads (97), 38066 Rossville (95)
      7 die on velocity alone
      net new signal: 5 ZIPs that had cleared size AND price
      38122 (106), 38019 Covington (105), 38112 (98), 38635 Holly Springs (94), 38115 (94)


      DOM <= 120 days
      kills 2 of 70 (68 survive)
      1 overlap with price kills: 72331 Earle (190)
      1 dies on velocity alone: 72348 Hughes AR (124), already dead on population
      net new signal: 0. At this cutoff the screen does nothing the other screens do not.


      SURVIVOR AND NEAR-MISSES: none die at any cutoff.
      38637 Horn Lake MS (survivor) DOM 40
      38671 Southaven MS (near-miss) DOM 48
      38134 Memphis TN (near-miss) DOM 58


      Market speed data: Realtor.com Economic Research.


      What I take from it: at 60 days it's a chainsaw, 42 of 70 dead and over half of that is re-killing ZIPs the price screens already removed. At 120 it does nothing. At 90 it gets interesting: five ZIPs that cleared size and price still fail on speed, and four of those five are ones the appreciation screen kills later anyway. So on this metro, velocity mostly front-runs the value screens rather than finding something they miss. Decent early-warning proxy, redundant filter.


      The exception is the fun one. 38019 Covington clears every price band, yields 4.5%, and sits at 105 days, the slowest non-Delta ZIP in the metro. My funnel kills it on yield, your screen kills it on speed, and those are two different diagnoses of the same patient. James, that one's yours: what does slow plus thin yield mean in Covington on the ground?


      Direct answer to your ordering question: the survivor and both near-misses sail under even the 60-day bar (40, 48, 58 days), so velocity doesn't change the funnel's answer on Memphis. It changes the autopsy, not the verdict.

    • Real Estate Investor · Memphis, TN · Member since 2016 · 402 posts · 129 votes
      3w

      Now the real conversation can start. Operational tolerance and the exit strategy.

      In a market with ADOM under 60, cosmetic fix and flips may be your go-to on a 6 month HML. Purchased rehabbed and sold in 3 -4 months close to close.

      When the ADOM is a 90 days a real conversation has to be had.

      1.) What can we do if when a 6 month loan matures? Should we go with a 12 month loan?

      2,) how much rehab is too much?

      120 days or more, fix and flips are done with intention vs haphazardly.

      in terms of general desired zips the 90 DOM areas present well in line with what I hear local investor’s preferences. 

    • Haseeb DurraniPro Member
      OP
      Investor · Arlington, NY · Member since 2026 · 44 posts · 19 votes
      3w

      This is the layer the experiment was missing. My cutoffs say where the funnel loses ZIPs. Your bands say what the number costs an operator in loan terms. Same column, two different jobs.

      Putting the 70 on your bands from the July file: 28 under 60, cosmetic flip territory by your framing. 31 in the 60 to 90 middle. 11 at 90 or above, that's the named list upthread. 2 clear 120, where you say flips only happen on purpose. Quick caveat before anyone leans on those counts: both tails of this file sit on single digit inventory (the 21 day fastest is a 2 listing ZIP, Earle's 190 is 5 listings), so the extremes are softer than the middle. Metro median is about 65, so the typical Memphis ZIP starts just past your first line.

      The math on your 90 day question is the part that got me: at that speed the market's sit time alone eats half a 6 month loan. Before rehab, before anything goes wrong. Close to close in 3-4 months assumes the sale window is short. At 90 it isn't.

      What to do about it is where my lane ends, so routing your two questions to the guys who've actually held the paper. James, question 1 is yours: 6 vs 12 months at 90 plus, and what the extra term costs in points and carry. Josh, question 2 sounds like your vintage list from earlier wearing a different hat. "How much rehab is too much" is basically "what does the vintage force you to touch." Curious if a slow market shrinks the scope you're willing to take on at all.

      One overlap somebody should check: if the 90 plus ZIPs also skew oldest stock, that's the corner where the exit clock, the rehab budget, and the index all get shaky at once. I can pull year built for all 70 from the census if anyone wants it, same source as the income data, so it's clean.

      Data says where each regime applies. What you do inside them is your side of the table.

    • Real Estate Investor · Memphis, TN · Member since 2016 · 402 posts · 129 votes
      3w

      @Haseeb Durrani

      Its been a pleasure crunching data with you. Creating a distribiutions to understand the significance is the language of statistical analysis, good stuff. The reason for the inverse order for DOM is because of the result it produced.

      38122 (106), 38019 Covington (105), 38112 (98), 38635 Holly Springs (94), 38115 (94), 38111 (78), 38109 (76), 38107 (72), 38127 (67), 38116 (65), 72301 West Memphis (65), 38128 (62)

      With the exception of Holly Springs and Covington, I know a local investor that like all of these zip codes with prejudice. If nothing else, they will at lease to a look or a serious consideration. This filters allows each individual investor to create their own Return benchmarks in a strongly desirable zip code.

      38637 Horn Lake MS (survivor) DOM 40
      38671 Southaven MS (near-miss) DOM 48
      38134 Memphis TN (near-miss) DOM 58

      Survivor Zip codes can be trouble, probably very competitive. Then at that point you have understand your Average cost per lead which turns into marketing cost to close. Now consider that an investor will source their own situation vs working with 4-5 of the major players in town, Midsouth HomeBuyers, REi Nation, Reedy and Co/Memphis Investment Properties, CrestCore Property Management or Foundation Property Management.

      Would you want to go up against these guys, every wholesaler and real estate agent in town and the investors in a zip code with (you didn't mention how many transactions are in 38134) on the TN side. Mississippi, has Hernando, Senatobia, Walls, Lake Cormorant and Byhalia that Mississippi investors my reach for over Desoto county solely.

      Negotiations can create more equity and better deals. However, in hot zip codes Low Ball Offers may get scoffed at unless there is a definite motivation. So your Return Benchmarks will may not be worth the cost to achieve that return in competition.

    • Haseeb DurraniPro Member
      OP
      Investor · Arlington, NY · Member since 2026 · 44 posts · 19 votes
      1w

      Likewise, this has been a lot of fun. And I think you're right, the slow list and the local's list are the same list. Speed is doing the same job in both directions, it just reads as a warning to someone buying from a distance and as an opening to someone who lives there.

      That's really what the funnel is for. It's built for the out of state buyer paying close to retail, so it's no surprise the ZIPs it clears are the crowded ones. The 69 kills were always the useful part. It has no way to see marketing cost, motivation, or what a good negotiator does to a price, and your list is exactly where those things matter. Same operator territory line James drew, just measured in days instead of dollars.

      On 38134 volume, I don't have closed sales (that's MLS or deed data) so I'd rather not guess. What the same Realtor.com Economic Research file does have is pending ratio, pending over active, which is a decent read on how fast things go under contract. July, same month as the experiment:

      38134: 57 active, 40 pending, ratio 0.70

      Horn Lake 38637: 44 active, 31 pending, ratio 0.71

      Southaven 38671: 82 active, 54 pending, ratio 0.65

      Your ten: 38122 0.16, 38107 0.18, 38109 0.23, 38112 0.27, 38111 0.27, 72301 0.27, 38127 0.28, 38128 0.42, 38116 0.46, 38115 0.47. Median 0.27 vs 0.70, with nothing between 0.47 and 0.65. Your list also has the inventory, 38127 alone has 230 actives to Horn Lake's 44. So your competition point shows up clearly in the public data. One note if you pull the file yourself: it only carries the current month, so you'll get August, and the gap holds there too (survivor side 0.54 to 0.73, your list 0.16 to 0.43).

      The Mississippi towns mostly fall out on price rather than size. Hernando, Byhalia, Walls and Lake Cormorant are all over the $250K ceiling ($262K to $350K), and Senatobia, the one that got a real test, came in at 4% yield. Nothing against the towns, the band just can't reach them. Which lines up with what you said, that's where a local with a bigger budget goes.

      Cost per lead and cost to close are outside what I can measure, so I'll leave that one with James, he's the one sourcing in these ZIPs.

  • Haseeb DurraniPro Member
    OP
    Investor · Arlington, NY · Member since 2026 · 44 posts · 19 votes
    2w

    Nobody claimed a metro, so I'm starting with the one James bet biggest on: Detroit, widest barbell in the country, index reading worse than the renovated product actually performs.

    Ran the same four screen funnel on all 208 scored ZIPs in the Detroit Warren Dearborn metro, the biggest I've run: size and price band first (population 10,000 or more, price $80K to $250K), then gross yield 8 percent or better, then values holding (3 year appreciation above zero and 1 year better than negative 2), then occupancy (vacancy 10 percent or under and population growth zero or better). Screen 1 removed 155 of 208, mostly on the $250K ceiling; the full breakdown is with the death table below. Yield took 13 more, appreciation 9, and then the occupancy screen took 25, the biggest occupancy toll of any metro I've run. Six ZIPs cleared all four, and every one of them is an inner ring suburb rather than a Detroit city ZIP.

    SURVIVORS (cleared all four screens, ranked by 3 year appreciation):
    48124 Dearborn, MI: price $242,960, rent $1,739 (zillow), yield 8.6%, 1yr +3.9%, 3yr +18.8%, vacancy 4.9%, pop 34,479 (+0.9%), median year built 1953, 2BR FMR $1,550
    48174 Romulus, MI: price $219,645, rent $1,522 (zillow), yield 8.3%, 1yr +2.5%, 3yr +13.5%, vacancy 7.8%, pop 32,211 (+1.3%), median year built 1975, 2BR FMR $1,340
    48081 Saint Clair Shores, MI: price $247,936, rent $1,710 (zillow), yield 8.3%, 1yr +3.6%, 3yr +12.7%, vacancy 4.5%, pop 20,530 (+1.4%), median year built 1957, 2BR FMR $1,460
    48093 Warren, MI: price $227,546, rent $1,746 (zillow), yield 9.2%, 1yr +0.8%, 3yr +10.4%, vacancy 3.5%, pop 25,014 (+2.2%), median year built 1967, 2BR FMR $1,330
    48071 Madison Heights, MI: price $222,801, rent $1,494 (zillow), yield 8.1%, 1yr -1.3%, 3yr +7.6%, vacancy 8.4%, pop 28,419 (+0.0%), median year built 1961, 2BR FMR $1,380
    48220 Ferndale, MI: price $249,209, rent $1,677 (zillow), yield 8.1%, 1yr -1.4%, 3yr +5.6%, vacancy 5.3%, pop 21,527 (+0.1%), median year built 1947, 2BR FMR $1,540

    NEAR MISSES (clear every gate but one, and miss that one by a small margin):
    Precision note: a few of these round to look like they should have passed. The funnel uses the unrounded value. Exact unrounded figures for the tightest misses are listed below.
    48091 Warren, MI: fails only occupancy (vacancy 10.0364% exactly, 0.04 pts short), yield 10.1%, 3yr +10.1%, vacancy 10.0%, median year built 1964
    48033 Southfield, MI: fails only yield (yield 7.9555% exactly, 0.04 pts short), yield 8.0%, 3yr +7.5%, vacancy 9.3%, median year built 1972
    48021 Eastpointe, MI: fails only occupancy (pop growth -0.1498% exactly, 0.15 pts short), yield 10.8%, 3yr +12.6%, vacancy 5.6%, median year built 1954
    48340 Pontiac, MI: fails only occupancy (pop growth -0.1498% exactly, 0.15 pts short), yield 10.9%, 3yr +17.9%, vacancy 8.7%, median year built 1966
    48125 Dearborn Heights, MI: fails only occupancy (pop growth -0.1498% exactly, 0.15 pts short), yield 11.4%, 3yr +17.3%, vacancy 5.7%, median year built 1955
    48126 Dearborn, MI: fails only occupancy (pop growth -0.1498% exactly, 0.15 pts short), yield 8.7%, 3yr +21.6%, vacancy 9.3%, median year built 1950
    48239 Redford, MI: fails only occupancy (pop growth -0.2%, 0.2 pts short), yield 10.5%, 3yr +11.8%, vacancy 4.1%, median year built 1955
    48066 Roseville, MI: fails only occupancy (pop growth -0.2%, 0.2 pts short), yield 8.7%, 3yr +10.7%, vacancy 4.3%, median year built 1961
    48122 Melvindale, MI: fails only occupancy (pop growth -0.4%, 0.4 pts short), yield 9.2%, 3yr +11.4%, vacancy 7.2%, median year built 1950
    48043 Mount Clemens, MI: fails only occupancy (pop growth -0.5%, 0.5 pts short), yield 8.4%, 3yr +13.5%, vacancy 5.4%, median year built 1955
    48184 Wayne, MI: fails only occupancy (pop growth -0.5%, 0.5 pts short), yield 8.6%, 3yr +11.4%, vacancy 8.7%, median year built 1958
    48180 Taylor, MI: fails only occupancy (pop growth -0.5%, 0.5 pts short), yield 9.9%, 3yr +13.0%, vacancy 4.9%, median year built 1963
    48240 Redford, MI: fails only occupancy (pop growth -0.5%, 0.5 pts short), yield 12.1%, 3yr +9.5%, vacancy 6.3%, median year built 1955
    48195 Southgate, MI: fails only occupancy (pop growth -0.6%, 0.6 pts short), yield 9.1%, 3yr +12.5%, vacancy 5.1%, median year built 1963
    48135 Garden City, MI: fails only occupancy (pop growth -0.6%, 0.6 pts short), yield 9.4%, 3yr +14.2%, vacancy 3.8%, median year built 1956
    48146 Lincoln Park, MI: fails only occupancy (pop growth -0.6%, 0.6 pts short), yield 10.7%, 3yr +12.3%, vacancy 4.3%, median year built 1954
    48341 Pontiac, MI: fails only occupancy (pop growth -0.7%, 0.7 pts short), yield 12.1%, 3yr +14.5%, vacancy 8.9%, median year built 1956
    48089 Warren, MI: fails only occupancy (pop growth -0.8%, 0.8 pts short), yield 12.0%, 3yr +10.4%, vacancy 8.1%, median year built 1962

    Three things stand out before the locals grade it.

    Not one Detroit city ZIP survives. All six survivors are inner ring suburbs: Dearborn, Romulus, St. Clair Shores, Warren, Madison Heights, Ferndale. Cleveland, which drops next unless someone claims a different metro first, splits the opposite way: three of its four survivors are city ZIPs. Whatever these two cities share, the funnel doesn't see them the same, and I'd love to hear why from someone who knows both.

    The Detroit signature is emptiness, and it comes in two flavors. Twenty five ZIPs cleared price, yield, and appreciation and then died on occupancy. But look at the near miss list: seventeen of the eighteen die there too, sixteen of them on population growth alone, all by less than a point. Detroit's inner ring is a wall of ZIPs the funnel calls "almost." Meanwhile the deep declines cluster in the city on the oldest stock: the three worst prints (48214 at -17%, 48202, 48206) all sit on median year built 1938, which is exactly where Josh's point upthread says the index deserves the least trust because renovation cost variance is widest. Consistent with James's two markets under one median story, and the spread between HUD's 2BR payment and market rent has the widest range I've seen in this series so far, 86.5 points end to end. What my data can't do is the actual barbell test. Ninety days of solds sorted by price per foot settles James's prediction one way or the other, and Detroit has locals who could pull that in twenty minutes.

    And the honest gap, before anyone finds it for me: the sub $80K core is only nine ZIPs, all Detroit city or Highland Park, stock built 1938 to 1951, and five of the nine have no rent figure in my data at all. Drop the price floor to reach Detroit's operator territory and those five would die on missing data, not market conditions. My coverage is thinnest exactly where the stock is oldest. Two independent reasons the same territory stays operator only.

    WHERE EACH ZIP DIES. This metro has 208 scored ZIPs, too many to paste in full, so below are the 53 that cleared the size and price screen and got a real market test. The 155 removed at Screen 1 break down as 136 over the $250K ceiling, 9 under the $80K
    floor and 54 under the 10,000 population floor (categories overlap). Full 208 row table available if anyone wants to know where theirs died.

    ZIP

    City

    Year built

    Result

    Note

    48033

    Southfield, MI

    1972

    Died S2: yield 7.96% (under 8%)

    NEAR MISS

    48092

    Warren, MI

    1967

    Died S2: yield 7.9% (under 8%)

    48192

    Wyandotte, MI

    1951

    Died S2: yield 7.9% (under 8%)

    48342

    Pontiac, MI

    1962

    Died S2: yield 7.8% (under 8%)

    48088

    Warren, MI

    1966

    Died S2: yield 7.8% (under 8%)

    48186

    Westland, MI

    1964

    Died S2: yield 7.5% (under 8%)

    48237

    Oak Park, MI

    1958

    Died S2: yield 7.5% (under 8%)

    48101

    Allen Park, MI

    1955

    Died S2: yield 7.3% (under 8%)

    48060

    Port Huron, MI

    1959

    Died S2: yield 6.8% (under 8%)

    48185

    Westland, MI

    1972

    Died S2: yield 6.7% (under 8%)

    48035

    Clinton Township, MI

    1970

    Died S2: yield 6.4% (under 8%)

    48082

    Saint Clair Shores, MI

    1958

    Died S2: yield 5.7% (under 8%)

    48026

    Fraser, MI

    1972

    Died S2: yield 3.5% (under 8%)

    48235

    Detroit, MI

    1953

    Died S3: 1-yr -2.3%

    48215

    Detroit, MI

    1950

    Died S3: 1-yr -9.2%

    48224

    Detroit, MI

    1945

    Died S3: 1-yr -6.5%

    48221

    Detroit, MI

    1944

    Died S3: 1-yr -5.0%

    48030

    Hazel Park, MI

    1955

    Died S3: 1-yr -4.4%

    48207

    Detroit, MI

    1967

    Died S3: 3-yr -5.9%; 1-yr -9.3%

    48206

    Detroit, MI

    1938

    Died S3: 3-yr -11.6%; 1-yr -13.2%

    48202

    Detroit, MI

    1938

    Died S3: 3-yr -12.1%; 1-yr -14.1%

    48214

    Detroit, MI

    1938

    Died S3: 3-yr -17.0%; 1-yr -16.3%

    48223

    Detroit, MI

    1951

    Died S4: vacancy 19.2%; pop growth -6.8%

    48212

    Hamtramck, MI

    1938

    Died S4: vacancy 18.9%

    48141

    Inkster, MI

    1957

    Died S4: vacancy 15.3%; pop growth -0.7%

    48209

    Detroit, MI

    1938

    Died S4: vacancy 15.1%; pop growth -1.3%

    48219

    Detroit, MI

    1954

    Died S4: vacancy 13.5%

    48075

    Southfield, MI

    1966

    Died S4: vacancy 10.1%; pop growth -1.4%

    48091

    Warren, MI

    1964

    Died S4: vacancy 10.04%

    NEAR MISS

    48126

    Dearborn, MI

    1950

    Died S4: pop growth -0.1%

    NEAR MISS

    48341

    Pontiac, MI

    1956

    Died S4: pop growth -0.7%

    NEAR MISS

    48184

    Wayne, MI

    1958

    Died S4: pop growth -0.5%

    NEAR MISS

    48340

    Pontiac, MI

    1966

    Died S4: pop growth -0.1%

    NEAR MISS

    48089

    Warren, MI

    1962

    Died S4: pop growth -0.8%

    NEAR MISS

    48122

    Melvindale, MI

    1950

    Died S4: pop growth -0.4%

    NEAR MISS

    48240

    Redford, MI

    1955

    Died S4: pop growth -0.5%

    NEAR MISS

    48225

    Harper Woods, MI

    1955

    Died S4: pop growth -1.4%

    48125

    Dearborn Heights, MI

    1955

    Died S4: pop growth -0.1%

    NEAR MISS

    48021

    Eastpointe, MI

    1954

    Died S4: pop growth -0.1%

    NEAR MISS

    48043

    Mount Clemens, MI

    1955

    Died S4: pop growth -0.5%

    NEAR MISS

    48195

    Southgate, MI

    1963

    Died S4: pop growth -0.6%

    NEAR MISS

    48180

    Taylor, MI

    1963

    Died S4: pop growth -0.5%

    NEAR MISS

    48146

    Lincoln Park, MI

    1954

    Died S4: pop growth -0.6%

    NEAR MISS

    48066

    Roseville, MI

    1961

    Died S4: pop growth -0.2%

    NEAR MISS

    48239

    Redford, MI

    1955

    Died S4: pop growth -0.2%

    NEAR MISS

    48135

    Garden City, MI

    1956

    Died S4: pop growth -0.6%

    NEAR MISS

    48080

    Saint Clair Shores, MI

    1958

    Died S4: pop growth -1.1%

    48071

    Madison Heights, MI

    1961

    Cleared all 4 (yield 8.1%, 3yr +7.6%)

    SURVIVOR

    48081

    Saint Clair Shores, MI

    1957

    Cleared all 4 (yield 8.3%, 3yr +12.7%)

    SURVIVOR

    48124

    Dearborn, MI

    1953

    Cleared all 4 (yield 8.6%, 3yr +18.8%)

    SURVIVOR

    48174

    Romulus, MI

    1975

    Cleared all 4 (yield 8.3%, 3yr +13.5%)

    SURVIVOR

    48220

    Ferndale, MI

    1947

    Cleared all 4 (yield 8.1%, 3yr +5.6%)

    SURVIVOR

    48093

    Warren, MI

    1967

    Cleared all 4 (yield 9.2%, 3yr +10.4%)

    SURVIVOR

    • Haseeb DurraniPro Member
      OP
      Investor · Arlington, NY · Member since 2026 · 44 posts · 19 votes
      1w

      One correction to the near miss list above, past the edit window so it lives here. Four ZIPs are printed with the same exact population growth figure. They're four distinct values that round alike: 48021 is -0.0618%, 48340 -0.1051%, 48125 -0.1399%, 48126 -0.1498%. Order and verdicts don't change.

    • Drew SygitBusiness Member
      Property Manager · Royal Oak, MI · Member since 2012 · 12k+ posts · 9k+ votes
      1w

      Great info!

      Our thoughts:

      Most investors should be targeting Class B rentals/tenants.

      Class B rentals are realistically what the majority of investors have historically bought.

      You get decent, relatively stable tenants and only once every 3-5 years

      The 6 Survivors you've ID'd all fit that description and then some. I would rank them as "B+" areas.

      So, investors may have to pay a bit of a premium for rentals in these areas as they'll be competing with primary residence buyers.

      We actually like most of your Near Misses!

      They are still Class B and we see good demand for rentals.

      Maybe you can track Rental DOM to confirm?

      We would only worry about the small population decline if it starts to exceed 5% (?) or rents start falling.

      Question: what is the relationship between population decline and vacancies?

      Hamtramck & Hazel Park: are both stable Class B cities we are positive about. Hamtramck vacancy is mostly on the city boundaries abutting Detroit. Hazel Park is the cheapest city in south Oakland County and builders are tearing down houses to build $350k+.

      Allen Park, Clinton Township, Fraser, Inkster, Oak Park, Warren, Westland, Wyandotte: All have Class A AND B areas. Doesn't make sense to buy a Class A, have to know where the Class B's are.

      Southfield: some of the highest millage rates in the area! So, NOT attractive for rentals unless rock bottom acquisition price.

      CITY OF DETROIT
      48219: most of the Neighborhoods are Class C, so no surprise about the vacancy.

      48209: Hubbard Farms is Class B and Southwest is solid Class C (we think it may gentrify to Class B in 3-5 years). Would NOT buy in the rest of the ZIP Neighborhoods!

      48223: 11 Neighborhoods!
      - Class B: 3
      - Class C: 4
      - Class D: 4

      You better know the Neighborhoods if you invest in this ZIP!

      Hope this feedback helps:)

    • Haseeb DurraniPro Member
      OP
      Investor · Arlington, NY · Member since 2026 · 44 posts · 19 votes
      6d

      This helps a lot, thanks. B+ on the six is a better grade than I'd have given them, and your line about paying a premium against primary residence buyers is the same thing Jamie and James both said about Memphis. The funnel finds where retail is safe, and safe is where retail competes.

      The near misses are the part worth being honest about. That wall exists because my population gate sits at zero. Sixteen of the eighteen died on population growth alone, all by less than a point. At your 5 percent line every one of them survives and Detroit's answer goes from 6 ZIPs to 22. The zero is deliberate for someone buying from a distance, but the survivor count is a threshold choice, not a fact about Detroit, and you just put a number on how much.

      Rental DOM I don't have. The public files I use don't carry days on market for rentals at ZIP level, and I'm not going to fake it. The closest public proxy is the census rental vacancy rate, empty units actually offered for rent over the rental stock. Survivors run 1.1 to 12.8 percent, median 4.1. Near misses run 0.3 to 11.5, median 4.8. Same shape, which backs your read that the near misses are the same class. The one outlier is Madison Heights at 12.8 on a big rental stock, worth a look before anyone leans on it.

      On population decline versus vacancy, in this table they're close to unrelated. Correlation across the 53 is minus 0.12. The wall has small declines and low vacancy. The ZIPs that died on vacancy mostly have modest declines. Only eight ZIPs in the whole set of 62 are bad on both, and all eight are Detroit city or Highland Park. You gave the mechanism with Hazel Park: teardowns remove units, so population can fall while vacancy doesn't rise. Population is a five year flow, vacancy is a snapshot.

      And splitting vacancy answered something I hadn't asked. The 1938 group and the sub 80K core run about a quarter of all units vacant, four times the suburbs. But their rental vacancy is 3.2 and 3.4 percent, tighter than the survivors. Roughly 80 percent of the empty units in the old core are held off the market entirely, not for rent, not for sale, against 41 percent in the suburbs. So the rental market in those ZIPs is tight. The vacancy is standing inventory nobody is offering, and my occupancy screen reads that as softness when it isn't. Whether it's recoverable stock or functionally gone is a block level question, and it's yours.

      Millage is fair and it's a real gap. The funnel's yield is gross, it can't see property tax, and the census does publish median tax paid by ZIP: 48033 Southfield works out to about 1.78 percent of value, toward the top of this set. An effective rate column is doable if it's useful.

      Hamtramck and Hazel Park: your read turns both ZIP numbers into composition problems, Hamtramck's vacancy sitting on the Detroit edge and Hazel Park's price dip riding on teardowns. Same thing I hit in 38107 in Memphis, one number describing two things, and I'm not going to argue with the ground.

      The city table with your three filled in is in the file I sent you. If you fill in the rest, it goes up here with your name on it.

    • Haseeb DurraniPro Member
      OP
      Investor · Arlington, NY · Member since 2026 · 44 posts · 19 votes
      6d

      Follow-up on the Detroit table, picking up the cost-side idea from the thread (Josh's, with James's shop behind it). You don't need to know which house still has its original drain line, you need the share of the ZIP exposed to the question, and the better version accounts for who's been holding the stock, since long-term owners replaced systems as they failed and absentee rentals deferred them. One census table each. The cutoff is 1970, not 1960, for a plumbing reason: cast iron drain lines were standard through the 60s and aluminum branch wiring runs roughly 1965 to 1973, so a 1965 house is the same conversation underground as a 1955 one.

      Detroit, the 53 that cleared size and price plus the nine sub 80K core ZIPs. Pre-1970 share, the 60s alone, and how much of the pre-1970 stock is renter held:

      Survivors (6): 69%, 17%, 21% renter held

      Near miss wall (18): 72%, 15%, 29%

      The five 1938 ZIPs: 84%, 5%, 46%

      Other screen 3 and 4 deaths (24): 74%, 17%, 32%

      Sub 80K core (9): 89%, 7%, 43%

      Age barely separates the survivors from the wall, 69 vs 72 (53 vs 57 if you cut at 1960 instead). Tenure does, 21 vs 29, and it keeps climbing into the core at 43. Same vintage, different history.

      The 60s column says something I didn't expect. The transition decade lives in the suburbs. Survivors and the wall are 15 to 17 percent 60s stock, the 1938 group and the core are 5 to 7. So the decade that straddles every plumbing and wiring change, the one where a rehab budget is hardest to predict, is a suburban exposure in Detroit. The core's problem is prewar, and it's a different problem.

      Vacancy fits the same picture once you split it. The old core is a quarter empty by all units but under 3.5 percent empty by rental vacancy, because most of what's empty there isn't offered at all. That's a condition of the stock, not a demand signal. The numbers are under Drew's comment.

      Margins run 3 to 12 points a ZIP on the shares and the ordering holds.

  • James JonesPro Member
    Investor · Collierville, TN 38017 · Member since 2017 · 589 posts · 445 votes
    2w

    Jamie Parker - Haseeb routed your two questions to the guys who've held the bag, so let me hold it.

    On the 6-month loan maturing: don't underwrite to the loan term, underwrite to the ZIP's sit time plus your own turn time, and then ask whether the loan covers both. In a 90-day ADOM ZIP a 6-month bridge gives you roughly 60 to 75 days of actual construction before you're praying, and nobody's crew in this city runs a full gut in 60 days. Take the 12-month even at worse terms. The extension fee on a 6-month is almost always more expensive than the extra points on a 12, and that's the cheap part of the cost.

    The expensive part is what a maturing loan does to your negotiating position. Buyers and their agents can smell a seller on a clock. At day 150 on a 6-month note you are not choosing whether to accept the offer, you are choosing between the offer and default, and everyone at the table knows it. The loan term quietly becomes your list price. I've watched people give back the whole rehab margin in the last thirty days of a bridge loan.

    On how much rehab is too much: in the cheap core the honest answer is that there is no middle, so the question isn't how much, it's which of three rehabs you're doing - and you pick before you buy, not after demo.

    Josh already gave the construction reason: moving a house from the $50-70/ft pile to the $110-130/ft pile costs about the same in 38112 as it does in a nicer ZIP, because the drywall and the HVAC don't know what ZIP they're in. What that means for your question is that a half-rehab prices as an unrenovated house with your money buried in it. Thirty grand of new paint, floors and a kitchen in a barbell ZIP doesn't get you a renovated comp - it gets you an unrenovated comp and a thirty thousand dollar lesson. Cosmetic or full. The middle is where people die.

    The third rehab is the one this thread hasn't named yet, and it's the one that makes the barbell survivable: renovate to voucher standard and hold. That is a different scope of work than a retail rehab, not a cheaper version of it. A voucher tenant's rent doesn't go up because you put in quartz - the payment standard is the payment standard. But the unit has to pass inspection the first time, every time, and HUD is moving from HQS to NSPIRE, which cares about different things than a buyer's home inspector does. So the money goes into the systems, the safety items and the surfaces that survive turns, and not into the finishes that sell a house. Same house, same block, two completely different scopes, and you cannot decide which one you're doing after the dumpster shows up.

    That's also the real answer to "how much rehab is too much." Too much is any dollar that only pays off in the exit you're not actually taking.

    And Haseeb is right that I skipped 38107, so let me stop skipping it. Jamie's read is correct and it's the reason I left it out: 38107 has the widest top-to-bottom spread in the metro and it is the ZIP where I am least willing to give one answer. Vollintine-Evergreen and Uptown are genuinely different products from the blocks sitting between them, and the boundary is not a neighborhood line you can draw on the map I'd hand somebody - it moves street by street and it has moved in the last three years. The barbell in 38112 is two products under one median. In 38107 it's two products under one median that are physically interleaved.

    Which is exactly why I'd tell an out-of-state buyer the widest gap is the worst place to learn. A wide spread reads like opportunity on a spreadsheet. On the ground it means the penalty for being wrong by two streets is the entire spread. That's a great ZIP to own if you already know which side of the street you're standing on, and a fast way to lose money if you're pricing it off a ZIP-level number.

    Jay Hinrichs - your 200 doors in south Jackson is the version of this business nobody puts in a webinar, and I'm not going to pretend Memphis is a different physics. Two steps forward and one back is accurate. The only thing I'd add is that the ratio is set almost entirely by whether the crew is yours or somebody's you call. Everything you described - the condensers, the vacancy losses, the check at exit - is a response-time problem before it's a market problem. I've never seen an absentee-managed Section 8 portfolio in a cheap core hold its numbers past year three, and I've watched a lot of people try. That's not a knock on the strategy. It's the reason I don't tell out-of-state buyers to do what I do.

    Last thing, on Jamie's point about the survivor ZIPs being crowded: she's right, and it's the quiet cost of any funnel. A screen that produces one survivor out of seventy has, by construction, pointed everybody who runs it at the same place. Horn Lake is a fine answer. It's also going to be a fine answer for the next four hundred people who read this thread, and they'll all be bidding against DeSoto County retail buyers who don't care about yield. The edge in a screened market isn't the ZIP - it's what you can do inside it that the other bidders can't.

    • Real Estate Investor · Memphis, TN · Member since 2016 · 402 posts · 129 votes
      2w

      @James Jones

      The 6 month loan is equation is used because of the 3 classes of HML available. Before getting into it, a 12 month loan that is paid off early is better than a 6 month loan that has to be extended to a 9 month loan because the exit time missed the target. So we are speaking the same language on that.

      When days on market flutters around the 60 day mark, thats simply a signal in my opinion. as long as its under 100 the area is in good company. Memphis 3.0 is designed to address some urban migration thats doesn't happen without Real Estate Investment in blighted areas. Im not running for office but that are only 2 deterrents of someone living in one neighbor in the city vs another neighborhood in the city or the county; Schools and Crime.

      The National Guard being in town is the best time to gentrify some neighborhoods, and increase urban migration back to the town. Without getting anymore political than I am already, in an investor has 2500 houses in 1 zip code, that brings value to the area. 300 Houses in a 1 mile radius is more influential than 300 houses in 70 different zip codes.

      To out of state investors, the best thing you can do is understand the players in the market. Everyone doesn't have the ability or the bandwidth to be that intentional but if you do, There is real upside because you can buy dirt for dirt cheap right now.

  • James JonesPro Member
    Investor · Collierville, TN 38017 · Member since 2017 · 589 posts · 445 votes
    1w

    Jamie Parker - you buried the most important sentence in this entire thread at the bottom of that post, so I'm going to dig it back up: 300 houses in a one-mile radius is more influential than 300 houses in 70 different ZIP codes.

    Put that next to what Jay Hinrichs told us earlier in this thread and something clicks. Jay bought roughly 350 homes from Jackson to Indy, HAD local partners, and got run over anyway - eighteen months, ten million in debt, bought out at 2k a door. Same house count Jamie is describing. Completely different outcome. The difference isn't the number of doors, the market, or even the partners. It's that one is a portfolio and the other is a geography.

    DENSITY IS THE VARIABLE NOBODY SCREENS FOR

    On the operating side it decides everything about your cost structure. Drive time between doors is the hidden input to every maintenance number you'll ever run. A crew covering a one-mile radius does real work most of the day. The same crew covering a metro spends half its paid hours in a truck, and you pay for those hours whether or not a wrench turns. Density is also what makes a maintenance bench affordable at all - you can't keep two techs and a turn crew busy across scattered doors, so you end up calling vendors, which is exactly the response-time problem that eats voucher portfolios in cheap cores. Everything I've claimed about owning your crew actually reduces to this: crews only work if the doors are close together.

    And Jamie's point is the market-side version, which is the part I hadn't thought through. If you own enough of a one-mile radius, you stop being exposed to the comp set and start BEING it. Every house you renovate raises the bar for the next sale on that block, and you capture that instead of donating it to whoever owns next door. Scattered, you're a price taker in seventy different micro-markets. Concentrated, you're the market in one.

    Which points at a real limitation in the funnel, and I say that as someone who spent a week defending it. Haseeb Durrani, your screen sorts metros and ZIPs beautifully. It cannot see density, because density isn't a property of a ZIP - it's a property of a BUYER'S plan inside one. Two people can run your funnel, get the identical five ZIPs, and one builds a concentrated position while the other buys five scattered houses across all five. The screen said the same thing to both of them, and only one of them has a business.

    One more thing that fits here, and I need to correct myself publicly. I've been pushed hard this week, privately, on the ZIP-level dollars-per-foot method I've been recommending in this thread - by an operator in another market with decades in it, who pointed out that in his city the spreads inside a single block are wide enough that a ZIP-level number is not merely imprecise, it's the actual mechanism by which out-of-state buyers overpay. I think he's right, and it means my framing has been too coarse. The two piles are real, but they're a BLOCK-level phenomenon that ZIP data only sometimes happens to surface - Memphis shows it at ZIP level because whole pockets moved together, and other metros don't. Harvey Levin, that's your correction and I'd rather you got to make it in your own words here than have me paraphrase it. Say it publicly if you're willing.

    And Jamie, on the loan question - agreed completely, and you said it better than I did. A 12-month paid off early beats a 6-month extended to nine. You're paying for optionality, not for time.

    • Haseeb DurraniPro Member
      OP
      Investor · Arlington, NY · Member since 2026 · 44 posts · 19 votes
      1w

      @James Jones The density point lands and I'm not going to argue with it. The screen tells you where. What you do once you're there isn't something it can see, and two people pulling the same five ZIPs with only one of them building a business is exactly right. Jamie's 300 in a mile line is the best one-sentence version of that in the thread.

      Taking the correction too. Every table I've posted is ZIP-level, so read them as where the medians sit, not as a barbell test. Said more on that under Drew's comment.

      And thanks for actually answering the two questions I routed. The third rehab was the one nobody had named.

  • Haseeb DurraniPro Member
    OP
    Investor · Arlington, NY · Member since 2026 · 44 posts · 19 votes
    1w

    Indianapolis, and I'm moving it up the queue because it's the metro where the block-level correction James posted bites hardest. If a ZIP number is going to be confidently wrong anywhere, it's here.

    Ran the same four screen funnel on all 105 scored ZIPs in the Indianapolis metro: size and price band first (population 10,000 or more, price $80K to $250K), then gross yield 8 percent or better, then values holding (3 year appreciation above zero and 1 year better than negative 2), then occupancy (vacancy 10 percent or under and population growth zero or better). Screen 1 removed 82 of 105, mostly on the $250K ceiling; the full breakdown is with the death table below. Yield took 12, appreciation 7, occupancy 3. One ZIP cleared all four, and it's holding on by 0.3 points on the one year gate.

    SURVIVORS (cleared all four screens):
    46235 Indianapolis, IN: price $218,713, rent $1,822 (zillow), yield 10.0%, 1yr -1.7%, 3yr +4.9%, vacancy 7.6%, pop 36,317 (+1.2%), median year built 1988, 2BR FMR $1,250

    NEAR MISSES (clear every gate but one, and miss that one by a small margin):
    Where a rounded figure would read as passing, the exact unrounded value is shown.
    46107 Beech Grove, IN: fails only occupancy (pop growth -0.0077%, 0.01 pts short), yield 8.3%, 3yr +3.8%, vacancy 6.6%, median year built 1962
    46012 Anderson, IN: fails only yield (yield 7.9%, 0.13 pts short), 3yr +14.5%, vacancy 7.1%, median year built 1967
    46226 Indianapolis, IN: fails only appreciation (1-yr -2.2%, 0.16 pts short), yield 9.0%, 3yr +2.1%, vacancy 8.1%, median year built 1966
    46221 Indianapolis, IN: fails only yield (yield 7.7%, 0.32 pts short), 3yr +7.3%, vacancy 9.2%, median year built 1976
    46229 Indianapolis, IN: fails only appreciation (1-yr -2.5%, 0.47 pts short), yield 9.8%, 3yr +3.0%, vacancy 5.4%, median year built 1978
    46254 Indianapolis, IN: fails only yield (yield 7.0%, 0.95 pts short), 3yr +6.3%, vacancy 5.9%, median year built 1988

    Three things stand out.

    At ZIP level, Indy is the least barbelled metro I've run, and by a distance. No sub $80K core at all, the youngest stock (median year built 1979 across the metro), and the fewest occupancy kills, 3 against Detroit's 25. If you only had this table, you'd call it the metro where a ZIP number is safest.

    Two things argue with that. First, the voucher side doesn't look compressed at all: the spread between HUD's 2BR payment and market rent runs 21.9 points across the middle half of ZIPs, the widest middle range I've seen in this series, and it's the only metro where the median spread is positive, +4.5 percent. Second, and this is the bigger one, the block-level correction. If the two piles live at block level and only sometimes show up at ZIP level, then a compressed ZIP table is exactly what a block-level barbell looks like after you average it. This table cannot tell "least barbell" from "barbell hidden by the averaging." That's the honest headline for this whole series: Indy is the metro where I'd trust these numbers most for where to look and least for what to pay.

    And the oldest stock pattern from Detroit repeats. Indy's housing is the youngest of the metros I've run, and the two worst three year prints, 46201 and 46208, both sit on 1938 stock. By Josh's cost point, younger stock should make Indy the metro where a rehab budget is most predictable. By the block-level correction, it's the metro where a ZIP price is least reliable. Both can be right. They're about different numbers.

    What the table can't do, same as every drop: the actual block-level test. Ninety days of solds in 46235 and the two closest misses, Beech Grove 46107 and Anderson 46012, price and square footage, would settle it, and Indy has people in this thread who can pull that. The one thing I can't test from public data at all is whether Indy's housing agency pays above the published FMR, so that half of the original question stays open.

    WHERE EACH ZIP DIES. Below are the 23 ZIPs that cleared size and price. The 82 removed at Screen 1 break down as 71 over the $250K ceiling, 0 under the $80K floor and 39 under the 10,000 population floor. Those categories overlap, so they do not sum to 82. Full 105 row table available on request.

    ZIP

    City

    Year built

    Result

    Note

    46012

    Anderson, IN

    1967

    Died S2: yield 7.9% (under 8%)

    NEAR MISS

    46221

    Indianapolis, IN

    1976

    Died S2: yield 7.7% (under 8%)

    NEAR MISS

    46254

    Indianapolis, IN

    1988

    Died S2: yield 7.0% (under 8%)

    NEAR MISS

    46013

    Anderson, IN

    1969

    Died S2: yield 6.8% (under 8%)

    46227

    Indianapolis, IN

    1971

    Died S2: yield 6.8% (under 8%)

    46219

    Indianapolis, IN

    1957

    Died S2: yield 6.7% (under 8%)

    46011

    Anderson, IN

    1962

    Died S2: yield 6.7% (under 8%)

    46214

    Indianapolis, IN

    1982

    Died S2: yield 6.6% (under 8%)

    46001

    Alexandria, IN

    1966

    Died S2: yield 6.4% (under 8%)

    46224

    Indianapolis, IN

    1968

    Died S2: yield 6.3% (under 8%)

    46176

    Shelbyville, IN

    1971

    Died S2: yield 5.6% (under 8%)

    46036

    Elwood, IN

    1953

    Died S2: yield 5.6% (under 8%)

    46229

    Indianapolis, IN

    1978

    Died S3: 1-yr -2.5%

    NEAR MISS

    46226

    Indianapolis, IN

    1966

    Died S3: 1-yr -2.2%

    NEAR MISS

    46218

    Indianapolis, IN

    1955

    Died S3: 1-yr -2.7%

    46222

    Indianapolis, IN

    1955

    Died S3: 1-yr -5.5%

    46203

    Indianapolis, IN

    1957

    Died S3: 3-yr -2.6%; 1-yr -2.1%

    46208

    Indianapolis, IN

    1938

    Died S3: 3-yr -4.2%; 1-yr -6.2%

    46201

    Indianapolis, IN

    1938

    Died S3: 3-yr -9.3%; 1-yr -5.1%

    46016

    Anderson, IN

    1942

    Died S4: vacancy 21.8%; pop growth -3.0%

    46241

    Indianapolis, IN

    1966

    Died S4: pop growth -1.1%

    46107

    Beech Grove, IN

    1962

    Died S4: pop growth -0.0077%

    NEAR MISS

    46235

    Indianapolis, IN

    1988

    Cleared all 4 (yield 10.0%, 3yr +4.9%)

    SURVIVOR

    • Haseeb DurraniPro Member
      OP
      Investor · Arlington, NY · Member since 2026 · 44 posts · 19 votes
      15h

      @Josh Handler asked whether the age cut holds up once you read renter-held stock and vacancy together instead of one at a time, so I recut Indy on that. The framing is his (Josh, James's construction partner); the numbers are mine.

      Start with the two 1938 ZIPs, since that's where he expected it to bite.

      ZIP

      Pre-1940 share

      Renter-held, pre-1970 stock

      Vacancy

      1-yr

      3-yr

      Rent growth

      46201

      58.6%

      45.0%

      18.4%

      -5.2

      -9.3

      4.7%

      46208

      55.7%

      38.2%

      19.7%

      -6.2

      -4.2

      5.8%


      They land on opposite sides of the renter-held line, and I don't think that means anything. The cut is the median of Indy's 23 first-screen survivors, 39.1 percent. 46208 sits 0.9 points under it, and the values right around it are 38.2, 39.1, 39.4 and 40.1. Move the cut anywhere reasonable and 46208 changes sides. On vacancy they're the same ZIP, both near 19 percent. On age they're the same ZIP, both near 57 percent built before 1940. What separates this pair from the other 21 is age and vacancy, decisively. Renter-held doesn't separate them from each other at all.

      Where the two-quadrant read earns its keep is in the two metros with enough 1938 stock to split. One rule for all three: ZIPs whose median year built is 1938, the floor of the census year-built field. Every one of them sits above the funnel's 10 percent vacancy line. Within each metro, the split is at that metro's own median renter-held share, so the more-rented half of its 1938 ZIPs against the more-owned half. Medians:

      More-rented half: 1-yr / 3-yr

      More-owned half: 1-yr / 3-yr

      Cleveland (2 vs 2)

      -3.4 / +4.3

      -0.8 / +10.7

      Detroit (3 vs 2)

      -14.1 / -12.1

      -1.1 / +8.5


      Same direction in both, and the honest version names the difference in degree. In Cleveland the more-rented 1938 ZIPs are still up on three years, just 5 to 8 points behind the more-owned ones. In Detroit they're down 12 to 17 while the more-owned ones are up 6 to 11. High vacancy on its own doesn't tell you values are falling: every one of these nine ZIPs is above 14 percent vacant, and all four of the more-owned ones are up on three years. High vacancy in the more-rented old stock is where values lag, and in Detroit where they fall outright. The cells are two and three ZIPs a side, so read it as a pattern to test, not a result.

      Indy can't testify either way. It has exactly two 1938 ZIPs, the pair above, and the renter-held cut sits less than a point from 46208, so any split there is a coin flip. That's the Indy finding: the frame can't be tested here yet, and I'd rather say that than pool a mixed-age set and call it a third metro.


      Cleveland's four, same columns:

      ZIP

      Pre-1940

      Renter-held, pre-1970 stock

      Vacancy

      1-yr

      3-yr

      Half

      44120

      54.7%

      46.9%

      18.2%

      -2.1

      +7.7

      more owned

      44102

      60.8%

      63.6%

      16.3%

      -5.2

      +2.7

      more rented

      44106

      50.3%

      72.3%

      15.2%

      -1.7

      +6.0

      more rented

      44109

      57.0%

      51.0%

      14.3%

      +0.6

      +13.7

      more owned

      Detroit's five:

      ZIP

      Pre-1940

      Renter-held, pre-1970 stock

      Vacancy

      1-yr

      3-yr

      Half

      48206

      60.9%

      44.7%

      40.5%

      -13.2

      -11.7

      more rented

      48212

      56.9%

      37.5%

      18.9%

      -0.4

      +10.7

      more owned

      48209

      67.5%

      37.7%

      15.1%

      -1.8

      +6.2

      more owned

      48214

      54.4%

      56.9%

      23.2%

      -16.3

      -17.0

      more rented

      48202

      57.9%

      62.2%

      27.0%

      -14.1

      -12.1

      more rented


      On the rows where the two signals disagree, meaning above Indy's 39.1 percent renter-held cut but with vacancy under the 10 percent line and values falling anyway: Indy has exactly two, both tight near misses. 46226 at 41.6 percent renter-held, 8.1 percent vacancy, down 2.2 on the year, with rent growth of 5.6 percent. 46229 at 44.9 percent, 5.4 percent vacancy, down 2.5 on the year, rent growth 2.9 percent. Both are still positive on three years, so what they disagree about is the one-year turn, not the trend. 46226 is the one worth watching, because rents rising near the top of the cohort while prices fall is a divergence, not a demand failure.

      Cleveland has none. Detroit has none. In those two metros the two signals agree on every 1938 ZIP, which is worth saying out loud.

      Caveats. Rent growth is missing on six of the 32 ZIPs, and only one of those is census-derived; the other five have an observed rent level with no 12-month series behind it, including two of the Detroit five, so the discriminator is absent exactly where Detroit is most extreme. The Cleveland and Detroit cells are two and three ZIPs a side. Census five-year figures are a 2020 to 2024 average and describe stock, not this year's flow. Year built is self-reported, so the 1940 and 1970 lines are wide boundaries, not precise vintages.

      Source: U.S. Census Bureau, American Community Survey 2024 five-year estimates, tables B25034, B25036, B25002 and B25004.

  • Haseeb DurraniPro Member
    OP
    Investor · Arlington, NY · Member since 2026 · 44 posts · 19 votes
    1w

    Cleveland, as promised, one drop later than I said.

    Same four screen funnel, 107 scored ZIPs. Screen 1 removed 74, mostly on the $250K ceiling; the full breakdown is with the death table below. Yield took 15, appreciation 3, occupancy 11. Four cleared all four.

    SURVIVORS (cleared all four screens, ranked by 3 year appreciation):
    44135 Cleveland, OH: price $160,531, rent $1,530 (zillow), yield 11.4%, 1yr +4.7%, 3yr +20.0%, vacancy 5.8%, pop 28,022 (+1.6%), median year built 1954, 2BR FMR $1,280
    44055 Lorain, OH: price $129,593, rent $1,162 (zillow), yield 10.8%, 1yr +5.7%, 3yr +15.8%, vacancy 8.7%, pop 20,043 (+0.9%), median year built 1956, 2BR FMR $1,130
    44111 Cleveland, OH: price $163,612, rent $1,244 (zillow), yield 9.1%, 1yr -0.2%, 3yr +13.5%, vacancy 6.9%, pop 42,021 (+5.2%), median year built 1941, 2BR FMR $1,180
    44125 Cleveland, OH: price $144,887, rent $1,437 (zillow), yield 11.9%, 1yr +2.1%, 3yr +12.0%, vacancy 7.7%, pop 29,461 (+0.3%), median year built 1955, 2BR FMR $1,390

    NEAR MISSES (clear every gate but one, and miss that one by a small margin):
    Where a rounded figure would read as passing, the exact unrounded value is shown.
    44137 Maple Heights, OH: fails only occupancy (pop growth -0.4%, 0.43 pts short), yield 13.8%, 3yr +18.0%, vacancy 6.3%, median year built 1955
    44035 Elyria, OH: fails only yield (yield 7.4%, 0.61 pts short), 3yr +17.7%, vacancy 9.0%, median year built 1966
    44129 Cleveland, OH: fails only yield (yield 7.2%, 0.77 pts short), 3yr +21.4%, vacancy 5.5%, median year built 1956

    Detroit produced six suburban survivors and not one city ZIP. Cleveland does the opposite: four survivors, and three of them carry the Cleveland place name (44135, 44111, 44125), with the fourth in Lorain. Whatever the two cities share, the funnel doesn't see them the same way, and I still don't have a good answer for why from anyone who knows both.

    The value deaths are the part to read carefully. Three ZIPs died on values, 44102, 44120 and 44110, and all three have positive three year appreciation. They died on the one year gate. That reads like recent softening rather than a multi-year slide, and it isn't one side of town: two are east side, one is west. I'd want a local to say whether that's a turn or a single soft year.

    Then the emptiness. Eleven occupancy deaths, a third of the table, eight of them on vacancy of 11 percent or more. And the oldest stock pattern again: all four 1938 ZIPs in the table died, two on values, two on vacancy. The exception is 44111, built 1941, which survives on +5.2 percent population growth, a number I'd expect someone local to argue with.

    Same caveat as every table in this series: this says where to look, not what to pay. Ninety days of solds in any of the four survivors, price and square footage, is still the test the table can't run.

    WHERE EACH ZIP DIES. Below are the 33 ZIPs that cleared size and price. The 74 removed at Screen 1 break down as 58 over the $250K ceiling, 7 under the $80K floor and 32 under the 10,000 population floor. Those categories overlap, so they do not sum to 74. Full 107 row table available on request.

    ZIP

    City

    Year built

    Result

    Note

    44095

    Eastlake, OH

    1961

    Died S2: yield 7.5% (under 8%)

    44035

    Elyria, OH

    1966

    Died S2: yield 7.4% (under 8%)

    NEAR MISS

    44129

    Cleveland, OH

    1956

    Died S2: yield 7.2% (under 8%)

    NEAR MISS

    44146

    Bedford, OH

    1964

    Died S2: yield 6.9% (under 8%)

    44017

    Berea, OH

    1959

    Died S2: yield 6.5% (under 8%)

    44130

    Cleveland, OH

    1964

    Died S2: yield 6.3% (under 8%)

    44144

    Cleveland, OH

    1955

    Died S2: yield 5.4% (under 8%)

    44004

    Ashtabula, OH

    1954

    Died S2: yield 5.3% (under 8%)

    44142

    Brookpark, OH

    1961

    Died S2: yield 5.2% (under 8%)

    44092

    Wickliffe, OH

    1960

    Died S2: yield 5.2% (under 8%)

    44030

    Conneaut, OH

    1954

    Died S2: yield 5.0% (under 8%)

    44054

    Sheffield Lake, OH

    1970

    Died S2: yield 4.8% (under 8%)

    44053

    Lorain, OH

    1977

    Died S2: yield 4.7% (under 8%)

    44057

    Madison, OH

    1976

    Died S2: yield 4.6% (under 8%)

    44041

    Geneva, OH

    1962

    Died S2: yield 3.9% (under 8%)

    44110

    Cleveland, OH

    1941

    Died S3: 1-yr -4.8%

    44120

    Cleveland, OH

    1938

    Died S3: 1-yr -2.1%

    44102

    Cleveland, OH

    1938

    Died S3: 1-yr -5.2%

    44132

    Euclid, OH

    1958

    Died S4: vacancy 15.3%

    44106

    Cleveland, OH

    1938

    Died S4: vacancy 15.2%

    44109

    Cleveland, OH

    1938

    Died S4: vacancy 14.3%

    44052

    Lorain, OH

    1953

    Died S4: vacancy 13.0%

    44128

    Cleveland, OH

    1958

    Died S4: vacancy 12.6%; pop growth -1.8%

    44115

    Cleveland, OH

    1963

    Died S4: vacancy 11.9%; pop growth -3.6%

    44119

    Cleveland, OH

    1945

    Died S4: vacancy 11.4%; pop growth -1.9%

    44123

    Euclid, OH

    1956

    Died S4: vacancy 11.0%; pop growth -1.9%

    44121

    Cleveland, OH

    1951

    Died S4: pop growth -1.1%

    44137

    Maple Heights, OH

    1955

    Died S4: pop growth -0.4%

    NEAR MISS

    44134

    Cleveland, OH

    1958

    Died S4: pop growth -1.2%

    44111

    Cleveland, OH

    1941

    Cleared all 4 (yield 9.1%, 3yr +13.5%)

    SURVIVOR

    44125

    Cleveland, OH

    1955

    Cleared all 4 (yield 11.9%, 3yr +12.0%)

    SURVIVOR

    44135

    Cleveland, OH

    1954

    Cleared all 4 (yield 11.4%, 3yr +20.0%)

    SURVIVOR

    44055

    Lorain, OH

    1956

    Cleared all 4 (yield 10.8%, 3yr +15.8%)

    SURVIVOR

  • Haseeb DurraniPro Member
    OP
    Investor · Arlington, NY · Member since 2026 · 44 posts · 19 votes
    1w

    St. Louis, the last of the four metros James named.

    Same four screen funnel, 182 scored ZIPs, and the most small-town metro of the set: half of them, 92 of 182, are under the 10,000 population floor. Screen 1 removed 150; the full breakdown is with the death table below. Yield took 15, appreciation 4, occupancy 9. Four cleared all four.

    SURVIVORS (cleared all four screens, ranked by 3 year appreciation):
    63114 Saint Louis, MO: price $142,801, rent $1,293 (zillow), yield 10.9%, 1yr +3.8%, 3yr +11.0%, vacancy 6.2%, pop 33,969 (+0.8%), median year built 1954, 2BR FMR $1,260
    62040 Granite City, IL: price $123,331, rent $1,140 (zillow), yield 11.1%, 1yr +3.0%, 3yr +10.2%, vacancy 9.0%, pop 40,404 (+0.1%), median year built 1962, 2BR FMR $1,040
    63033 Florissant, MO: price $201,388, rent $1,719 (zillow), yield 10.2%, 1yr +2.6%, 3yr +5.4%, vacancy 7.9%, pop 43,056 (+1.9%), median year built 1966, 2BR FMR $1,250
    62223 Belleville, IL: price $183,653, rent $1,340 (zillow), yield 8.8%, 1yr +1.4%, 3yr +5.2%, vacancy 8.5%, pop 16,269 (+0.0%), median year built 1965, 2BR FMR $1,180

    NEAR MISSES (clear every gate but one, and miss that one by a small margin):
    Where a rounded figure would read as passing, the exact unrounded value is shown.
    63031 Florissant, MO: fails only occupancy (pop growth -0.1%, 0.12 pts short), yield 10.6%, 3yr +4.3%, vacancy 7.4%, median year built 1967
    62208 Fairview Heights, IL: fails only occupancy (vacancy 10.4%, 0.45 pts short), yield 8.7%, 3yr +4.4%, median year built 1971
    62095 Wood River, IL: fails only occupancy (vacancy 10.1%; pop growth -0.5%, 0.50 pts short), yield 9.7%, 3yr +13.6%, median year built 1956
    63125 Saint Louis, MO: fails only yield (yield 7.3%, 0.70 pts short), 3yr +10.1%, vacancy 7.6%, median year built 1961

    The river doesn't split the answer. Two survivors on each side: Florissant and 63114 in Missouri, Granite City and Belleville in Illinois. What does split is how ZIPs die. All four value deaths carry the Saint Louis place name, six of the nine occupancy deaths are on the Missouri side, and the Illinois side mostly dies on yield, which is the gentler way to go.

    Two honest notes. First, 54 percent of this metro's rent figures are census estimates rather than observed rents. It happens not to touch the answer, every survivor and every near miss sits on observed rent, but it's why I'd trust the yield deaths here less than in Detroit. Second, two of the four survivors clear the population growth gate by a tenth of a point or less, Granite City at +0.1 and Belleville at 0.0, so the Illinois half of the answer is thinner than it looks.

    The oldest stock pattern shows up with a twist. Five 1938 ZIPs in the table, all five died, but three of them died on yield, not on values or vacancy. That's the opposite failure from Detroit's 1938 ZIPs: too expensive for their rent, not too empty. Old stock people want is a different problem from old stock nobody does, and a ZIP median can't tell you which one you're looking at.

    Same caveat as every table in this series: where to look, not what to pay. Ninety days of solds in any of the four survivors, price and square footage, is the test I can't run.

    WHERE EACH ZIP DIES. Below are the 32 ZIPs that cleared size and price. The 150 removed at Screen 1 break down as 105 over the $250K ceiling, 8 under the $80K floor and 92 under the 10,000 population floor. Those categories overlap, so they do not sum to 150. Full 182 row table available on request.

    ZIP

    City

    Year built

    Result

    Note

    62226

    Belleville, IL

    1975

    Died S2: yield 7.9% (under 8%)

    62220

    Belleville, IL

    1955

    Died S2: yield 7.9% (under 8%)

    63118

    Saint Louis, MO

    1938

    Died S2: yield 7.8% (under 8%)

    63125

    Saint Louis, MO

    1961

    Died S2: yield 7.3% (under 8%)

    NEAR MISS

    62234

    Collinsville, IL

    1969

    Died S2: yield 7.3% (under 8%)

    63116

    Saint Louis, MO

    1938

    Died S2: yield 7.1% (under 8%)

    63139

    Saint Louis, MO

    1938

    Died S2: yield 6.8% (under 8%)

    62010

    Bethalto, IL

    1978

    Died S2: yield 6.3% (under 8%)

    63042

    Hazelwood, MO

    1969

    Died S2: yield 5.9% (under 8%)

    62035

    Godfrey, IL

    1974

    Died S2: yield 5.6% (under 8%)

    62052

    Jerseyville, IL

    1972

    Died S2: yield 4.8% (under 8%)

    63077

    Saint Clair, MO

    1979

    Died S2: yield 4.6% (under 8%)

    63080

    Sullivan, MO

    1983

    Died S2: yield 4.6% (under 8%)

    62246

    Greenville, IL

    1976

    Died S2: yield 4.5% (under 8%)

    63020

    De Soto, MO

    1980

    Died S2: yield 3.5% (under 8%)

    63137

    Saint Louis, MO

    1958

    Died S3: 3-yr -0.1%; 1-yr -2.5%

    63112

    Saint Louis, MO

    1938

    Died S3: 3-yr -1.5%; 1-yr -4.5%

    63135

    Saint Louis, MO

    1955

    Died S3: 3-yr -4.1%

    63111

    Saint Louis, MO

    1938

    Died S3: 3-yr -4.9%

    63136

    Saint Louis, MO

    1959

    Died S4: vacancy 21.0%; pop growth -0.9%

    63138

    Saint Louis, MO

    1969

    Died S4: vacancy 19.2%; pop growth -2.7%

    63121

    Saint Louis, MO

    1953

    Died S4: vacancy 14.3%

    62002

    Alton, IL

    1955

    Died S4: vacancy 12.7%; pop growth -1.6%

    63134

    Saint Louis, MO

    1957

    Died S4: vacancy 12.5%; pop growth -3.0%

    62208

    Fairview Heights, IL

    1971

    Died S4: vacancy 10.4%

    NEAR MISS

    62095

    Wood River, IL

    1956

    Died S4: vacancy 10.1%; pop growth -0.5%

    NEAR MISS

    63031

    Florissant, MO

    1967

    Died S4: pop growth -0.1%

    NEAR MISS

    63074

    Saint Ann, MO

    1958

    Died S4: pop growth -2.7%

    62223

    Belleville, IL

    1965

    Cleared all 4 (yield 8.8%, 3yr +5.2%)

    SURVIVOR

    63114

    Saint Louis, MO

    1954

    Cleared all 4 (yield 10.9%, 3yr +11.0%)

    SURVIVOR

    63033

    Florissant, MO

    1966

    Cleared all 4 (yield 10.2%, 3yr +5.4%)

    SURVIVOR

    62040

    Granite City, IL

    1962

    Cleared all 4 (yield 11.1%, 3yr +10.2%)

    SURVIVOR

Join the conversationCreate a free account to reply, vote on answers and follow this thread.