Duplexes Versus Single Family Homes- The Numbers - Which Investment is Best?
I matched 21,000 house sales against 3,300 duplex sales to settle whether house hacking actually beats buying a house. Here's the method and the result.
Everybody has an opinion on this and almost nobody has run it on equal terms, so I tried to build the comparison carefully. Tell me where it breaks.
THE DESIGN PROBLEM
You can't just compare median duplex price to median house price, because they're different buildings in different places. And you can't compare appreciation rates from market averages, because when the mix of what sells changes, the average moves without the market doing anything.
So I did two things. First, I forced both groups into the same universe: same city, same ZIP codes, same construction era. Second, instead of comparing averages I used repeat sales, matching buildings that sold twice and subtracting one price from the other.
THE UNIVERSE
Every closed sale in Saint Paul ZIP codes 55102, 55103, 55104, 55105, 55106, 55107, 55117 and 55130, December 27 2012 through September 4 2026, from NorthstarMLS. Those eight ZIPs hold 92.5% of the city's 2-4 unit sales.
Both sides capped at year built 1940 or earlier. That matters: the median St. Paul duplex was built in 1907 and 84% are pre-1940. Without the cap I'd be comparing 1900s duplexes to 1970s ramblers, and the result would be about construction era rather than property type.
That gave me 20,947 single family and 3,263 two-to-four unit sales.
REPEAT SALES
I normalized addresses, matched within ZIP, and kept only holds of two years or more with both prices above $50,000 and no decline steeper than 35%. The two-year filter removes flips where the gain is renovation. The other two remove most foreclosures and family transfers.
Result: 4,996 house pairs and 681 duplex pairs.
THE RESULT
Houses Duplexes
Median purchase $189,000 $190,000
Median hold 4.6 yrs 4.7 yrs
Median gain $73,000 $88,000
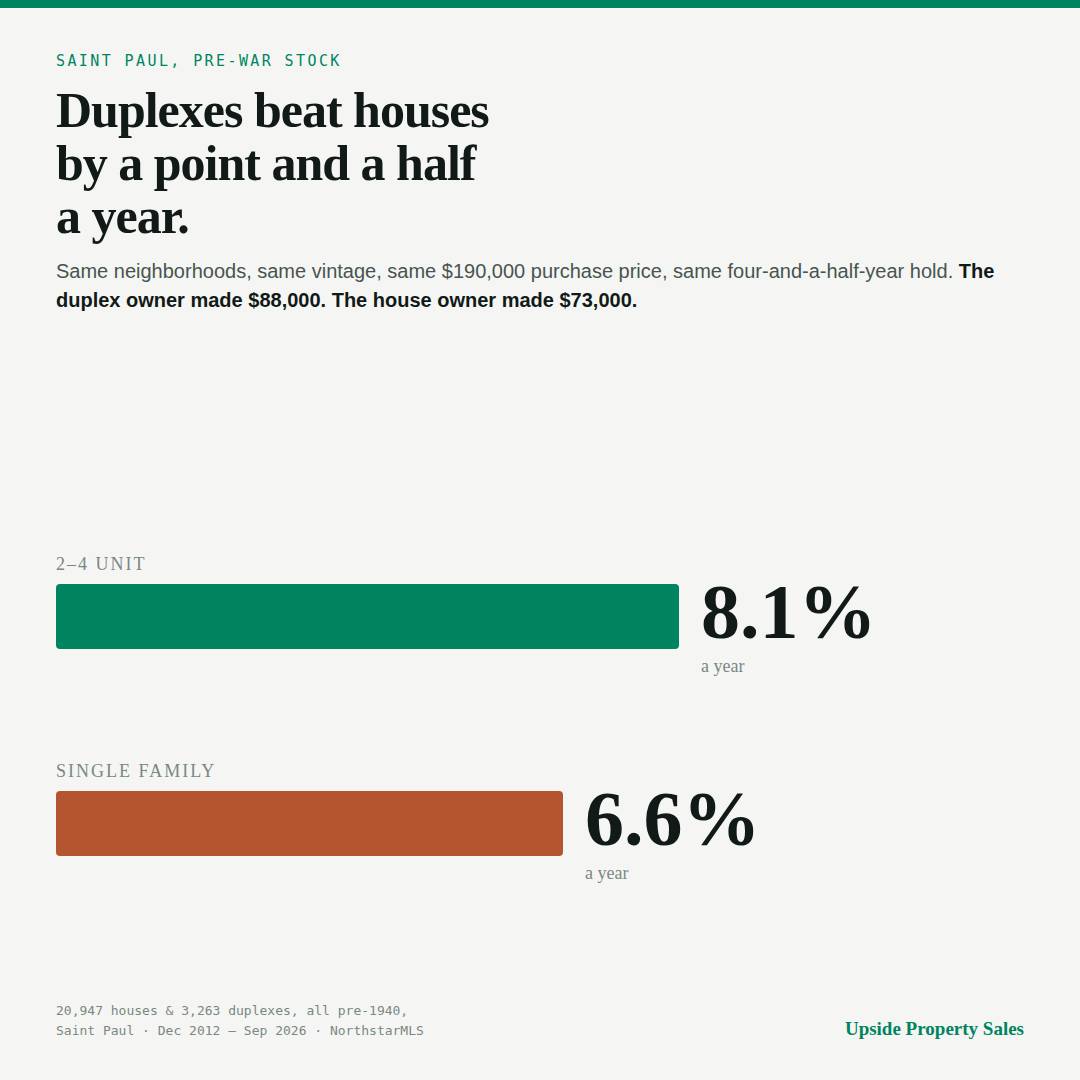
Annualized 6.6% 8.1%
Sold for less 1.9% 3.5%
Nearly identical entry price and holding period, and a 1.4 point annual spread.
I re-derived all of it through a separate parsing and matching path, which reproduced the gap at 1.34 points. A 400-sample bootstrap of the two pair sets puts the gap between 1.0 and 1.9 points, with duplexes ahead in 100% of resamples.
THE PART THAT ACTUALLY EXPLAINS IT
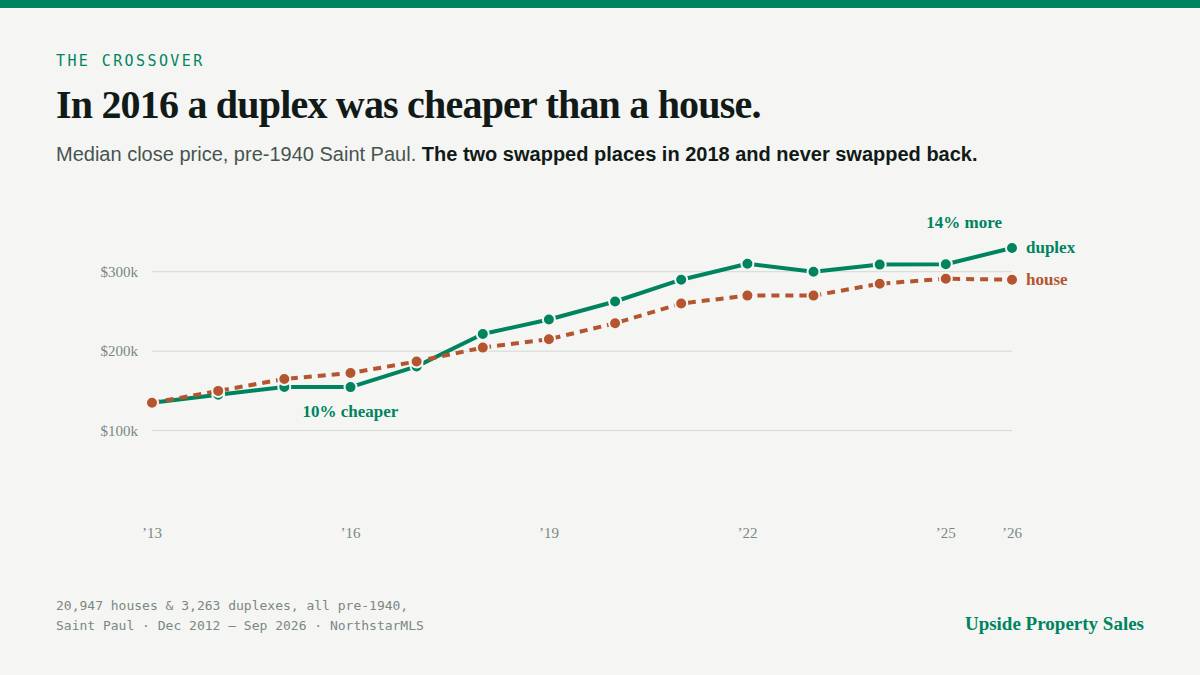
Median close price by year:
Year House Duplex Duplex premium
2013 $135,000 $135,000 0%
2015 $165,000 $155,000 -6%
2016 $172,500 $154,700 -10%
2018 $204,500 $221,600 +8%
2021 $260,000 $290,000 +12%
2024 $285,000 $309,000 +8%
2026 $290,000 $329,900 +14%
Duplexes went from a 10% discount to a 14% premium. That repricing is a large share of the measured advantage, and it's a one-time event. If you're underwriting a duplex today expecting 1.4 points of outperformance, you're extrapolating a re-rating that already happened.
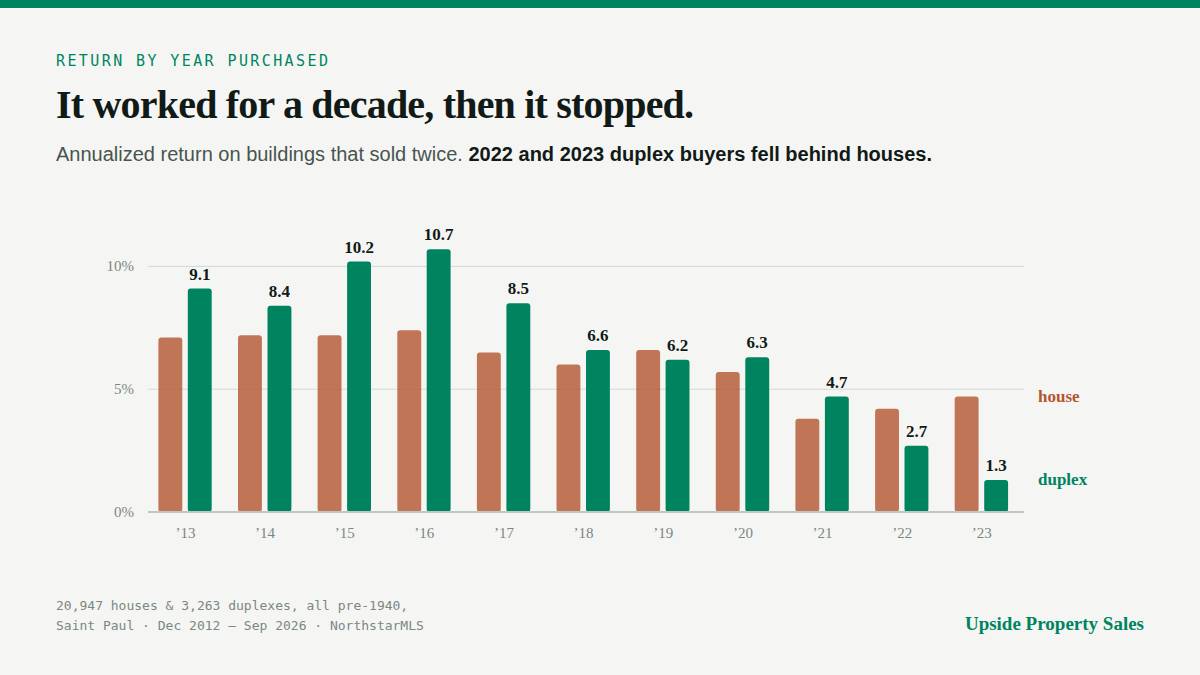
BY PURCHASE YEAR (annualized, house vs duplex)
2013: 7.1% / 9.1%
2014: 7.2% / 8.4%
2015: 7.2% / 10.2%
2016: 7.4% / 10.7%
2017: 6.5% / 8.5%
2018: 6.0% / 6.6%
2019: 6.6% / 6.2%
2020: 5.7% / 6.3%
2021: 3.8% / 4.7%
2022: 4.2% / 2.7%
2023: 4.7% / 1.3%
Duplexes won 2013 through 2018 and again in 2020-21. They lost 2019 narrowly and lost 2022 and 2023 badly. Those last two cohorts are 20 and 15 duplexes and only include owners who already sold, so they're self-selected toward people with a reason to exit early. I'd call it a warning, not a finding.
PER SQUARE FOOT
2026 medians: houses $207/sf, duplexes $161/sf. Median duplex is 2,112 finished sf against 1,456 for the median house, on lots of 5,140 and 5,227 sf respectively.
So roughly 45% more building on the same lot for 14% more money.
LIQUIDITY
Median days on market:
2013-16: house 33, duplex 41
2017-19: house 18, duplex 19
2020-21: house 13, duplex 16
2022-23: house 12, duplex 21
2024-26: house 15, duplex 29
They converged during the boom and separated badly after. Sale to original list is 100% for houses and 98.9% for duplexes in 2024-26.
WHERE THIS IS INCOMPLETE
1. There's no rent in it. This is the big one. The entire practical case for house hacking is that a tenant covers part of your payment, and I have no rent data. A 1.4 point appreciation edge is small next to what rent does to the math, in either direction. Anyone using this to justify a house hack is using the wrong number.
2. No operating costs. Two furnaces, two kitchens, turnover, vacancy, a rental license and Saint Paul's inspection regime. A house may well win on total cost of ownership and this analysis wouldn't know.
3. Pre-1940 only. Keeping the comparison symmetric cost me Battle Creek, Greater East Side and Highland, where the stock is mostly mid-century. Those are missing from both sides.
4. Selection. A building must sell twice to appear. Owners who bought well and still hold never show up. It applies equally to both groups, which is the main reason I trust the comparison even though I wouldn't lean on either number alone.
5. Condition isn't controlled. If duplexes are more likely to be renovated between sales than houses are, part of the gap is capital rather than market.
What I think this actually establishes is narrow: in pre-war Saint Paul, at the same price point, small multifamily appreciated faster than single family over the last fourteen years, and most of that came from the asset class being repriced rather than the neighborhoods outperforming.
Tear it apart. I'm most interested in whether anyone has a way to get at the rent side, because that's the hole in the middle of this.