Will housing crash in 2026 or has it already crashed? Expert called last two crashes.
Most Popular Reply
Investor · VA · Member since 2015 · 21k+ posts · 19k+ votes
2yQuote from @Jack B.:
This guy called the last two crashes, says there will be one in 2026 too. https://www.thisismoney.co.uk/money/mortgageshome/article-12...
But we have the lowest demand since the 90's, even lower than the 2008 crash. Prices in Seattle dropped 20% since rates went up. Did we already see a crash in 2022 and start a new 18 year cycle?
No one can predict if we will have a crash because there are too many macroeconomic issues.
If the government keeps printing trillions a year then yeah we will not have a crash.
Let me tell you what I am seeing and people can make their own assumptions:
1. Asset based lenders / lender to lender financing (those who provide financing to companies for equipment, operations, etc. They will not touch real estate. They have stopped lending to real estate or even lenders who lend on real estate)
2. Commercial is worse than what the media is telling you. This includes self storage and multifamily. People do not understand how impactful commercial is on the banks. This is a big big deal.
3. A large percentage of small businesses are defaulting on rents and their loans.
4. The job market is seeing multiple applicants per opening. Why? because the only jobs that were hired in last six months were auto unions back to work, government workers and healthcare workers. Other sectors are shedding jobs.
5. Incomes are not keeping up with the cost of housing. It is down from 38% to 32% but its still abnormally high.
6. In order to calm inflation, housing needs to soften as it comprises 30%+. So if housing stays strong, so does inflation and rates will remain higher. Fed will not cut rates if the economy is still "steaming along". Eventually the inflation and high rates is going to have ramifications.
Note this is not in every location nationwide, as some pockets are more resistant and some are less resistant.

7e investments53 Reviews
121 Replies
Quote from @Carlos Ptriawan:
Quote from @V.G Jason:
Quote from @Mike K.:
Quote from @V.G Jason:
Quote from @Jack B.:
Quote from @V.G Jason:
Quote from @David M.:
Agreed. What happens if rates go down? You'd put yours up for sale as you look to buy a new one. Now do you think everyone who puts up for a sale, will buy a new one? I don't, hence why inventory will pick up.
I think there's weak assumption here as thing is more complicated than that. I say every market has to be analyzed mostly the DOM because that would reflect the supply and demand.
We're in extremely weird situation where home price keeps getting bid while rate is high, unemployment is high and rate is high.
Some software analytic company has this metrics called sold/listing ratio which also measures the demand, currently we're in match between buyer and seller.But what you suggested also happened in Q1 2022 where massive supply increases when rate is going to all time low. But that's rare.
You are right, DOM is the best measure of supply and demand. Was working at a mortgage company in 2007 and we started to see DOM rapidly increasing in many markets around the country and SP/LP ratios dropping. I looked at an appraisal last week in a CA market where the SP/LP ratio was around 85%. Big change from multiple offers and selling above LP being typical.
Quote from @Carlos Ptriawan:
Quote from @Engelo Rumora:
Quote from @V.G Jason:
Quote from @Engelo Rumora:
Quote from @Carlos Ptriawan:
Quote from @Engelo Rumora:
In REI it's similar, but a little different due to the fact it's where you live. The primo of primo of areas will go up due to scarcity and it's where you raise your family, the gutter areas will dip. The net maybe unch due to the varying differences at both. When rates go down, you'll see some divestment from high(er) quality REI into other asset forms. And you'll see less total investment into REI(not as low as the last 15 months, but less than pre-2022).
if we are looking at redfin, actually the non-quality housing like in Ohio is having the largest demand compared to the "quality" housing. Many business is also moving to the "non-quality" neighborhood as money is flowing to the cheaper place.
And you're right--Cleveland, Columbus, Detroit have been the most in "demand" by closed deals. But the output is sometimes agnostic to these inputs. We don't see how many offers there are? Deals are going that direction, but that's not entirely synonymous with demand.
I had this discussion with a strong RE company. Sitting on the buy & sell side of some primo markets. I had technically 21 offers for my Miami place, I say less because I use the cash offers as real offers. This in less than 2 days. In Manhattan beach, I beat out 16 other offers so 17 total were made. YoY I think MB is down 15%.
In the Rockies, I beat out 7 other offers. In REI markets, Raleigh earlier in 2023 I was constantly facing 5 offers or more on houses and Nashville, too. Raleigh is slightly negative Yoy price wise. Park City is a great example, YoY it's down 30%+ but you'll still get multiple offers.
In those aforementioned cities, are we seeing double digit offers or high single offers? I'm inclined to think not. So just because the deals have closed and has made it a statistic, it's not necessarily indicating where the true demand has been. I am shopping in Hawaii and can't even get a breath in there's just a ton taken up immediately. I can go to Columbus, Detroit, Cleveland right now and get a deal done by Friday, I can't say the same for Hawaii.
Quote from @Carlos Ptriawan:
Quote from @Paul De Luca:
Quote from @Carlos Ptriawan:
Quote from @Paul De Luca:
Quote from @Jack B.:
This guy called the last two crashes, says there will be one in 2026 too. https://www.thisismoney.co.uk/money/mortgageshome/article-12...
But we have the lowest demand since the 90's, even lower than the 2008 crash. Prices in Seattle dropped 20% since rates went up. Did we already see a crash in 2022 and start a new 18 year cycle?
I read "The Secret Life of Real Estate and Banking" by Philip J Anderson and he frequently cites Fred Harrison's work on the 18 year real estate cycle. The book heavily investigates the 18 year cycle and it's actually really compelling and eye opening. It's a phenomenon that has been observed since 1800 when public land sales began in the United States.
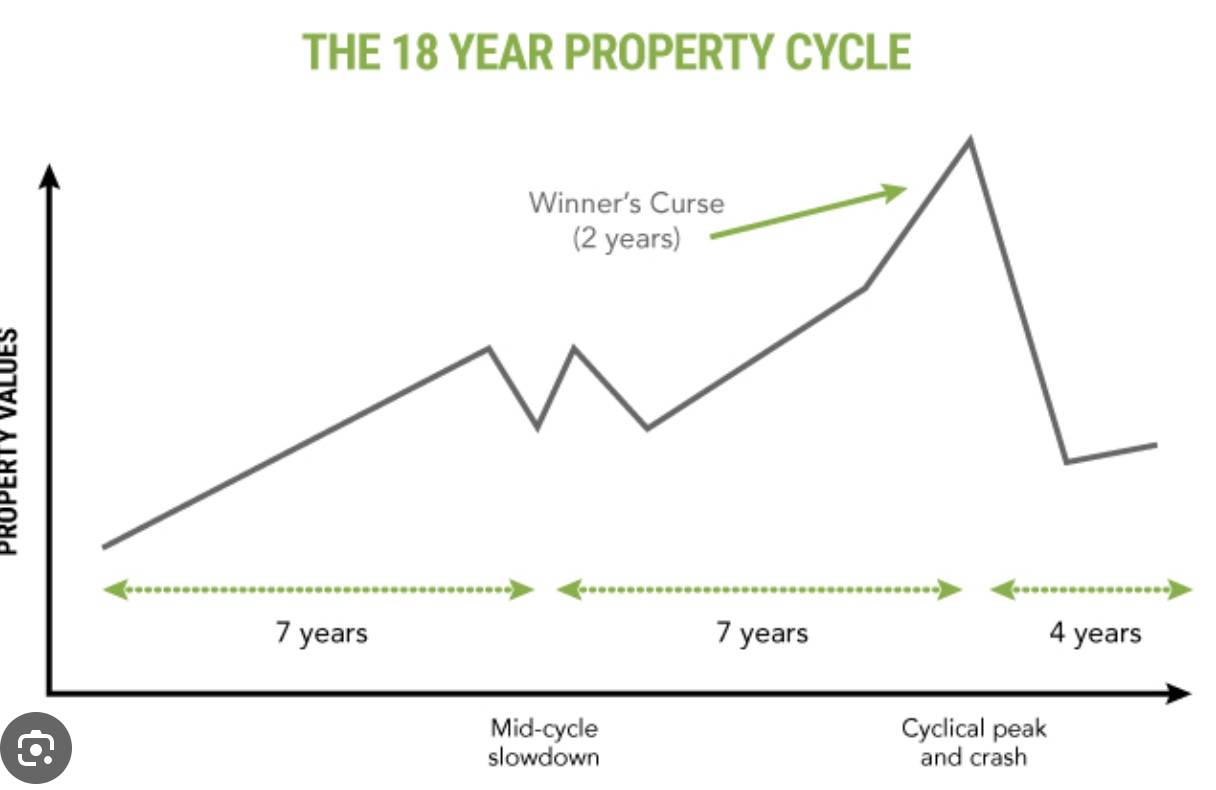
Basically the premise is that the real estate cycle runs roughly in an 18 year term, although sometimes it can be a little bit shorter or longer. From the peak of the cycle, there is about 4 years of a decline or "down" market for real estate values and sales. After 4 years of that, there is generally 14 years of price growth with the last two years called "the winner's curse" where the market sees euphoria, lots of buying and real estate speculation. There is also typically a "mid cycle slowdown" about 7 years in.
The most recent example of this is when home prices peaked in about 2006 in the run up to the Great Recession. 2006 was the peak of the previous cycle in sales and prices.
Then, there was about 4 years of a declining or down market from about 2007 - 2011. Prices then began rising in 2012.
From 2012, we've seen real estate prices consistently trend upward and based on previous historical trends prices should continue increasing until roughly 2026. The pandemic boom (2020-2021) and bust (2022-2023) is the mid-cycle slowdown. A slowdown is usually marked by a rise in interest rates (2022 & 2023) and a decline in sales, which occurred in 2023 with a 28 year low of sales. So going off 2019-2021 and the mid-cycle slow down, we can reasonably expect home price growth to continue until about 2026 and maybe even 2027.
Obviously this isn't a "perfect" model for prediction because none exists. But this is all backed up by historical trends and data. While no cycle is exactly the same, they are fueled by the same human activities and psychology. It can be summed up as "the more things change, the more they stay the same." Society, technology, etc continue changing overtime but the way people act is still fundamentally the same, which is why the cycle will continue.
Summary:
2006: peak of the cycle and beginning of the 18 year cycle repeating itself
2007-2011: 4 years of decline
2012 - 2019: 7 years of an appreciating market plus 2020 & 2021 due to COVID and low rates.
2022-2023: mid cycle slowdown caused by rate hikes but home prices still rising
2024-2026+: Home price growth continues especially due to extremely low inventory, inflation, and other macro factors.
2012 - 2026: generally sees 14 years of price growth, completing the cycle.
Before everyone comes in and starts telling me I'm wrong, I encourage you to read the book and then see if you still feel the same way.

I found it's 15-16 years LOL.
So the first downturn was in 1992, followed by the increase until subprime stopped the party in 2008, then Bernanke Helicopter market saves the market, but Fed trying to increase the rate unsucessfuly in 2019, and then they use the covid inflation to pause the market in 2022.in my own analysis, these cycles are not created by nature but it's intentionally programmed by the Fed.
While it's tempting to believe the Federal Reserve "created" the cycle, that's not true. The real estate cycle in the US was first observed in the 1800s. Land sales began in 1800 and first peaked in 1818 and the panic of 1819 followed. Then the cycle again repeated by peaking in 1836 and then the panic of 1837 occurred.
The Federal Reserve does have an effect on the cycle, potentially lengthening it or shortening it by manipulating the money supply and interest rates, but ultimately the Fed does not control the real estate cycle.
i think bigger question is.
a- when is the wave of 2009 ended ? is it at 2022 ? we do have mini crash in Q1 2022.
b- if yes then shall we purchase in 2023 or we should wait for further crash ? lolI'm really not sure about (b)
We saw mini crash Q4 2022. That may be the real reckoning of RE.
- Lender · United States · Member since 2020 · 1k+ posts · 499 votes2y
As someone who does mortgages in 45 states, no. The market hasn't "crashed". Sure, some investors are overly optimistic and value their properties 10-15% higher than the appraised value, but that's always been part of the game.
It's important to not look at the market in your backyard and think that determine the entire market. Folks have been fleeing super expensive places like Seattle and CA for places like AZ, TX, and FL.
It's a game of supply and demand, like it's always been.
Also, praising folks for being correct the last two doesn't make sense. What if he predicted it 15 times and it finally happen? It's like Robert Kiyosaki. He predicts a crash is around the corner often. Months go by, it doesn't happen, then he deletes the tweet. Eventually it will happen and he'll demand praise for being a genius.
Quote from @Engelo Rumora:
Quote from @V.G Jason:
Quote from @Engelo Rumora:
Quote from @Carlos Ptriawan:
Quote from @Engelo Rumora:
Quote from @Jack B.:
This guy called the last two crashes, says there will be one in 2026 too. https://www.thisismoney.co.uk/money/mortgageshome/article-12...
But we have the lowest demand since the 90's, even lower than the 2008 crash. Prices in Seattle dropped 20% since rates went up. Did we already see a crash in 2022 and start a new 18 year cycle?
Hey mate,
Here is my prediction lol
1) Lot's of pent up demand. Folks not selling due to low fixed interest rates. Folks can't buy due to lack of inventory and can't burrow as much due to high interest rates.
2) Over 4trillion sitting in money market accounts and ready to be deployed.
3) Fed starts reducing rates 3rd and 4th quarter this year.
4) Flood gates open for real estate again and activity starts.
5) Crypto boom after BTC halving (Already started last year).
6) Stock boom with AI and lower interest rates (Will become bubble IMO like Dotcom days).
7) Trump wins office and lowers company taxes.
8) War between Ukraine and Russia ends sending oil prices lower and inflation lower.
Next 2 years or so we could see a big boom across the board and if we do, I'd start getting worried that in late 2025 or 2026 something was bound to happen.
An unpredictable "Black Swan" kind off event per se.
So let's see how things unfold but interesting times for sure.
Just my opinion mate so take it with a grain of Pink Himalayan Salt lol
Thanks
my pinky salt also saying that money market money would move to real estate again after they just slightly reducing the rate.
we're at pivot in US economy where most real business can't survive 5% rate while all other investment BS like stock/RE/crypto is all at all time high LOL
It's all very weird mate and I'm having a tough time putting my pink finger on it hehe
MM moving into RE but also AI boom.
"Buy low, sell high" doesn't work for most.
They will chase the Nvidia's even tho that ship sailed years ago and is a Titanic short term IMO
It's not that weird, but definitely not normal.
When rates are high it's simply a flight to quality, when rates get lower you'll take more spec investments. For a NVIDIA example, you'll buy NVIDIA for it's cash flow and quality today. When rates dip, you'll sell NVIDIA and go into a small-cap growth stock or an emerging market etf/stock that could blow out. The top 6, forget TESLA it's not quality right now, are tilting the boat as we've seen. It's simply-- you're being paid to not take risk. That's all there is to it.
In REI it's similar, but a little different due to the fact it's where you live. The primo of primo of areas will go up due to scarcity and it's where you raise your family, the gutter areas will dip. The net maybe unch due to the varying differences at both. When rates go down, you'll see some divestment from high(er) quality REI into other asset forms. And you'll see less total investment into REI(not as low as the last 15 months, but less than pre-2022).
Indeed mate but at what cost?
"Quality" comes at a premium.
I've always preferred looking for quality at a discount.
For example, I'm heavy into regional banks now as IMO they are the back bone of small business.
Most of us small business owners prefer working with them due to proximity, better rates and service and the relational value they offer just to name a few.
Market has been dented due to the SVB, First Republic and now NYCB fiasco, etc...
Not systematic and just poor risk assessment by management.
A large majority are well capitalized, grow revenue, grow profits, pay dividends, set aside plenty of cash reserves for commercial loan BULLS#@% and trade at 2-3 times lower than book value.
So in my eyes this is quality at a discount but I could be wrong lol
I'll either be a "HERO" or "ZERO" with this investment lol
It's foreign investment really that's driving up US equities, particularly in tech. So to answer at what cost--we're looking at completely different variables for someone like you, me, and someone doing really well in Singapore, India, Australia, Switzerland, Germany, etc. Each foreign investment is very different, and each investor is different.
For us, US people it's best to start to probably rotate into other industries like emerging markets, small cap, etc., before the mass do. For international folks, they're not going to get as cute with it. And they'll go simply where it makes sense right then and there. It's really understanding how fixed income is going to work and that'll be key.
- Rental Property Investor · Doylestown, PA · Member since 2008 · 1k+ posts · 1k+ votes2y
Anyone able to predict crashes in the housing market, stock market, gold market, crypto market.... any market, would be the richest person on earth. People seem to forget that markets don't need to crash to correct themselves. They can slow down or go flat for years until inflation/the economy catches up. Doesn't have to be a crash. I'm not saying it won't, I'm just saying, the options aren't just boom or crash.
- Member since 2019 · 7k+ posts · 4k+ votes2y
Quote from @Salvatore Lentini:
Anyone able to predict crashes in the housing market, stock market, gold market, crypto market.... any market, would be the richest person on earth. People seem to forget that markets don't need to crash to correct themselves. They can slow down or go flat for years until inflation/the economy catches up. Doesn't have to be a crash. I'm not saying it won't, I'm just saying, the options aren't just boom or crash.
The Fed itself has its own real estate crash indicator, namely the foreclosure trend, it's at all time low and never spikes up.
- Member since 2019 · 7k+ posts · 4k+ votes2y
Quote from @V.G Jason:
Quote from @Carlos Ptriawan:
Quote from @Engelo Rumora:
Quote from @V.G Jason:
Quote from @Engelo Rumora:
Quote from @Carlos Ptriawan:
Quote from @Engelo Rumora:
In REI it's similar, but a little different due to the fact it's where you live. The primo of primo of areas will go up due to scarcity and it's where you raise your family, the gutter areas will dip. The net maybe unch due to the varying differences at both. When rates go down, you'll see some divestment from high(er) quality REI into other asset forms. And you'll see less total investment into REI(not as low as the last 15 months, but less than pre-2022).
if we are looking at redfin, actually the non-quality housing like in Ohio is having the largest demand compared to the "quality" housing. Many business is also moving to the "non-quality" neighborhood as money is flowing to the cheaper place.
And you're right--Cleveland, Columbus, Detroit have been the most in "demand" by closed deals. But the output is sometimes agnostic to these inputs. We don't see how many offers there are? Deals are going that direction, but that's not entirely synonymous with demand.
I had this discussion with a strong RE company. Sitting on the buy & sell side of some primo markets. I had technically 21 offers for my Miami place, I say less because I use the cash offers as real offers. This in less than 2 days. In Manhattan beach, I beat out 16 other offers so 17 total were made. YoY I think MB is down 15%.
In the Rockies, I beat out 7 other offers. In REI markets, Raleigh earlier in 2023 I was constantly facing 5 offers or more on houses and Nashville, too. Raleigh is slightly negative Yoy price wise. Park City is a great example, YoY it's down 30%+ but you'll still get multiple offers.
In those aforementioned cities, are we seeing double digit offers or high single offers? I'm inclined to think not. So just because the deals have closed and has made it a statistic, it's not necessarily indicating where the true demand has been. I am shopping in Hawaii and can't even get a breath in there's just a ton taken up immediately. I can go to Columbus, Detroit, Cleveland right now and get a deal done by Friday, I can't say the same for Hawaii.
Lets do this objectively using data with same set of indicator, lets compre Raleigh vs Columbus.
Lets use the "Offer above asking" Percentage from Redfin data.
https://www.redfin.com/city/35711/NC/Raleigh/housing-market#...
So Raleigh is siting at 19% and Columbus at 31% , there's greater demand in Columbus.
- Member since 2019 · 7k+ posts · 4k+ votes2y
Quote from @Mike K.:
Quote from @Carlos Ptriawan:
Quote from @V.G Jason:
Quote from @Mike K.:
Quote from @V.G Jason:
Quote from @Jack B.:
Quote from @V.G Jason:
Quote from @David M.:
Agreed. What happens if rates go down? You'd put yours up for sale as you look to buy a new one. Now do you think everyone who puts up for a sale, will buy a new one? I don't, hence why inventory will pick up.
I think there's weak assumption here as thing is more complicated than that. I say every market has to be analyzed mostly the DOM because that would reflect the supply and demand.
We're in extremely weird situation where home price keeps getting bid while rate is high, unemployment is high and rate is high.
Some software analytic company has this metrics called sold/listing ratio which also measures the demand, currently we're in match between buyer and seller.But what you suggested also happened in Q1 2022 where massive supply increases when rate is going to all time low. But that's rare.
You are right, DOM is the best measure of supply and demand. Was working at a mortgage company in 2007 and we started to see DOM rapidly increasing in many markets around the country and SP/LP ratios dropping. I looked at an appraisal last week in a CA market where the SP/LP ratio was around 85%. Big change from multiple offers and selling above LP being typical.
As human we would like to see and create "What-IF -->then" then this what happen.
Unfortunately these days local market are so mixed up with so many characteristics where the trend keeps changing. People is debating using secondary weak indicator. It is like arguig is stock that has better P/E or P/S would raise in value ?
While more straightforward DOM and SL/L has been exist for a while to measure demand in local real estate. Quote from @Carlos Ptriawan:
Quote from @V.G Jason:
Quote from @Carlos Ptriawan:
Quote from @Engelo Rumora:
Quote from @V.G Jason:
Quote from @Engelo Rumora:
Quote from @Carlos Ptriawan:
Quote from @Engelo Rumora:
In REI it's similar, but a little different due to the fact it's where you live. The primo of primo of areas will go up due to scarcity and it's where you raise your family, the gutter areas will dip. The net maybe unch due to the varying differences at both. When rates go down, you'll see some divestment from high(er) quality REI into other asset forms. And you'll see less total investment into REI(not as low as the last 15 months, but less than pre-2022).
if we are looking at redfin, actually the non-quality housing like in Ohio is having the largest demand compared to the "quality" housing. Many business is also moving to the "non-quality" neighborhood as money is flowing to the cheaper place.
And you're right--Cleveland, Columbus, Detroit have been the most in "demand" by closed deals. But the output is sometimes agnostic to these inputs. We don't see how many offers there are? Deals are going that direction, but that's not entirely synonymous with demand.
I had this discussion with a strong RE company. Sitting on the buy & sell side of some primo markets. I had technically 21 offers for my Miami place, I say less because I use the cash offers as real offers. This in less than 2 days. In Manhattan beach, I beat out 16 other offers so 17 total were made. YoY I think MB is down 15%.
In the Rockies, I beat out 7 other offers. In REI markets, Raleigh earlier in 2023 I was constantly facing 5 offers or more on houses and Nashville, too. Raleigh is slightly negative Yoy price wise. Park City is a great example, YoY it's down 30%+ but you'll still get multiple offers.
In those aforementioned cities, are we seeing double digit offers or high single offers? I'm inclined to think not. So just because the deals have closed and has made it a statistic, it's not necessarily indicating where the true demand has been. I am shopping in Hawaii and can't even get a breath in there's just a ton taken up immediately. I can go to Columbus, Detroit, Cleveland right now and get a deal done by Friday, I can't say the same for Hawaii.
Lets do this objectively using data with same set of indicator, lets compre Raleigh vs Columbus.
Lets use the "Offer above asking" Percentage from Redfin data.
https://www.redfin.com/city/35711/NC/Raleigh/housing-market#...
So Raleigh is siting at 19% and Columbus at 31% , there's greater demand in Columbus.
That more or less goes with my point of it being an accounted for statistic--an output. We can't see the inputs. Whose to say there weren't 30 offers at 15% over, versus 10 offers at 31% offer. what would constitute greater demand--the % above asking or the amount of offers?
Given house prices differ from each city, the % is skewed and I'd assume the latter. Which is hard to find data on, can we find that on Redfin?
We do agree though-- Columbus, Cleveland, and Detroit were the most accounted for demand wise. I just am not sure that paints the full picture.
Edit: Go look at San Diego & Los Angeles. Those would be better examples than Raleigh, and attest to true flight to quality. San Diego volume wise is almost identical to Columbus. But again these are all accounted for, I'm talking something we cannot account for so it's a moot point to even bother on.
- Member since 2019 · 7k+ posts · 4k+ votes2y
Quote from @V.G Jason:
Quote from @Carlos Ptriawan:
Quote from @V.G Jason:
Quote from @Carlos Ptriawan:
Quote from @Engelo Rumora:
Quote from @V.G Jason:
Quote from @Engelo Rumora:
Quote from @Carlos Ptriawan:
Quote from @Engelo Rumora:
In REI it's similar, but a little different due to the fact it's where you live. The primo of primo of areas will go up due to scarcity and it's where you raise your family, the gutter areas will dip. The net maybe unch due to the varying differences at both. When rates go down, you'll see some divestment from high(er) quality REI into other asset forms. And you'll see less total investment into REI(not as low as the last 15 months, but less than pre-2022).
if we are looking at redfin, actually the non-quality housing like in Ohio is having the largest demand compared to the "quality" housing. Many business is also moving to the "non-quality" neighborhood as money is flowing to the cheaper place.
And you're right--Cleveland, Columbus, Detroit have been the most in "demand" by closed deals. But the output is sometimes agnostic to these inputs. We don't see how many offers there are? Deals are going that direction, but that's not entirely synonymous with demand.
I had this discussion with a strong RE company. Sitting on the buy & sell side of some primo markets. I had technically 21 offers for my Miami place, I say less because I use the cash offers as real offers. This in less than 2 days. In Manhattan beach, I beat out 16 other offers so 17 total were made. YoY I think MB is down 15%.
In the Rockies, I beat out 7 other offers. In REI markets, Raleigh earlier in 2023 I was constantly facing 5 offers or more on houses and Nashville, too. Raleigh is slightly negative Yoy price wise. Park City is a great example, YoY it's down 30%+ but you'll still get multiple offers.
In those aforementioned cities, are we seeing double digit offers or high single offers? I'm inclined to think not. So just because the deals have closed and has made it a statistic, it's not necessarily indicating where the true demand has been. I am shopping in Hawaii and can't even get a breath in there's just a ton taken up immediately. I can go to Columbus, Detroit, Cleveland right now and get a deal done by Friday, I can't say the same for Hawaii.
Lets do this objectively using data with same set of indicator, lets compre Raleigh vs Columbus.
Lets use the "Offer above asking" Percentage from Redfin data.
https://www.redfin.com/city/35711/NC/Raleigh/housing-market#...
So Raleigh is siting at 19% and Columbus at 31% , there's greater demand in Columbus.
That more or less goes with my point of it being an accounted for statistic--an output. We can't see the inputs. Whose to say there weren't 30 offers at 15% over, versus 10 offers at 31% offer. what would constitute greater demand--the % above asking or the amount of offers?
Given house prices differ from each city, the % is skewed and I'd assume the latter. Which is hard to find data on, can we find that on Redfin?
We do agree though-- Columbus, Cleveland, and Detroit were the most accounted for demand wise. I just am not sure that paints the full picture.
We could see the result of bidding process by using average median price, so we have this data from ZHI:
Columbus OH average price
2023-03 220k
2024-01 233k
13k over 9 months
Raleigh
2023-03 414k
2024-01 427k
13k over 9 monthswell, as we can see the appreciation rate in Columbus is double than the Raleigh because they're cheaper.
....But the winner is still...
San Jose from 1.226 to 1.35k or 125k over 9 months.This is what I've been telling folks to just invest in bay area lol
- Member since 2019 · 7k+ posts · 4k+ votes2y
Quote from @V.G Jason:
Quote from @Carlos Ptriawan:
Quote from @V.G Jason:
Quote from @Carlos Ptriawan:
Edit: Go look at San Diego & Los Angeles. Those would be better examples than Raleigh, and attest to true flight to quality. San Diego volume wise is almost identical to Columbus. But again these are all accounted for, I'm talking something we cannot account for so it's a moot point to even bother on.
That's correct, the home appreciation is still always in CA/HI as big income earner there.
But if we comparing raleigh and columbus apparently money is flowing to midwest as well. Quote from @Carlos Ptriawan:
Quote from @V.G Jason:
Quote from @Carlos Ptriawan:
Quote from @V.G Jason:
Quote from @Carlos Ptriawan:
Quote from @Engelo Rumora:
Quote from @V.G Jason:
Quote from @Engelo Rumora:
Quote from @Carlos Ptriawan:
Quote from @Engelo Rumora:
In REI it's similar, but a little different due to the fact it's where you live. The primo of primo of areas will go up due to scarcity and it's where you raise your family, the gutter areas will dip. The net maybe unch due to the varying differences at both. When rates go down, you'll see some divestment from high(er) quality REI into other asset forms. And you'll see less total investment into REI(not as low as the last 15 months, but less than pre-2022).
if we are looking at redfin, actually the non-quality housing like in Ohio is having the largest demand compared to the "quality" housing. Many business is also moving to the "non-quality" neighborhood as money is flowing to the cheaper place.
And you're right--Cleveland, Columbus, Detroit have been the most in "demand" by closed deals. But the output is sometimes agnostic to these inputs. We don't see how many offers there are? Deals are going that direction, but that's not entirely synonymous with demand.
I had this discussion with a strong RE company. Sitting on the buy & sell side of some primo markets. I had technically 21 offers for my Miami place, I say less because I use the cash offers as real offers. This in less than 2 days. In Manhattan beach, I beat out 16 other offers so 17 total were made. YoY I think MB is down 15%.
In the Rockies, I beat out 7 other offers. In REI markets, Raleigh earlier in 2023 I was constantly facing 5 offers or more on houses and Nashville, too. Raleigh is slightly negative Yoy price wise. Park City is a great example, YoY it's down 30%+ but you'll still get multiple offers.
In those aforementioned cities, are we seeing double digit offers or high single offers? I'm inclined to think not. So just because the deals have closed and has made it a statistic, it's not necessarily indicating where the true demand has been. I am shopping in Hawaii and can't even get a breath in there's just a ton taken up immediately. I can go to Columbus, Detroit, Cleveland right now and get a deal done by Friday, I can't say the same for Hawaii.
Lets do this objectively using data with same set of indicator, lets compre Raleigh vs Columbus.
Lets use the "Offer above asking" Percentage from Redfin data.
https://www.redfin.com/city/35711/NC/Raleigh/housing-market#...
So Raleigh is siting at 19% and Columbus at 31% , there's greater demand in Columbus.
That more or less goes with my point of it being an accounted for statistic--an output. We can't see the inputs. Whose to say there weren't 30 offers at 15% over, versus 10 offers at 31% offer. what would constitute greater demand--the % above asking or the amount of offers?
Given house prices differ from each city, the % is skewed and I'd assume the latter. Which is hard to find data on, can we find that on Redfin?
We do agree though-- Columbus, Cleveland, and Detroit were the most accounted for demand wise. I just am not sure that paints the full picture.
We could see the result of bidding process by using average median price, so we have this data from ZHI:
Columbus OH average price
2023-03 220k
2024-01 233k
13k over 9 months
Raleigh
2023-03 414k
2024-01 427k
13k over 9 monthswell, as we can see the appreciation rate in Columbus is double than the Raleigh because they're cheaper.
....But the winner is still...
San Jose from 1.226 to 1.35k or 125k over 9 months.This is what I've been telling folks to just invest in bay area lol
But.....You are looking at historic appreciation rates. I'm in Columbus market and I can't find a property even approaching a positive cash flow, unless it's in the low income neighborhoods. I'm not comfortable buying a property with a negative $500 cash flow hoping future appreciation will cover the loss. I think a crash is not likely, but a correction is probable in the next 24 months in most markets.
- 2yNicholas L.Pro MemberFlipper/Rehabber · Pittsburgh · Member since 2018 · 6k+ posts · 5k+ votes
the best deals are off-market. start going to REIA meetings, networking, meeting other investors. can you house hack? if you can house hack, house hack. if you can't house hack, don't house hack. but investing right now is going to take patience, money, and maybe creativity.
as i think i stated earlier in the thread, 'price' is pretty irrelevant to many of us who buy and hold. i couldn't care less what the 'price' is, or what the 'Zestimate' is, i want my rentals to be high quality (which they are) and reasonably priced (which they are) such that they are in high demand (which they are). if the market 'crashes,' that would be bad. if it 'corrects', it will have no impact.
- Member since 2019 · 7k+ posts · 4k+ votes2y
Quote from @Mike K.:
Quote from @Carlos Ptriawan:
Quote from @V.G Jason:
Quote from @Carlos Ptriawan:
Quote from @V.G Jason:
Quote from @Carlos Ptriawan:
Quote from @Engelo Rumora:
Quote from @V.G Jason:
Quote from @Engelo Rumora:
Quote from @Carlos Ptriawan:
Quote from @Engelo Rumora:
In REI it's similar, but a little different due to the fact it's where you live. The primo of primo of areas will go up due to scarcity and it's where you raise your family, the gutter areas will dip. The net maybe unch due to the varying differences at both. When rates go down, you'll see some divestment from high(er) quality REI into other asset forms. And you'll see less total investment into REI(not as low as the last 15 months, but less than pre-2022).
if we are looking at redfin, actually the non-quality housing like in Ohio is having the largest demand compared to the "quality" housing. Many business is also moving to the "non-quality" neighborhood as money is flowing to the cheaper place.
And you're right--Cleveland, Columbus, Detroit have been the most in "demand" by closed deals. But the output is sometimes agnostic to these inputs. We don't see how many offers there are? Deals are going that direction, but that's not entirely synonymous with demand.
I had this discussion with a strong RE company. Sitting on the buy & sell side of some primo markets. I had technically 21 offers for my Miami place, I say less because I use the cash offers as real offers. This in less than 2 days. In Manhattan beach, I beat out 16 other offers so 17 total were made. YoY I think MB is down 15%.
In the Rockies, I beat out 7 other offers. In REI markets, Raleigh earlier in 2023 I was constantly facing 5 offers or more on houses and Nashville, too. Raleigh is slightly negative Yoy price wise. Park City is a great example, YoY it's down 30%+ but you'll still get multiple offers.
In those aforementioned cities, are we seeing double digit offers or high single offers? I'm inclined to think not. So just because the deals have closed and has made it a statistic, it's not necessarily indicating where the true demand has been. I am shopping in Hawaii and can't even get a breath in there's just a ton taken up immediately. I can go to Columbus, Detroit, Cleveland right now and get a deal done by Friday, I can't say the same for Hawaii.
Lets do this objectively using data with same set of indicator, lets compre Raleigh vs Columbus.
Lets use the "Offer above asking" Percentage from Redfin data.
https://www.redfin.com/city/35711/NC/Raleigh/housing-market#...
So Raleigh is siting at 19% and Columbus at 31% , there's greater demand in Columbus.
That more or less goes with my point of it being an accounted for statistic--an output. We can't see the inputs. Whose to say there weren't 30 offers at 15% over, versus 10 offers at 31% offer. what would constitute greater demand--the % above asking or the amount of offers?
Given house prices differ from each city, the % is skewed and I'd assume the latter. Which is hard to find data on, can we find that on Redfin?
We do agree though-- Columbus, Cleveland, and Detroit were the most accounted for demand wise. I just am not sure that paints the full picture.
We could see the result of bidding process by using average median price, so we have this data from ZHI:
Columbus OH average price
2023-03 220k
2024-01 233k
13k over 9 months
Raleigh
2023-03 414k
2024-01 427k
13k over 9 monthswell, as we can see the appreciation rate in Columbus is double than the Raleigh because they're cheaper.
....But the winner is still...
San Jose from 1.226 to 1.35k or 125k over 9 months.This is what I've been telling folks to just invest in bay area lol
But.....You are looking at historic appreciation rates. I'm in Columbus market and I can't find a property even approaching a positive cash flow, unless it's in the low income neighborhoods. I'm not comfortable buying a property with a negative $500 cash flow hoping future appreciation will cover the loss. I think a crash is not likely, but a correction is probable in the next 24 months in most markets.
you may not get it but if you can't get cash flow that's good sign meaning appreciation rate is running faster than cash flow rate lol , it is simply math problem, has nothing to do with ohio or seoul.
- Member since 2019 · 7k+ posts · 4k+ votes2y
Quote from @Nicholas L.:
the best deals are off-market. start going to REIA meetings, networking, meeting other investors. can you house hack? if you can house hack, house hack. if you can't house hack, don't house hack. but investing right now is going to take patience, money, and maybe creativity.
as i think i stated earlier in the thread, 'price' is pretty irrelevant to many of us who buy and hold. i couldn't care less what the 'price' is, or what the 'Zestimate' is, i want my rentals to be high quality (which they are) and reasonably priced (which they are) such that they are in high demand (which they are). if the market 'crashes,' that would be bad. if it 'corrects', it will have no impact.
in our market everything is in mls because even burnt down house has receive multiple bids lol but yes like in other thread, 2024 feels like the beginning of 2021 again, this market never tired. every month we got outbid.
- Member since 2019 · 7k+ posts · 4k+ votes2y
Also these days I found "attractive investment" is almost always be found by very experienced sponsor that able to gain incredible financing or seller financing or continue assume the low interest rate from previous owner and so on.
Quote from @Mike K.:
Quote from @Carlos Ptriawan:
Quote from @V.G Jason:
Quote from @Carlos Ptriawan:
Quote from @V.G Jason:
Quote from @Carlos Ptriawan:
Quote from @Engelo Rumora:
Quote from @V.G Jason:
Quote from @Engelo Rumora:
Quote from @Carlos Ptriawan:
Quote from @Engelo Rumora:
In REI it's similar, but a little different due to the fact it's where you live. The primo of primo of areas will go up due to scarcity and it's where you raise your family, the gutter areas will dip. The net maybe unch due to the varying differences at both. When rates go down, you'll see some divestment from high(er) quality REI into other asset forms. And you'll see less total investment into REI(not as low as the last 15 months, but less than pre-2022).
if we are looking at redfin, actually the non-quality housing like in Ohio is having the largest demand compared to the "quality" housing. Many business is also moving to the "non-quality" neighborhood as money is flowing to the cheaper place.
And you're right--Cleveland, Columbus, Detroit have been the most in "demand" by closed deals. But the output is sometimes agnostic to these inputs. We don't see how many offers there are? Deals are going that direction, but that's not entirely synonymous with demand.
I had this discussion with a strong RE company. Sitting on the buy & sell side of some primo markets. I had technically 21 offers for my Miami place, I say less because I use the cash offers as real offers. This in less than 2 days. In Manhattan beach, I beat out 16 other offers so 17 total were made. YoY I think MB is down 15%.
In the Rockies, I beat out 7 other offers. In REI markets, Raleigh earlier in 2023 I was constantly facing 5 offers or more on houses and Nashville, too. Raleigh is slightly negative Yoy price wise. Park City is a great example, YoY it's down 30%+ but you'll still get multiple offers.
In those aforementioned cities, are we seeing double digit offers or high single offers? I'm inclined to think not. So just because the deals have closed and has made it a statistic, it's not necessarily indicating where the true demand has been. I am shopping in Hawaii and can't even get a breath in there's just a ton taken up immediately. I can go to Columbus, Detroit, Cleveland right now and get a deal done by Friday, I can't say the same for Hawaii.
Lets do this objectively using data with same set of indicator, lets compre Raleigh vs Columbus.
Lets use the "Offer above asking" Percentage from Redfin data.
https://www.redfin.com/city/35711/NC/Raleigh/housing-market#...
So Raleigh is siting at 19% and Columbus at 31% , there's greater demand in Columbus.
That more or less goes with my point of it being an accounted for statistic--an output. We can't see the inputs. Whose to say there weren't 30 offers at 15% over, versus 10 offers at 31% offer. what would constitute greater demand--the % above asking or the amount of offers?
Given house prices differ from each city, the % is skewed and I'd assume the latter. Which is hard to find data on, can we find that on Redfin?
We do agree though-- Columbus, Cleveland, and Detroit were the most accounted for demand wise. I just am not sure that paints the full picture.
We could see the result of bidding process by using average median price, so we have this data from ZHI:
Columbus OH average price
2023-03 220k
2024-01 233k
13k over 9 months
Raleigh
2023-03 414k
2024-01 427k
13k over 9 monthswell, as we can see the appreciation rate in Columbus is double than the Raleigh because they're cheaper.
....But the winner is still...
San Jose from 1.226 to 1.35k or 125k over 9 months.This is what I've been telling folks to just invest in bay area lol
But.....You are looking at historic appreciation rates. I'm in Columbus market and I can't find a property even approaching a positive cash flow, unless it's in the low income neighborhoods. I'm not comfortable buying a property with a negative $500 cash flow hoping future appreciation will cover the loss. I think a crash is not likely, but a correction is probable in the next 24 months in most markets.
That's all markets. And 24 months shouldn't impact you, if you're investing for the long term. You want to be mindful of the median income in Columbus, and is it sustainable for the house prices that are there. I believe they are without taking a glance.
Buying intrinsic is a rarity, I think the yester-years confused a lot of folks. If you're able to get "creative" and get it done-- hats off to you. But the reality of your headwinds is for everyone. It doesn't make it a net bad investment, you're having to see what you're getting into and the underlying reason why. If it's instant cash flow, it's not real estate. If it's a hard asset, hard to beat real estate as a normal US citizen.
- Member since 2019 · 7k+ posts · 4k+ votes2y
Quote from @V.G Jason:
Quote from @Mike K.:
Quote from @Carlos Ptriawan:
Quote from @V.G Jason:
Quote from @Carlos Ptriawan:
Quote from @V.G Jason:
Quote from @Carlos Ptriawan:
Quote from @Engelo Rumora:
Quote from @V.G Jason:
Quote from @Engelo Rumora:
Quote from @Carlos Ptriawan:
Quote from @Engelo Rumora:
In REI it's similar, but a little different due to the fact it's where you live. The primo of primo of areas will go up due to scarcity and it's where you raise your family, the gutter areas will dip. The net maybe unch due to the varying differences at both. When rates go down, you'll see some divestment from high(er) quality REI into other asset forms. And you'll see less total investment into REI(not as low as the last 15 months, but less than pre-2022).
if we are looking at redfin, actually the non-quality housing like in Ohio is having the largest demand compared to the "quality" housing. Many business is also moving to the "non-quality" neighborhood as money is flowing to the cheaper place.
And you're right--Cleveland, Columbus, Detroit have been the most in "demand" by closed deals. But the output is sometimes agnostic to these inputs. We don't see how many offers there are? Deals are going that direction, but that's not entirely synonymous with demand.
I had this discussion with a strong RE company. Sitting on the buy & sell side of some primo markets. I had technically 21 offers for my Miami place, I say less because I use the cash offers as real offers. This in less than 2 days. In Manhattan beach, I beat out 16 other offers so 17 total were made. YoY I think MB is down 15%.
In the Rockies, I beat out 7 other offers. In REI markets, Raleigh earlier in 2023 I was constantly facing 5 offers or more on houses and Nashville, too. Raleigh is slightly negative Yoy price wise. Park City is a great example, YoY it's down 30%+ but you'll still get multiple offers.
In those aforementioned cities, are we seeing double digit offers or high single offers? I'm inclined to think not. So just because the deals have closed and has made it a statistic, it's not necessarily indicating where the true demand has been. I am shopping in Hawaii and can't even get a breath in there's just a ton taken up immediately. I can go to Columbus, Detroit, Cleveland right now and get a deal done by Friday, I can't say the same for Hawaii.
Lets do this objectively using data with same set of indicator, lets compre Raleigh vs Columbus.
Lets use the "Offer above asking" Percentage from Redfin data.
https://www.redfin.com/city/35711/NC/Raleigh/housing-market#...
So Raleigh is siting at 19% and Columbus at 31% , there's greater demand in Columbus.
That more or less goes with my point of it being an accounted for statistic--an output. We can't see the inputs. Whose to say there weren't 30 offers at 15% over, versus 10 offers at 31% offer. what would constitute greater demand--the % above asking or the amount of offers?
Given house prices differ from each city, the % is skewed and I'd assume the latter. Which is hard to find data on, can we find that on Redfin?
We do agree though-- Columbus, Cleveland, and Detroit were the most accounted for demand wise. I just am not sure that paints the full picture.
We could see the result of bidding process by using average median price, so we have this data from ZHI:
Columbus OH average price
2023-03 220k
2024-01 233k
13k over 9 months
Raleigh
2023-03 414k
2024-01 427k
13k over 9 monthswell, as we can see the appreciation rate in Columbus is double than the Raleigh because they're cheaper.
....But the winner is still...
San Jose from 1.226 to 1.35k or 125k over 9 months.This is what I've been telling folks to just invest in bay area lol
But.....You are looking at historic appreciation rates. I'm in Columbus market and I can't find a property even approaching a positive cash flow, unless it's in the low income neighborhoods. I'm not comfortable buying a property with a negative $500 cash flow hoping future appreciation will cover the loss. I think a crash is not likely, but a correction is probable in the next 24 months in most markets.
That's all markets. And 24 months shouldn't impact you, if you're investing for the long term. You want to be mindful of the median income in Columbus, and is it sustainable for the house prices that are there. I believe they are without taking a glance.
Buying intrinsic is a rarity, I think the yester-years confused a lot of folks. If you're able to get "creative" and get it done-- hats off to you. But the reality of your headwinds is for everyone. It doesn't make it a net bad investment, you're having to see what you're getting into and the underlying reason why. If it's instant cash flow, it's not real estate. If it's a hard asset, hard to beat real estate as a normal US citizen.
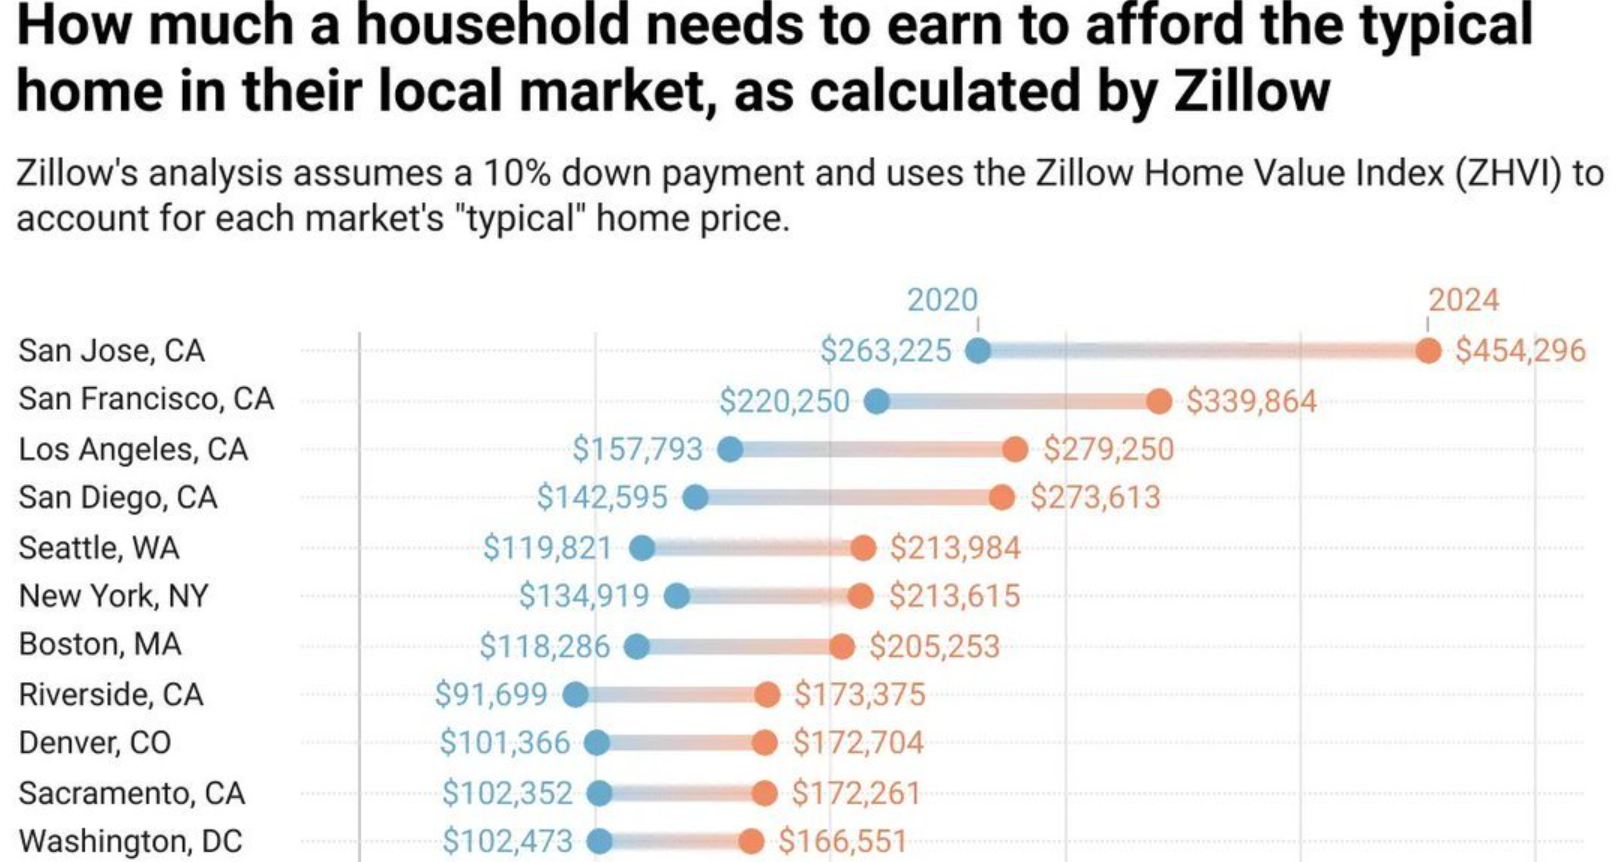
Also if we see the rise of actual income level, these stats are not surprising how SJ becomes the highest zip code in the country. The actual income is way higher than actually reported hence bank allows such mortgage, this is what makes the RE is un-crash-able yet so far.

Quote from @Carlos Ptriawan:
Quote from @V.G Jason:
Quote from @Mike K.:
Quote from @Carlos Ptriawan:
Quote from @V.G Jason:
Quote from @Carlos Ptriawan:
Quote from @V.G Jason:
Quote from @Carlos Ptriawan:
Quote from @Engelo Rumora:
Quote from @V.G Jason:
Quote from @Engelo Rumora:
Quote from @Carlos Ptriawan:
Quote from @Engelo Rumora:
In REI it's similar, but a little different due to the fact it's where you live. The primo of primo of areas will go up due to scarcity and it's where you raise your family, the gutter areas will dip. The net maybe unch due to the varying differences at both. When rates go down, you'll see some divestment from high(er) quality REI into other asset forms. And you'll see less total investment into REI(not as low as the last 15 months, but less than pre-2022).
if we are looking at redfin, actually the non-quality housing like in Ohio is having the largest demand compared to the "quality" housing. Many business is also moving to the "non-quality" neighborhood as money is flowing to the cheaper place.
And you're right--Cleveland, Columbus, Detroit have been the most in "demand" by closed deals. But the output is sometimes agnostic to these inputs. We don't see how many offers there are? Deals are going that direction, but that's not entirely synonymous with demand.
I had this discussion with a strong RE company. Sitting on the buy & sell side of some primo markets. I had technically 21 offers for my Miami place, I say less because I use the cash offers as real offers. This in less than 2 days. In Manhattan beach, I beat out 16 other offers so 17 total were made. YoY I think MB is down 15%.
In the Rockies, I beat out 7 other offers. In REI markets, Raleigh earlier in 2023 I was constantly facing 5 offers or more on houses and Nashville, too. Raleigh is slightly negative Yoy price wise. Park City is a great example, YoY it's down 30%+ but you'll still get multiple offers.
In those aforementioned cities, are we seeing double digit offers or high single offers? I'm inclined to think not. So just because the deals have closed and has made it a statistic, it's not necessarily indicating where the true demand has been. I am shopping in Hawaii and can't even get a breath in there's just a ton taken up immediately. I can go to Columbus, Detroit, Cleveland right now and get a deal done by Friday, I can't say the same for Hawaii.
Lets do this objectively using data with same set of indicator, lets compre Raleigh vs Columbus.
Lets use the "Offer above asking" Percentage from Redfin data.
https://www.redfin.com/city/35711/NC/Raleigh/housing-market#...
So Raleigh is siting at 19% and Columbus at 31% , there's greater demand in Columbus.
That more or less goes with my point of it being an accounted for statistic--an output. We can't see the inputs. Whose to say there weren't 30 offers at 15% over, versus 10 offers at 31% offer. what would constitute greater demand--the % above asking or the amount of offers?
Given house prices differ from each city, the % is skewed and I'd assume the latter. Which is hard to find data on, can we find that on Redfin?
We do agree though-- Columbus, Cleveland, and Detroit were the most accounted for demand wise. I just am not sure that paints the full picture.
We could see the result of bidding process by using average median price, so we have this data from ZHI:
Columbus OH average price
2023-03 220k
2024-01 233k
13k over 9 months
Raleigh
2023-03 414k
2024-01 427k
13k over 9 monthswell, as we can see the appreciation rate in Columbus is double than the Raleigh because they're cheaper.
....But the winner is still...
San Jose from 1.226 to 1.35k or 125k over 9 months.This is what I've been telling folks to just invest in bay area lol
But.....You are looking at historic appreciation rates. I'm in Columbus market and I can't find a property even approaching a positive cash flow, unless it's in the low income neighborhoods. I'm not comfortable buying a property with a negative $500 cash flow hoping future appreciation will cover the loss. I think a crash is not likely, but a correction is probable in the next 24 months in most markets.
That's all markets. And 24 months shouldn't impact you, if you're investing for the long term. You want to be mindful of the median income in Columbus, and is it sustainable for the house prices that are there. I believe they are without taking a glance.
Buying intrinsic is a rarity, I think the yester-years confused a lot of folks. If you're able to get "creative" and get it done-- hats off to you. But the reality of your headwinds is for everyone. It doesn't make it a net bad investment, you're having to see what you're getting into and the underlying reason why. If it's instant cash flow, it's not real estate. If it's a hard asset, hard to beat real estate as a normal US citizen.
Also if we see the rise of actual income level, these stats are not surprising how SJ becomes the highest zip code in the country. The actual income is way higher than actually reported hence bank allows such mortgage, this is what makes the RE is un-crash-able yet so far.
100%. There's always outliers, but the bold is more or less going to put the input to deliver the output of price levels. And those names on that list are ringing true from it. Is that list just domestic 48, or where does Hawaii sit in this?
Join the conversationCreate a free account to reply, vote on answers and follow this thread.