Found a property in LV but worried about peak
Most Popular Reply
Eric FernwoodBusiness Member
Realtor · Las Vegas, NV · Member since 2014 · 1k+ posts · 1k+ votesHello @Jack B.
We just conducted our Q1 Las Vegas Investor Update and below are our findings.
Market Update
Note that the following data comes from the Las Vegas MLS and is only for properties that conform to our target tenant pool.
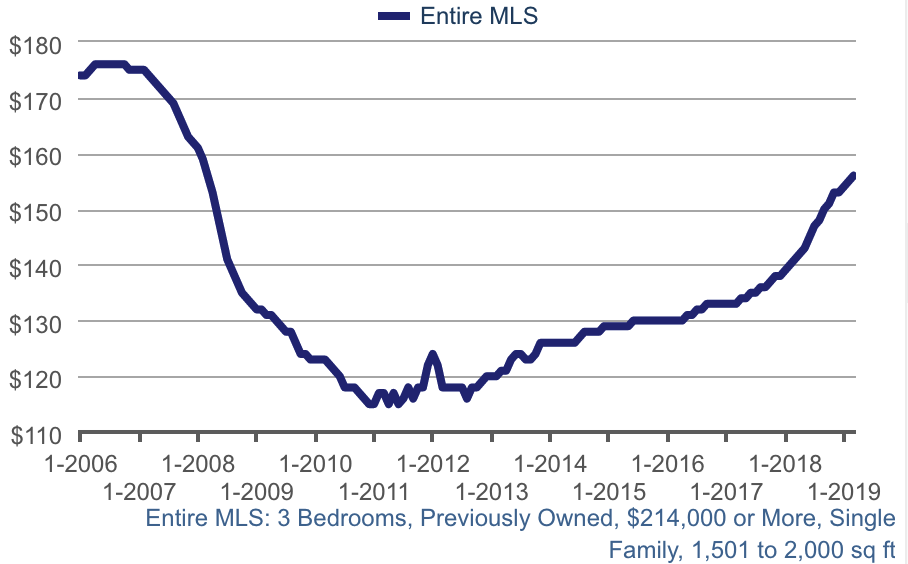
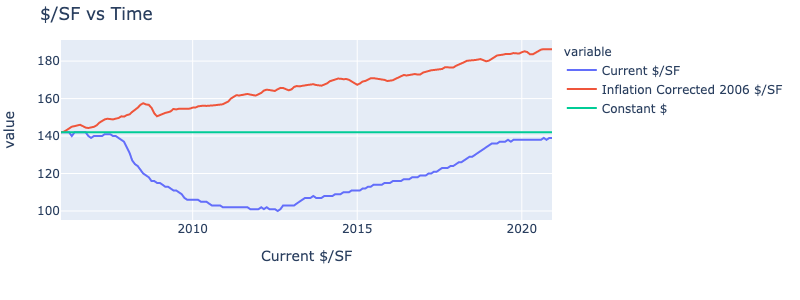
Median $/SqFt for Single Family Homes - The $/SqFt continues to rise. We expect the rate to increase towards the end of the year, likely driven by Californians looking for a more cost effective place to live. Already 30% of all sales today are to Californians. Also, we are still 20% below the peak prices of 2006. If you take inflation into account we are about 35% below peak 2006 prices.
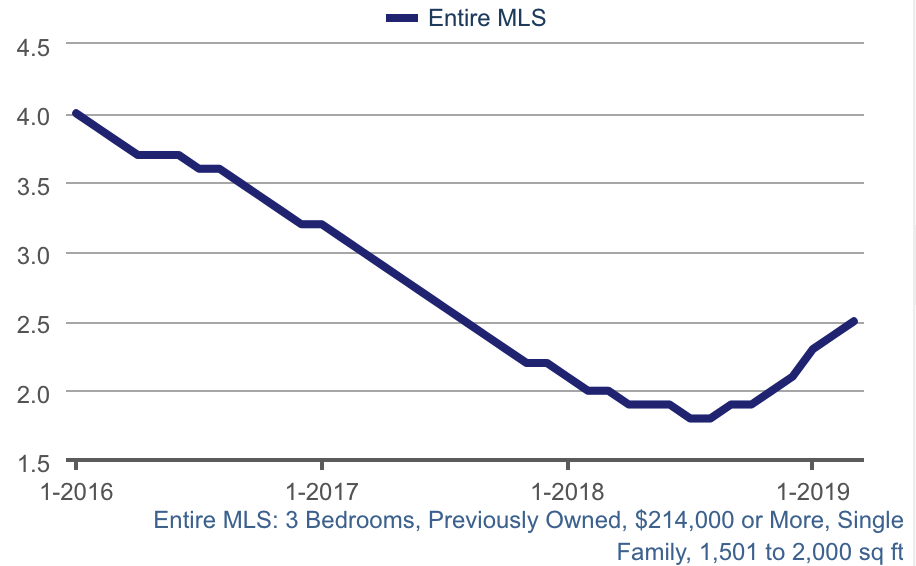
Months of Supply - The months supply of properties has risen since late 2018, but still below 3 months where 6 months is considered a balanced market. The effect of the increased supply is that we are seeing increasing ROI and facing less competition from buyers.
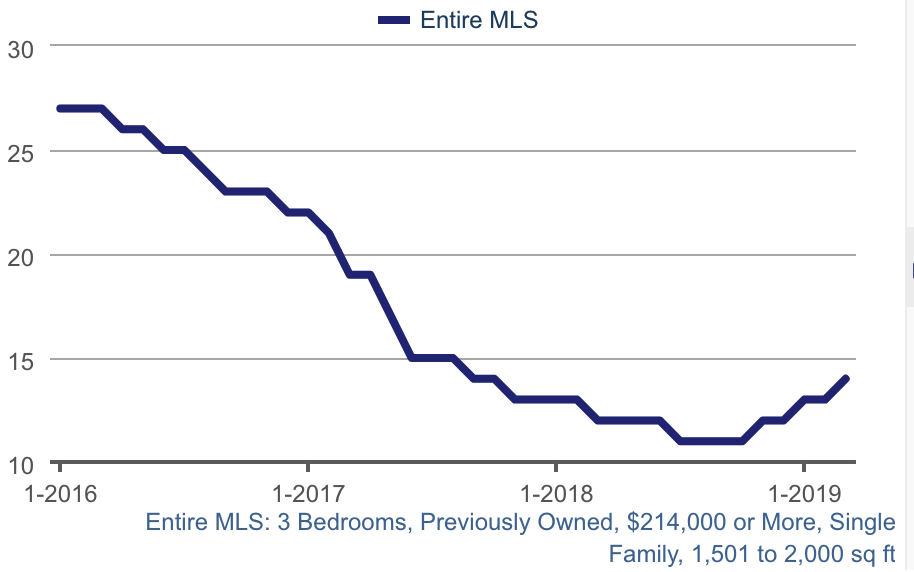
Median Days on Market - The median days on market has risen from 12 to about 14 days. Not a significant change. There is still high demand for the type, configuration and price range we target.
Available Conforming Rental Units by Month - There has been steady decline in available rental units over time. This is what is driving up rents (6.6% average increase in 2018) in the property profile we target.
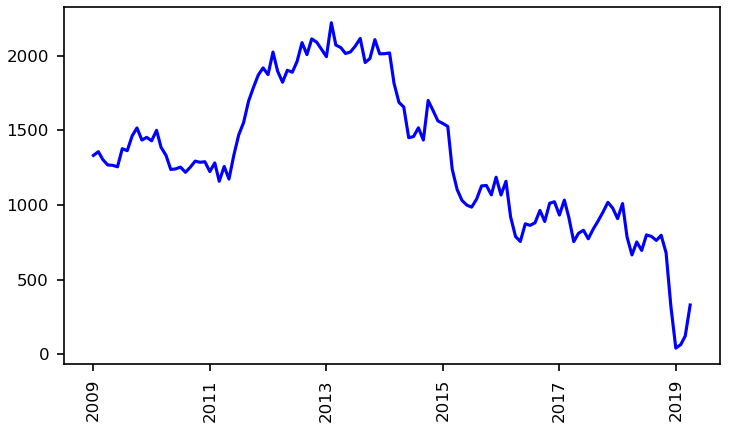
In summary, the real estate market is very strong. Demand for rental properties is outpacing supply resulting in rising rents. We expect demand to increase during the rest of 2019.
Other Information Worth Noting
Resident Population Growth - 2017 to 2018
Nevada ranks #1 in the US for population growth.
Source: U.S. Census Bureau
Driver's License Surrenders to Nevada by State for 2018
This shows which states people are moving from.
Source: UNLV CBER
Fastest Job Growth in the Nation
Source: U.S. Bureau of Labor Statistics (December 2018 vs. December 2017)
Fastest Personal Income Growth
This shows that the jobs being created are not low end jobs. They pay well and the wages are increasing with the current jobs.
Source: U.S. Bureau of Economic Analysis (Q2 2018 vs. Q3 2018)
Fastest House Price Appreciation
Source: Federal Housing Finance Agency (Q3 2017 vs. Q3 2018)
New Home Median Price - Median new home price is $410,000 which is well above the sweet spot for renters. The price of new homes is largely driven by the high cost of land, which is in short supply. Resales will still be the pool for investment properties and will not be diluted by new homes.
Major Projects
Major projects are big drivers of the future economy for Las Vegas. In the 2000 to 2010 era, there was a push to add hotel rooms. The problem was that it was effectively a zero sum game since there were no new attractions added to draw more visitors. This has completely changed in the last few years in that new attractions are being added instead of simply hotel rooms. The nature of Las Vegas has changed too. Until only a few years ago Las Vegas was just "Sin City", a great vacation destination. Today it has changed into a great place to live with endless entertainment, affordable housing and low cost of living. Below are some of the major projects currently under construction (not just planning):
- Sphere Las Vegas - $75M
- Resorts World Las Vegas - $7B
- Drew Las Vegas - $3B
- Raider's Stadium - $2B
- Las Vegas convention center expansion - $750M
- Google - $600M data center
- Union Village - $1.2B
- Project Neon - $900M
- Palms Casino Resort Renovation - $690M
- Caesars Forum Conference Center - $375M
There are many other projects underway but the above are the largest we know of. Any one of the above projects would be huge for a 2.2M population city. These projects will create a large number of additional well paying jobs which will attract even more people to Las Vegas.
Land Shortage
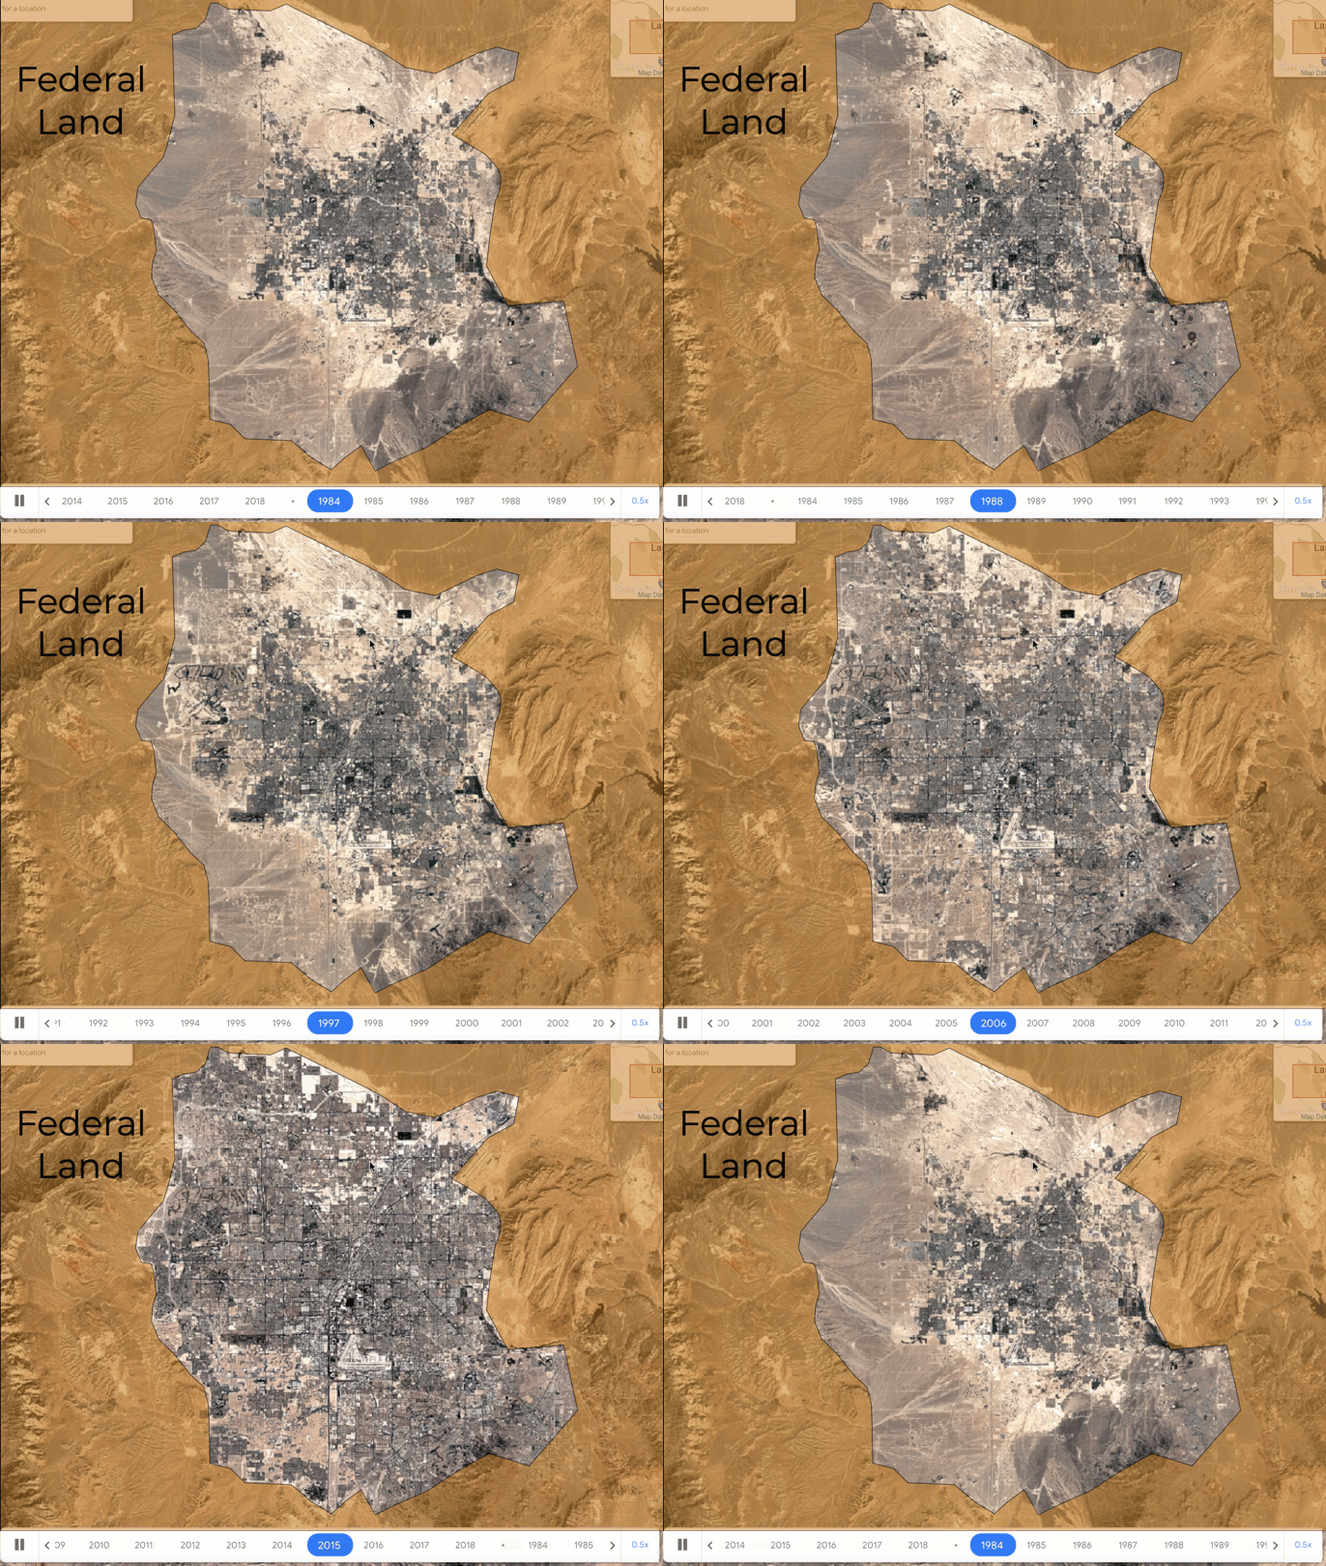
Not many people realize that Las Vegas is an island surrounded by federal land. Approximately 84% of all land in Nevada and 87% of Clark County (in which Las Vegas is located) is owned by the federal government. See the map below for what has happened between 1984 and 2016. Note that 2017 and 2018 were huge growth years for Las Vegas so even less land is available now.
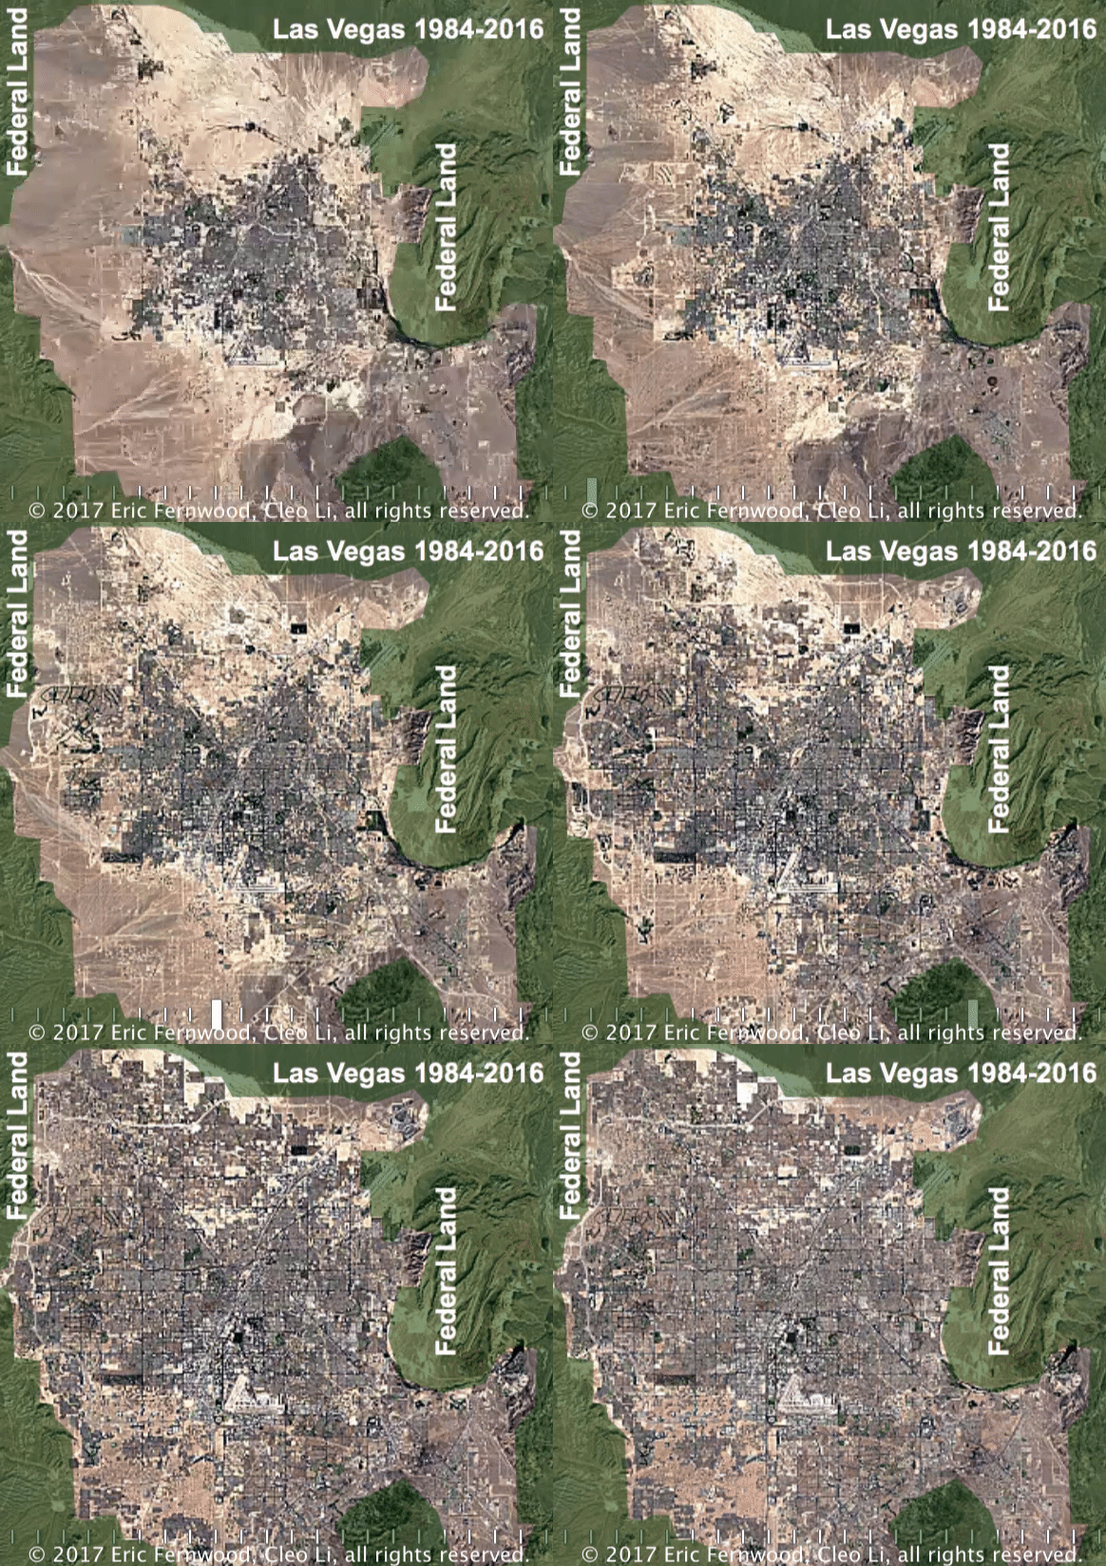
Since there is limited room for expansion, Las Vegas will not have urban sprawl, the only growth path is redevelopment. This is a huge advantage for investors. In most cities, urban sprawl leaves formerly desirable areas "behind" and they tend to decline with increased crime and falling rents and prices. Not the case for Las Vegas:
- Class A properties will stay class A in the future.
- Due to the lack of expansion room, increased demand created by people and companies migrating to Las Vegas will almost guarantee price and rent increases.
Summary
The current market is strong and we expect it to get stronger as 2019 progresses. A significant number of Californians are already moving to Las Vegas and the 2018 Tax Act will drive more people to look for a more affordable place to live. The lack of room for expansion almost guarantees prices will continue to rise as more and more people bid for the limited number of available properties. Las Vegas remains an outstanding investment location for the foreseeable future.

FERNWOOD Team, KW VIP Realty520 Reviews
103 Replies
- Member since 2020 · 67 posts · 110 votes6y
- 6yEric FernwoodBusiness MemberRealtor · Las Vegas, NV · Member since 2014 · 1k+ posts · 1k+ votes
Coronavirus Impact Update 4-8-2020
While I read dire predictions, the property profile we target for investors is doing OK. Things are always changing but so far, our clients’ properties are performing well. Below is a brief summary of the current situation and below that you will find statistics on what is happening in the market.
Current Situation
As of today, out of the current 160 or so properties our clients own, we have six tenants reporting problems paying April rent. One tenant, who lost their job, requested early termination of lease; all others have agreed to pay partial rent for April and defer the balance until no later than June 1st.
Rent deferral will likely rise depending on how long COVID-19 impacts business. However, our target tenant pool is credit based and they “fear” bad credit. So, while there may be a delayed payment, we believe the vast majority will pay because they know even a late payment will harm their credit for years. Note that even during the 2008 crash, our owners had zero decrease in rent and zero vacancies. So, we expect that while there may be some delays getting paid, the vast majority will pay the rent in full.
Market Statistics
The data below covers the preceding 13 months for properties that conform to our basic search criteria, which is summarized below:
- Single family
- Sale price < $400,000
- Bedrooms: 3 to 4
- Garage: 2 to 3
- Stories: 1 or 2
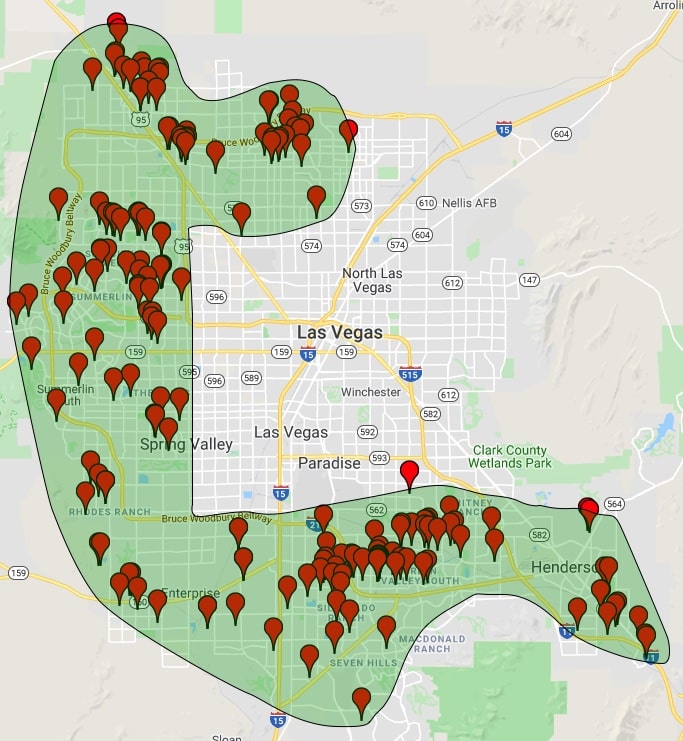
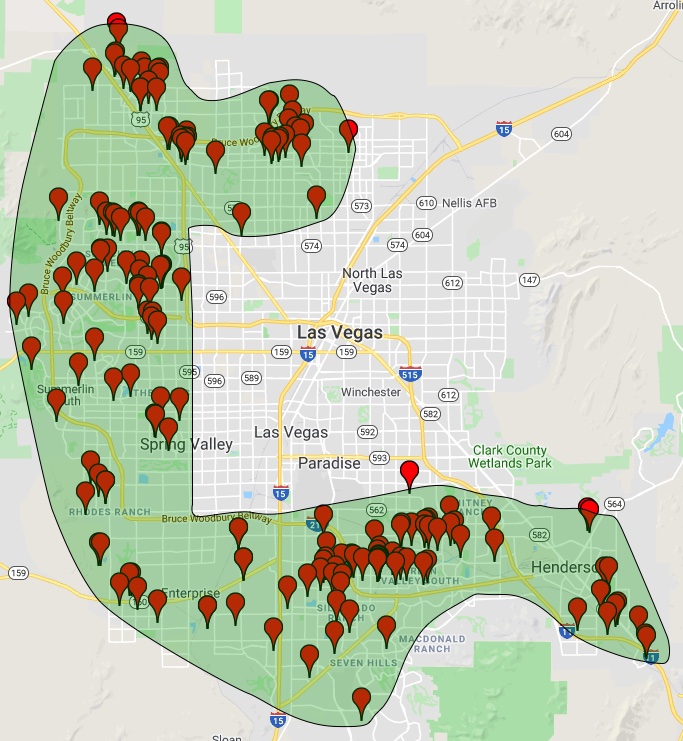
- The map below shows the location of about 80% of our clients’ properties as well as the approximate search area.
The charts below are based on data from the Greater Las Vegas Association of REALTORS (GLVAR) MLS.
Rentals - Inventory Levels
Note that inventory levels continued the decline that started in January.

Rentals - Median $/SF
Rent rates rose in March and posed a significant increase year-over-year.

Rentals - List to Contract Days
List to contract days has declined since January.
Rentals - Closings by Month
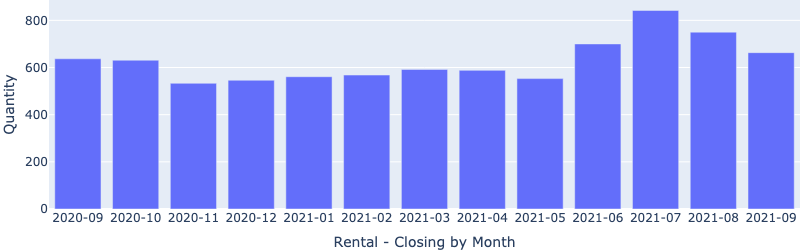
We are still seeing a lot of rental activities, even into April. What about sales?
Sales - Inventory Levels
Inventory started falling in August 2019 but rose slightly in March.
Sales - Median $/SF
Prices started rising from November 2019 and continue to do so.
Sales - List to Contract Days
List to contract days continued to decline since December. There is a lot of unmet demand for Las Vegas properties which match our property profile.
Sales - Closings by Month
The number of closed sales remained stable throughout March. We were expecting fewer closed sales in March but were surprised.
Summary
Any major market discontinuity is an opportunity to make money. Now is one of these times.
We are not seeing any general price declines, let alone a crash. What we are seeing are some individual attractively priced properties coming on the market resulting in excellent returns. But these are scarce. Unless something drastically changes, Las Vegas properties may ride out the storm.
References
FERNWOOD Team, KW VIP Realty520 Reviews - Investor · New York, NY · Member since 2017 · 263 posts · 118 votes6y
- Investor · New York, NY · Member since 2017 · 263 posts · 118 votes6y
- Real Estate Agent · Henderson, NV · Member since 2011 · 1k+ posts · 550 votes6y
- Investor · New York, NY · Member since 2017 · 263 posts · 118 votes6y
- Real Estate Agent · Henderson, NV · Member since 2011 · 1k+ posts · 550 votes6y
- 6yEric FernwoodBusiness MemberRealtor · Las Vegas, NV · Member since 2014 · 1k+ posts · 1k+ votes
As always, lots of great opinions and predictions on this thread. However, I always question the reliability of any prediction. I believe Peter Drucker said it very well:
"Trying to predict the future is like trying to drive down a country road at night with no lights while looking out the back window."
Or, my own opinion:
"Predicting anything beyond yesterday is guessing"
So I will leave the predictions to others and instead I will present the current condition of the Las Vegas market.
Below are charts from our latest trailing 13 month market report, which includes August data. Remember that this data is only for the property profile that we target, not for the entire metro area and all property types. Our property profile was selected to have the highest probability of attracting our target tenant pool. In general, the property profile is as follows:
- Single family
- 1 or 2 stories
- Price range: $250,000 to $400,000
- 3+ bedrooms
- 2+ car garage
- In very specific areas
- Built after 1985
There is a lot more detail but the above will give you a general idea of the properties we target. What this also means is that we do not include in our data: apartments, condos, multi-family, single family homes priced above or below our target price range or configurations that do not conform to our property profile.
So, with all that said, here is the data for the prior 13 months ending 8/31/2020.
Rental Statistics
Rental rates posted another significant increase in August, now at the highest level for the last 13 months. Both property managers that we work with are reporting extremely low inventory and multiple applications for most properties.
Rentals - Median $/SF by Month
There was a significant month-to-month increase in rental rates, which reflects low inventory and increasing demand.

Rentals - Median List to Contract Days by Month
The time from list to contract is below 10 days, an amazingly short period of time. There are usually multiple applicants for each property. In some cases, renters are offering to pay more than the asking rent or pay one year's rent upfront just to secure a place to live.

Rentals - Availability by Month
This chart shows the average daily number of properties that were for rent by month. As you can see, rental inventory continues to fall. We are at less than half of the level a year ago, a dramatic decrease.

Sales Statistics
Year-to-year prices increased by about 4%.
Sales - Median $/SF by Month

Sales - Median List to Contract Days by Month
Median days on market remains amazingly low for the property profile we target. Properly priced properties go under contract in in 1-3 days and usually with multiple offers.

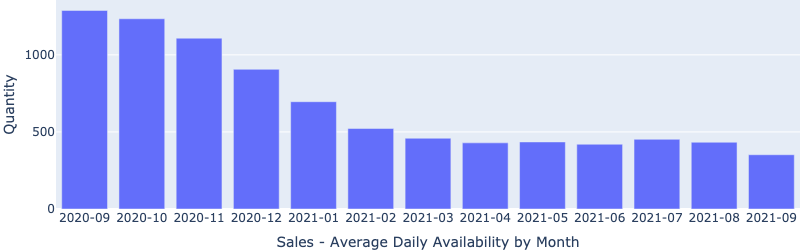
Sales - Availability by Month
This chart shows the average daily number of properties that were for sale by month. Inventory continues to fall and is significantly lower than the same time last year.

Sales - Months of Supply
Months of supply are just barely over one month! Six months is considered balanced.
Based on the above market statistics, what conclusions would you draw about this market? Do you see any indication of a crash or do you see a consistent trend of rising prices and rents?
The Big Eviction
There are "news" articles about the coming "eviction wave". As usual, the "experts" got it wrong. Their first mistake is that they grouped all tenants together into one basket and made their "prediction". (I've looked for their source data and cannot find it. If someone can point me to the data, please let me know.) I can tell you as an engineer that their approach is invalid. You cannot combine disparate tenant pools into a single group and produce any meaningful information. They also made another error.
When the eviction restrictions end, it is possible that a number of people in C and B Class properties may be evicted. However, what the "experts" seemed to forget is that all these people will still need a place to live. And, all the owners of the C and B Class properties will need tenants. What I believe will happen is closer to musical chairs than a huge wave of vacancies. Evicted tenants will move to the next C or B Class property down the street. And, the people who were evicted from that unit will move to another recently vacated C or B property. So, in the short term, I see the potential for a lot of people shuffling around but not a lot of vacancies.
About the tenant pool we target; to date out of the 160+ client properties we track (out of a total of > 200 properties), 10 tenants have at some point over the last 6 months had trouble paying the full rent on schedule. A relatively small percentage of the total in my opinion. I expect most of these tenants will catch up on their rent in the near future. For example, one of the 10 tenants just paid close to $9,000 to bring their rent current. Paying $9,000 to catch up on the rent is a lot more expensive than moving. However, moving is not the issue, a bad credit report is this tenant pool's fear. A negative hit on their credit will dog them for years. Plus, even if they wanted to move, it is unlikely any property manager with an A Class property will rent to them. There are too many qualified applicants for the property manager to consider anyone who was evicted or skipped out on their lease. So, we do not expect many of the remaining 9 tenants to be evicted. To put this in perspective, out of a population of over 200 properties, we've had a total of 5 evictions in the last 12 years.
Summary
I believe that increasing demand combined with a shortage of inventory will continue to drive the market in a positive direction for the foreseeable future.
FERNWOOD Team, KW VIP Realty520 Reviews - Involved In Real Estate · San Diego, CA · Member since 2013 · 39 posts · 17 votes5y
Hi @Eric Fernwood,
Could you give this thread an update, please?
- 5yJay HinrichsBusiness MemberReal Estate Consultant · Summerlin, NV · Member since 2014 · 45k+ posts · 66k+ votes
- 5yEric FernwoodBusiness MemberRealtor · Las Vegas, NV · Member since 2014 · 1k+ posts · 1k+ votes
Hello @Matt Huneycutt and @Bill B.,
Thanks for the tag.
What We Are Seeing
Las Vegas is an island surrounded by federally owned land. There is little land for expansion, a growing job market, and an influx of people. Unless there is another "COVID Event", prices and rents will continue to increase at a rapid rate through 2021 and beyond. Unless California suddenly turns business and people-friendly, Las Vegas will have a long run of prosperity. Some specifics.
- Prices rose 15.4% YoY in March 2021 (for the segment that we target. See charts below.), with median days on the market at 5. Properties that we target are typically going under contract in 1-2 days.
- Rents rose 8.7% in March 2021 YoY with median days on the market at around 8. The average time on the market for most of our client's rentals is under seven days.
- Both the sales and rental market have extremely low inventory (less than half a month).
- We regularly close properties with a cash-on-cash return between 4% and 6% (6 last month), so good properties are available.
- The average tenant stay (for ours and our clients' properties) is about five years, with an average turnover cost of about $500.
- COVID - To date, out of the 190+ client properties we track (out of a total of > 220 properties), at some point during the last twelve months, ten tenants have had trouble paying the full rent on schedule. A relatively small percentage of the total. I expect most of these tenants will catch up on their rent. For example, one of the tenants paid close to $9,000 to bring their rent current. Paying $9,000 to catch up on the rent is a lot more expensive than moving. However, moving is not the issue; bad credit report is their fear. A negative hit on their credit will dog them for years. Plus, even if they wanted to move, no property manager would rent an A Class property to anyone with any black mark on their credit. So, eviction moratorium or not, credit risk is the primary control factor for our tenant pool. We've only had five evictions in the last 15+ years.
- For Class C and Class B properties, it is a very different story. The landlords I talked to have a lot of tenants who have not paid the rent in months. The tenant pool for C and most B Class properties are lower-paid, lower-skilled workers. These are the first to be laid off during economic stress and the last to be rehired. This is one reason we do not recommend Class C and rarely B Class.
Supporting Information
First, the statistics.
The information below only concerns the narrow property profile/tenant pool we target. No data for any other property type is included. The typical property we target has the following characteristics:
- Single family
- Sale price < $400,000
- Bedrooms: 3 to 4
- Garage: 2 to 3
- Stories: 1 or 2
- Note that while the green area appears homogeneous, in actuality it is more like Swiss cheese.
Below you will find the statistics we generate each month.
Rental Statistics
Rentals - Median $/SF by Month
Median rental rates reached $1/SF in March, representing a 8.7% increase YoY. A phenomenal growth for rental rates.
Rentals - List to Contract Days by Month
There is very little rental inventory and what is available goes under contract in days.

Rentals - Availability by Month
This chart shows the average daily number of properties that were for rent in a particular month. As you can see, we are at about 40% of the level a year ago.
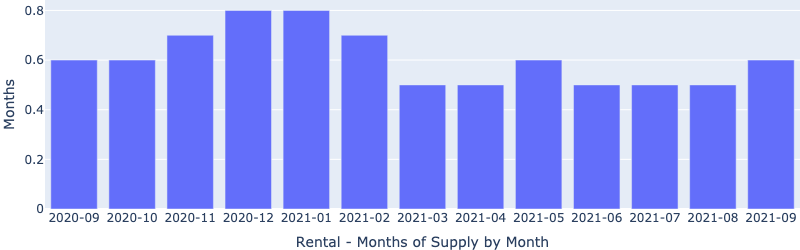
Rentals - Months of Supply
2 to 3 months is typical. Today we are at just 0.5 month of supply!
Sales Statistics
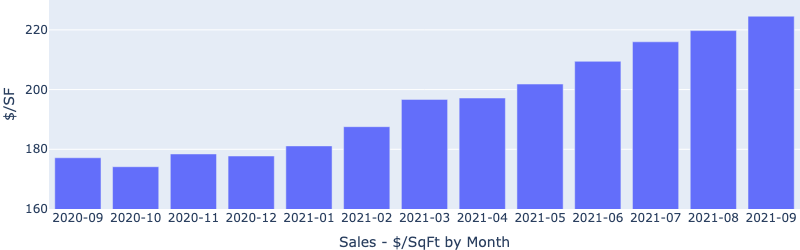
Median $/SF by Month
Prices have risen rapidly since February 2021 and March 2021 saw an amazing increase of 15.4% YoY!
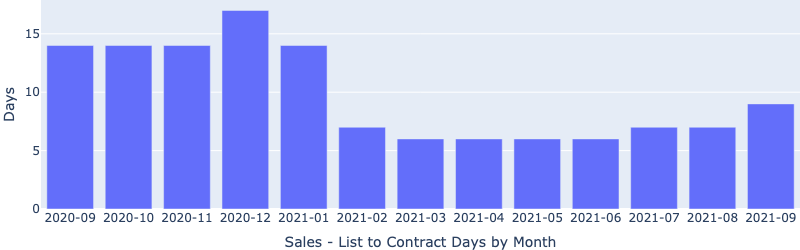
Sales - List to Contract Days by Month
Accompanying the rapid price increase is the unprecedented low days on the market. Properties that we target are typically going under contract in 1-2 days.
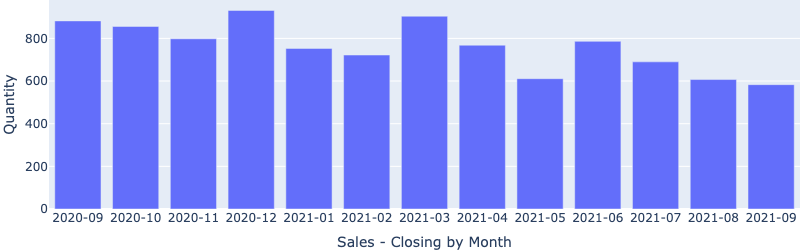
Sales - Availability by Month
We are at less than 1/3 of the level a year ago just before the COVID hit.
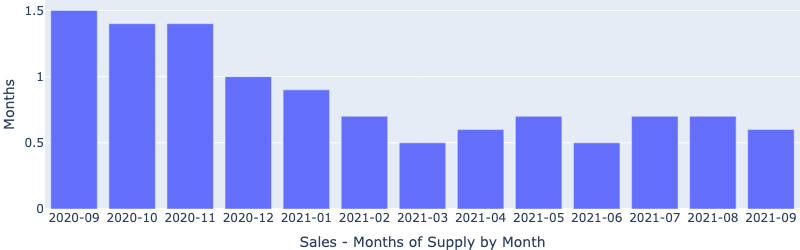
Sales - Months of Supply
Six months supply is considered a balanced market. In March there was approximately 1/3 of one month!

Other Items of Interest
- Google Data Center - Google is in the process of building a $600M data center in Henderson. They also announced that they will add a second $600M data center on the same site. Las Vegas will be one of 11 data centers worldwide. Even though they will not employ many people (100 to 150 employees at an average salary of $65,000), the presence of Google is huge. I believe that where Google goes, others will follow. And, it will be infrastructure, which is what I want for Las Vegas. I've seen companies lay off thousands of engineers and programmers at a time, but no one walks away from infrastructure.
- announced three more centers in Las Vegas. Of special interest are two facilities: Merch by Amazon and Print on Demand. "Merch by Amazon allows brands and independent artists to create custom-printed apparel and electronics products. Print on Demand helps authors and publishers with on-demand publishing, helping to reduce upfront costs of printing for inventory." Amazon selecting Las Vegas for this type of infrastructure will bring others to Las Vegas as well.
The hospitality industry is still expanding:
- Virgin Hotels just opened a new hotel/casino.
- The First Atari Hotel Looks Like a Gamer's Fantasy — and It’s Opening in Las Vegas
- The Boring Company plans to expand the existing underground transit system in Las Vegas.
- Resorts World, a $7B hotel/casino is opening summer 2021.
- The convention business is starting to rebound. At least one convention, 2021 World of Concrete, is schedule for June 2021.
- Las Vegas was the second fastest-growing city in the US for 2020 - according to Updater. "Most people migrated [to Las Vegas] from cities like San Fransisco, Los Angeles, and Sacramento, Updater said."
- California fuels Las Vegas growth - As California continues to make the state less desirable for both individuals and businesses, many are leaving the state. Leaving California has actually become a significant business. A portion of these companies and people will choose Las Vegas. Hopefully, the number of people moving to Las Vegas will not become the torrent that Boise is attempting to deal with.
- Zillow is predicting a +10% increase in Las Vegas housing prices in 2021. Interestingly, in the summer of 2020 they predicted a 7% decrease for 2021.
- Housing prices for Las Vegas are still well below 2006 peak prices. See the chart below. If you ignore inflation, prices have almost reached the 2006/2007 peak. However, inflation is real and must be considered. $143/SF in 2008 dollars is the same as $174/SF in 2020 dollars so there is still a long way to go.

- Land shortage - The available land for development continues to dwindle. At the end of 2019, the amount of vacant buildable land in the Las Vegas Valley was less than 28,000 acres, of which 5,000 to 7,000 acres is not viable for residential development. (87.5% of Clark County is federally owned. 85% of the entire state is federally owned.) Consumption rate is about 5,000 acres/year. See the animated GIF below. The areas in brown are federal land. The time-lapse only goes through 2018 and there was a large amount of development in 2019 and 2020. The southwest part of the city is now the least developed and construction in the area is relentless. For example, the $400M Uncommons has broken ground - a $400M complex in southwest Las Vegas.
Las Vegas is and will continue to be a great place to invest for buy and hold investors.
FERNWOOD Team, KW VIP Realty520 Reviews

Join the conversationCreate a free account to reply, vote on answers and follow this thread.