Found a property in LV but worried about peak

Found a property in LV but worried about peak

Rental Property Investor · Seattle, WA · Member since 2014 · 1k+ posts · 1k+ votes

This house barely cash flows. I worry about it being near the peak especially in LV due to the looming recession. With 85k involved in closing, it isn't an ideal time to buy if the market turns against me and I can buy a house with more cash flow in the greater Seattle area even now, where we aren't a service economy like LV.

Buy or wait? 

1Reply
246 views

Most Popular Reply

Eric FernwoodBusiness Member
Realtor · Las Vegas, NV · Member since 2014 · 1k+ posts · 1k+ votes
7y

Hello @Jack B.

We just conducted our Q1 Las Vegas Investor Update and below are our findings.

Market Update

Note that the following data comes from the Las Vegas MLS and is only for properties that conform to our target tenant pool.

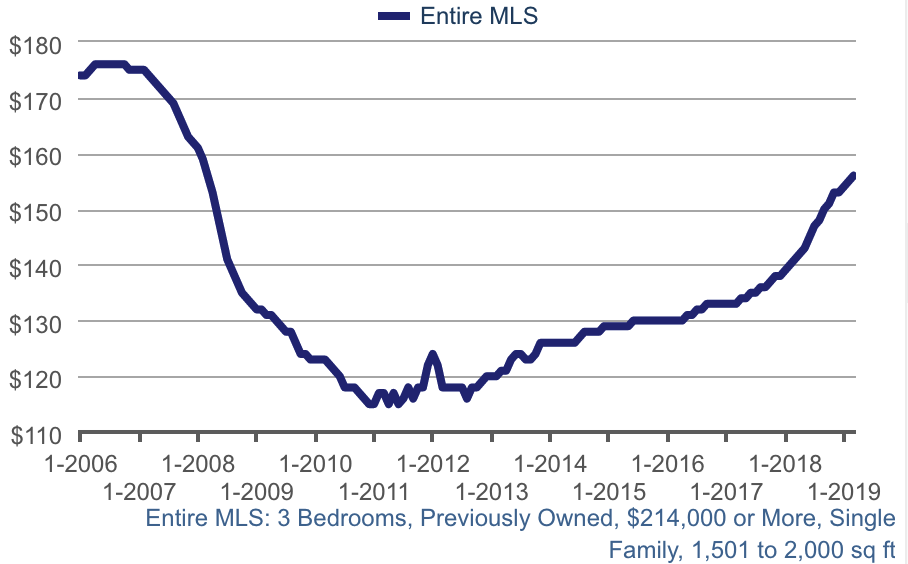
Median $/SqFt for Single Family Homes - The $/SqFt continues to rise. We expect the rate to increase towards the end of the year, likely driven by Californians looking for a more cost effective place to live. Already 30% of all sales today are to Californians. Also, we are still 20% below the peak prices of 2006. If you take inflation into account we are about 35% below peak 2006 prices.
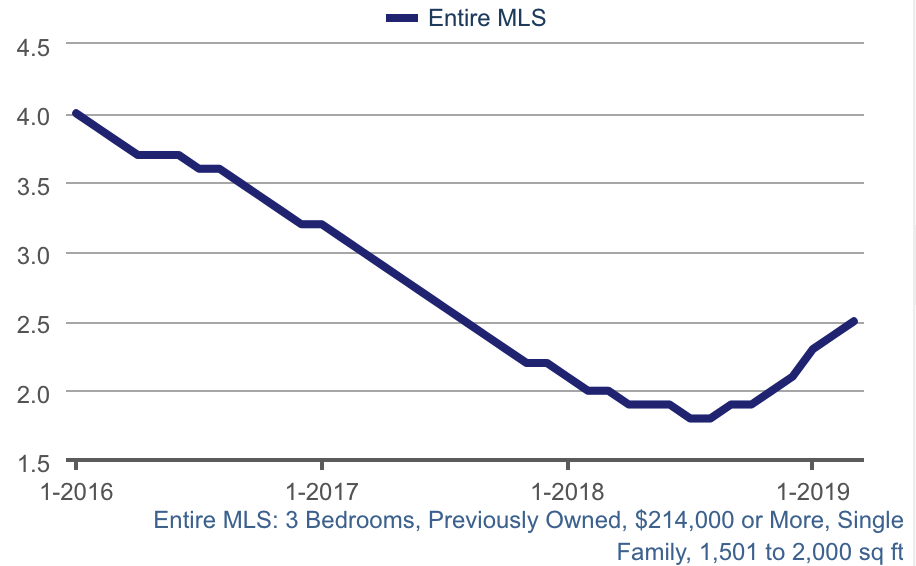
Months of Supply - The months supply of properties has risen since late 2018, but still below 3 months where 6 months is considered a balanced market. The effect of the increased supply is that we are seeing increasing ROI and facing less competition from buyers.
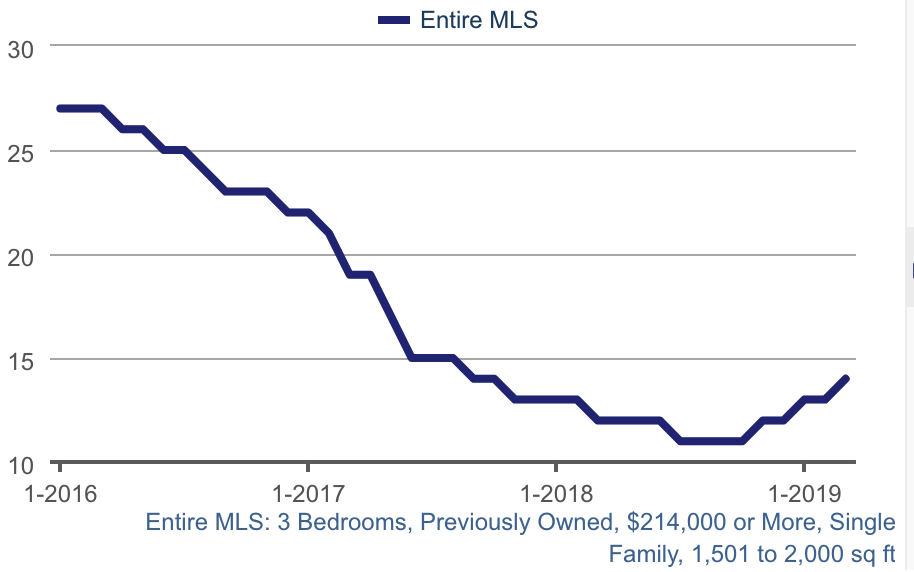
Median Days on Market - The median days on market has risen from 12 to about 14 days. Not a significant change. There is still high demand for the type, configuration and price range we target.
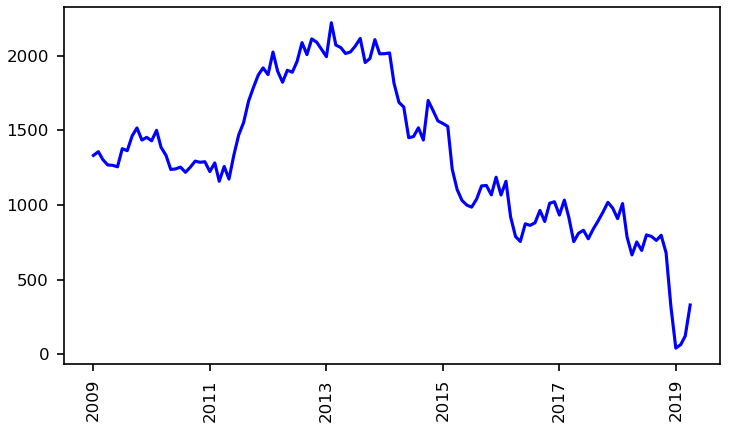
Available Conforming Rental Units by Month - There has been steady decline in available rental units over time. This is what is driving up rents (6.6% average increase in 2018) in the property profile we target.
In summary, the real estate market is very strong. Demand for rental properties is outpacing supply resulting in rising rents. We expect demand to increase during the rest of 2019.

Other Information Worth Noting

Resident Population Growth - 2017 to 2018

Nevada ranks #1 in the US for population growth.

Source: U.S. Census Bureau

Driver's License Surrenders to Nevada by State for 2018

This shows which states people are moving from.

Source: UNLV CBER

Fastest Job Growth in the Nation

Source: U.S. Bureau of Labor Statistics (December 2018 vs. December 2017)

Fastest Personal Income Growth

This shows that the jobs being created are not low end jobs. They pay well and the wages are increasing with the current jobs.

Source: U.S. Bureau of Economic Analysis (Q2 2018 vs. Q3 2018)

Fastest House Price Appreciation

Source: Federal Housing Finance Agency (Q3 2017 vs. Q3 2018)

New Home Median Price - Median new home price is $410,000 which is well above the sweet spot for renters. The price of new homes is largely driven by the high cost of land, which is in short supply. Resales will still be the pool for investment properties and will not be diluted by new homes.

Major Projects

Major projects are big drivers of the future economy for Las Vegas. In the 2000 to 2010 era, there was a push to add hotel rooms. The problem was that it was effectively a zero sum game since there were no new attractions added to draw more visitors. This has completely changed in the last few years in that new attractions are being added instead of simply hotel rooms. The nature of Las Vegas has changed too. Until only a few years ago Las Vegas was just "Sin City", a great vacation destination. Today it has changed into a great place to live with endless entertainment, affordable housing and low cost of living. Below are some of the major projects currently under construction (not just planning):

  • Sphere Las Vegas - $75M
  • Resorts World Las Vegas - $7B
  • Drew Las Vegas - $3B
  • Raider's Stadium - $2B
  • Las Vegas convention center expansion - $750M
  • Google - $600M data center
  • Union Village - $1.2B
  • Project Neon - $900M
  • Palms Casino Resort Renovation - $690M
  • Caesars Forum Conference Center - $375M

There are many other projects underway but the above are the largest we know of. Any one of the above projects would be huge for a 2.2M population city. These projects will create a large number of additional well paying jobs which will attract even more people to Las Vegas.

Land Shortage

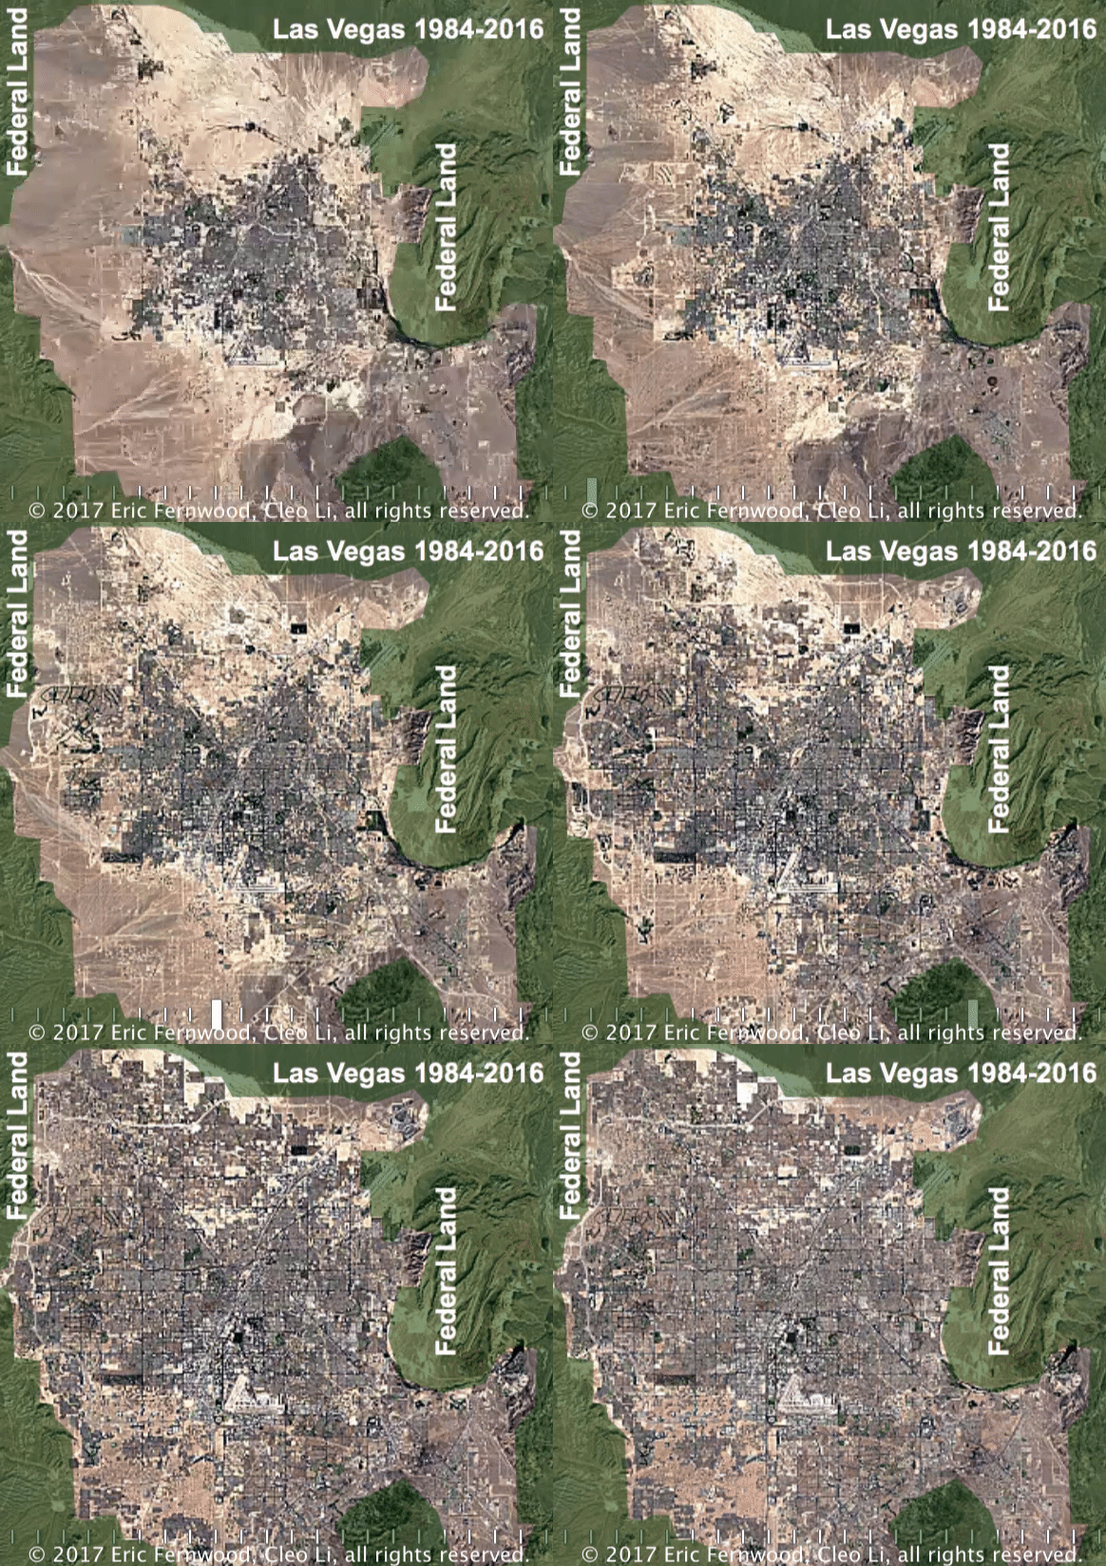
Not many people realize that Las Vegas is an island surrounded by federal land. Approximately 84% of all land in Nevada and 87% of Clark County (in which Las Vegas is located) is owned by the federal government. See the map below for what has happened between 1984 and 2016. Note that 2017 and 2018 were huge growth years for Las Vegas so even less land is available now.
img

Since there is limited room for expansion, Las Vegas will not have urban sprawl, the only growth path is redevelopment. This is a huge advantage for investors. In most cities, urban sprawl leaves formerly desirable areas "behind" and they tend to decline with increased crime and falling rents and prices. Not the case for Las Vegas:

  • Class A properties will stay class A in the future.
  • Due to the lack of expansion room, increased demand created by people and companies migrating to Las Vegas will almost guarantee price and rent increases.

Summary

The current market is strong and we expect it to get stronger as 2019 progresses. A significant number of Californians are already moving to Las Vegas and the 2018 Tax Act will drive more people to look for a more affordable place to live. The lack of room for expansion almost guarantees prices will continue to rise as more and more people bid for the limited number of available properties. Las Vegas remains an outstanding investment location for the foreseeable future.

FERNWOOD Team, KW VIP Realty520 Reviews
See this reply in the discussion

103 Replies

Jump to latestLatest
  • Investor · Las Vegas, NV · Member since 2013 · 8k+ posts · 10k+ votes
    6y

    Appreciation continues mostly due to lower interest rates, people fleeing California and the east coast (more adults in vegas were born in California than Nevada), lower taxes and the economy  

    Dec 2019 actuals:

    Prices up 6% $17,750 $313,000

    Sales dec 2020 vs 2019 up 22%

    Inventory dec 2020 vs 2019 down 16%

    Looks like Terry’s estimate was much closer. His prediction 3 months ago was off by $3,000 or 1%. Pretty darn accurate. 

  • Professional · Anaheim, CA · Member since 2017 · 1k+ posts · 686 votes
    6y

    @Bill B.

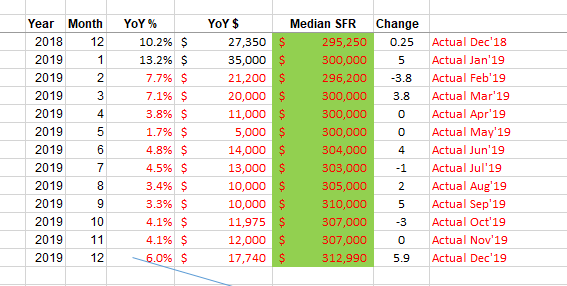
    I was looking for the Las Vegas median home price for Dec'19, and they came out today. The final SFR median for the year was actually $312,990 or rounded $313k. This was a mild surprise as Nov'19 to Dec'19, increased $5.9k. I attribute this large increase to low interest rates, low inventory, low unemployment, and consumer confidence. Maybe throw in Raiders stadium will be completed soon.

    I do forecasting for work in accounting and finance. The trend that I am seeing is that for Dec'19, the largest increase 5.9k in a supposed slow winter month. Also, this brought up YOY gain for year to 6.0%, which challenges Phoenix for the best performing % gain for year. Another trend is this bodes well for a great spring selling season. 

    Here are the actuals for the year 2019, see below.

    Terrence
  • Professional · Anaheim, CA · Member since 2017 · 1k+ posts · 686 votes
    6y

    @Bill B.

    Sales dec 2020 vs 2019 up 22%.

    I'm reading what you posted and saw that you got that fact from " Calculated Risk" December numbers. However, I don't think this is correct. The below article and link mentions the below.

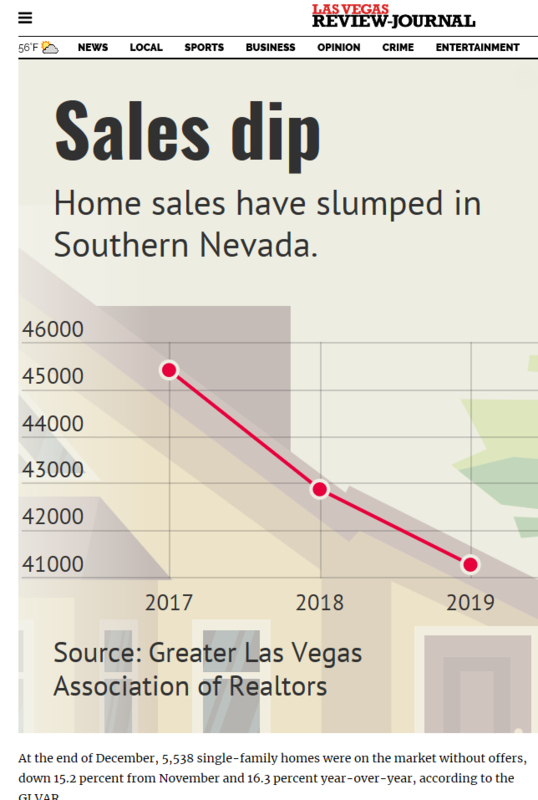
    For all of 2019, just under 41,300 local properties sold, which represented a decrease of about 9% from 2017. In 2018, just under 42,900 units sold.

    I think sales volume year over year has been slowing, less inventory in 2019, coupled with low interest rates, made median SFR home prices go up.

    Terry

    https://vegasinc.lasvegassun.c...

  • Investor · Las Vegas, NV · Member since 2013 · 8k+ posts · 10k+ votes
    6y

    @Terry Lao

    “Sales dec 2020 vs 2019 up 22%.”

    No. Sales in December of 2020 were up 22% over December 2019. 1 month compared to one month, not year to year. 

    “A total of 2,609 houses sold last month, up 8.4 percent from November and 21.8 percent from December 2018.”

    https://www.reviewjournal.com/...


    I prefer the LVRJ to the sun. Less opinions more facts. 

  • Professional · Anaheim, CA · Member since 2017 · 1k+ posts · 686 votes
    6y

    @Bill B.

    Comparing one month in 2019 vs one month in 2018, is very small window. This is why I look at YTD or whole year Jan-Dec.

    Here's the real story from your link. Sales down but propped by low interest rate, low inventory, high demand, which equals price appreciation.

    Terry
  • Investor · Las Vegas, NV · Member since 2013 · 8k+ posts · 10k+ votes
    6y

    But you could also argue sales are down because inventory is down. If sales are down 5% and inventory is down 16%. Eventually you run out of desirable homes. Last summer people were arguing increased inventory was going to lead to decreasing prices. 

    I’d be happy to give 50/50 odds that 2020 sales are higher or lower than 2019. It’s a coin toss.  I’d say the same for prices, though I’d say prices being up is more like 70/30, at least 60/40. 

  • Rental Property Investor · Seattle, WA · Member since 2014 · 1k+ posts · 1k+ votes
    6y

    The market has definitely continued to slow, even in Vegas. I see the same trends in Florida, Nevada, Washington, etc. Houses are taking multiple price cuts and sitting longer. Seattle went down 13% a year or so ago, and is now back up a bit.

  • Professional · Anaheim, CA · Member since 2017 · 1k+ posts · 686 votes
    6y

    @Bill B.

    Since, my niche is 4plexs, I watch multis more closely than SFR. Here is the more alarming forecast in terms of inventory. Last year, there was 2% mult's when compared to SFR, or for every 2 available mult's, there are 100 SFR. Now, it is more like 1%, and cut in half. In terms of percentage, it is quite a contrast. In terms of numbers, there are 57 multi's on mls, and 5535 SFR, which is more alarming.

    In terms of econ 101, the short supply will create a larger demand for mult's, and thus drive prices higher.

    Terry

  • Real Estate Agent · Henderson, NV · Member since 2011 · 1k+ posts · 550 votes
    6y

    @Terry Lao The 57 listings comes out to about the same supply ratio as the sfr. In MLS this morning for just the Vegas valley, there are 53 multi listings, and 26 have sold in the past 30 days. That's a 2.03-month supply. For SFR, there are 4995 listings and 2122 sold in the past 30 days. That's a 2.35-month supply.

  • Professional · Anaheim, CA · Member since 2017 · 1k+ posts · 686 votes
    6y

    @Phillip Dwyer

    I watch more closely to multi's. Last year, multi listings were around 100-110, and now about 57. this is about 50% reduction from last year. I cannot say the same for SFR's. I say that SFR's reduced by 50%, more around then teens %.

    There are more people who buy SFR's than multi's, but 57 multi listings compared to 5535, that is a stark contrast.

    Terry

  • Professional · Anaheim, CA · Member since 2017 · 1k+ posts · 686 votes
    6y

    Hindsight for Las Vegas SFR median. What will Dec'20 be? Can speculate all you want, but if you are not in the game, then it really doesn't matter.

    Dec'17 SFR median 267,900, +32,900, +14%

    Dec'18 SFR median 295,200, +27,350, +10.2%

    Dec'19 SFR median 312,990, +17,740, +6%

    Dec'20 SFR median ?

    Terry

  • Rental Property Investor · Seattle, WA · Member since 2014 · 1k+ posts · 1k+ votes
    6y
    Originally posted by @Terry Lao:

    Hindsight for Las Vegas SFR median. What will Dec'20 be? Can speculate all you want, but if you are not in the game, then it really doesn't matter.

    Dec'17 SFR median 267,900, +32,900, +14%

    Dec'18 SFR median 295,200, +27,350, +10.2%

    Dec'19 SFR median 312,990, +17,740, +6%

    Dec'20 SFR median ?

    Terry

    I really don't know where such comments come from, fortune cookies? If you're not in the game it doesn't matter? The point of the thread is to avoid LOSING money. I guess in your "thoughts" one should blindly "get in the game" at what could be a market peak and lose money. Because after all, if you're not in the game it doesn't matter...which makes no sense. It will matter when you lose money, is that hard to understand?? And I'm already in the game. Seattle dropped 13% in 2018. It was the #1 market for a while and now it's not. Vegas could follow suit. It's called research and critical thinking rather than "if you're not in the game it doesn't matter"...great advice....not...

  • Rental Property Investor · Seattle, WA · Member since 2014 · 1k+ posts · 1k+ votes
    6y

    I'm seeing houses in Vegas and Tampa sit for 2-3 months with price reduction after reduction. This seems to be the norm. I'm also suddenly getting spammed from realtors I've known in those areas, presumably because it actually is that slow and they are trying to drum up business all of a sudden.

  • Rental Property Investor · Seattle, WA · Member since 2014 · 1k+ posts · 1k+ votes
    6y
    Originally posted by @Terry Lao:

    @Bill B.

    Comparing one month in 2019 vs one month in 2018, is very small window. This is why I look at YTD or whole year Jan-Dec.

    Here's the real story from your link. Sales down but propped by low interest rate, low inventory, high demand, which equals price appreciation.

    Terry

    How could there be high demand if sales are down? You make ZERO sense at all. Sales being down means lower demand not high demand....Economics 101...

    Price appreciation is also caused by inflation, not just supply and demand.

  • Professional · Anaheim, CA · Member since 2017 · 1k+ posts · 686 votes
    6y

    @Jack B.

    The trend has been low inventory, low lower sales volume compared to previous year, and higher prices. The Las Vegas real estate market has less than 3 months supply and 6 months supply is considered balance. Thus, it is still a sellers market. The demand for housing is strong as not enough housing built to meet the demand. 

    Your wrong about sales being down means lower demand. The demand is there due to definition of 3 months supply. The piece of the puzzle that you are not seeing is buyers are out there, but not willing to pay higher prices. Thus, when property is priced correctly, sales transaction occurs.

    If demand is not there, then inventory would increase, sales volume would go down, and price would go down. 

    I'm talking about the Las Vegas real estate market. Not sure what market you are talking about. Last month Dec'19, SFR median price homes increased $5.9k for month. Year to date price appreciation reached 6%, making appreciation one of the highest in nation.

  • Investor · Las Vegas, NV · Member since 2013 · 8k+ posts · 10k+ votes
    6y

    Forgetting the fact we were talking about a different market, Luckily jack your 2018 Seattle 13% loss example is wrong. According to the Seattle times printed January 7, 2019 about December 2018 sales and prices  

    “King County’s median single-family home price ticked up just 0.6 percent in December from a year before, and condo costs rose at the same rate — the smallest annual gain since early 2012, when the market was bottoming out.

    In the city of Seattle, prices ticked up just 1.9 percent from a year prior”

    Those aren’t great numbers, unless someone is telling you prices dropped 13% which just isn’t true. 

    Luckily your Las Vegas properties sitting on the market for months and months is also wrong...

    “Single Family homes have a shorter “days on market” average as you can see in this graph for the Las Vegas housing market in 2019. When we look at single-family home sales, December sales were on the market for the highest number of days at 32 and June sales had the lowest average days on market at 23 days.”
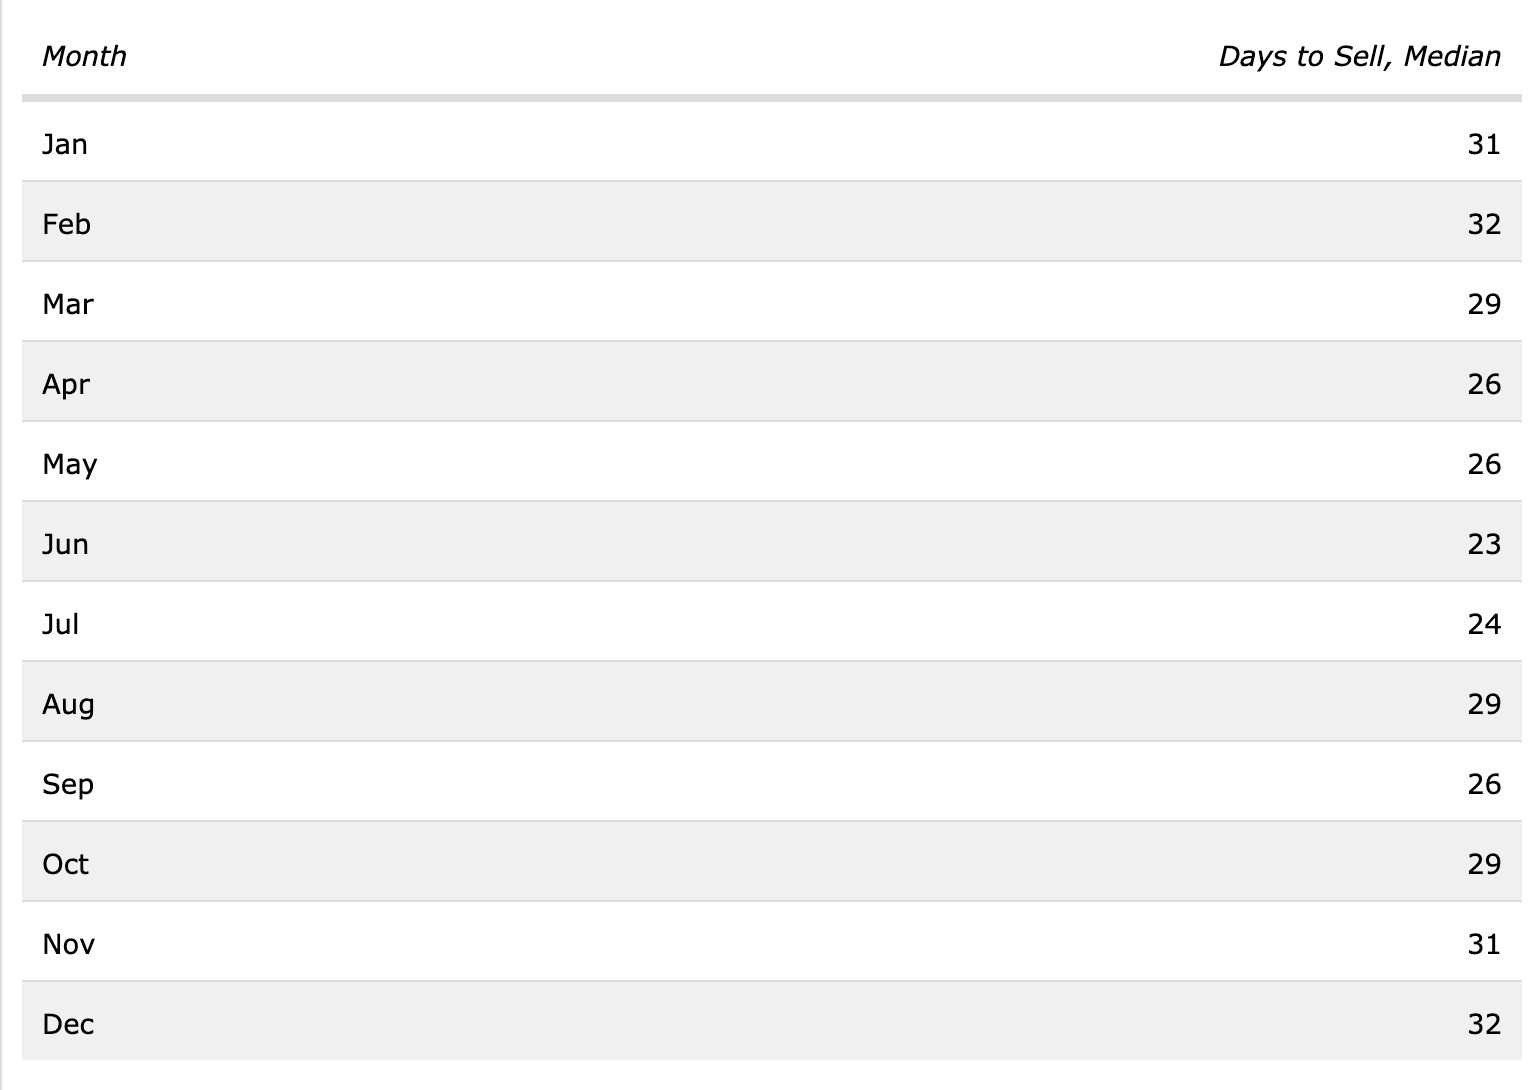
    Single Family homes have a shorter day on market average as you can see in this graph for the Las Vegas housing market in 2019.

    And, Luckily your multiple price reductions is also wrong....

    This is an average for single-family homes sold in Las Vegas in 2019.

    MonthSale Price, MedianList Price, Median
    Jan$300,736$307,500
    Feb$293,000$309,000
    Mar$300,000$310,000
    Apr$295,000$320,000
    May$299,000$319,900
    Jun$300,000$319,000
    Jul$303,000$315,000
    Aug$305,000$319,900
    Sep$310,000$319,900
    Oct$305,000$325,000
    Nov$302,000$315,000
    Dec$310,000$320,000

    You should be happy all your glum “facts” were wrong, but somehow I doubt you will be  

    Ps. If you don’t understand how there could be high demand but low sales, how many examples do you want?

    Stradivarius violins

    Rare disease medicines
    Panda bears

    Waterfront property in NYC

    Most collectible cars

    supply and ability to pay affect sales as much or more than demand. 

    If one year there were 30,000 houses for sale and they sold 24,000. And the next year there were 20,000 for sale and they sold every last one. The declining sales figure doesn’t mean demand went away or even decreased, especially if prices went up. 

  • Professional · Anaheim, CA · Member since 2017 · 1k+ posts · 686 votes
    6y

    @Bill B.

    @Jack B.

    Are we even talking about the same real estate market? The forum topic is " Found a property in LV but worried about peak".

    I'm sure Bill and I are talk about Las Vegas. Not so sure what market you are talking about. Bill has multiple SFR properties and lives in Las Vegas. I have 4plexs in Las Vegas, but live in Southern California. However, I watch the LV market like a hawk.

    Terry

  • Member since 2018 · 211 posts · 164 votes
    6y
    Originally posted by @Brad D.:

    @Jack B. if you're still deciding, I would say to wait. @Eric Fernwood I agree it probably won't be 2008 all over again, but it will definitely be significant. And it looks to me like Vegas will be the tip of the spear, from movoto trends:
    https://www.movoto.com/las-veg...

    Inventory is up YOY 70%, price is down 10%, days on market up a bit. It's worse than Seattle, Dallas or Irvine, other cities people are expecting to tank hard first.  But the good news should be that LV should have the buying opportunities first as well. 

    Also, an interesting aspect to this is the the phoenix metro seems to be still doing well; I had thought (could be wrong) that LV and PHX followed very similar downward trajectory last time?

    looks like you spoke to soon  

  • Real Estate Investor · Las Vegas, NV · Member since 2017 · 2 posts · 1 vote
    6y

    Hi Eric my name is Raul I'm with RBKKIvestments LLC here in Las Vegas. I just read this post and I thought it was filled with great solid information. I would love to connect with you and I look forward to your complete update of the Las Vegas market.

  • Investor · Vacaville, CA · Member since 2016 · 433 posts · 249 votes
    6y
    Originally posted by @Jack B.:

    I'm seeing houses in Vegas and Tampa sit for 2-3 months with price reduction after reduction. This seems to be the norm. I'm also suddenly getting spammed from realtors I've known in those areas, presumably because it actually is that slow and they are trying to drum up business all of a sudden.

     I'd be interested what you see that is sitting on the market in Vegas for 2-3 months!?  I would think only higher end homes.  From what I see in the lower levels ($350K and less) they are typically gone in days.  $1m+ due sit a few months though. What are you speaking of in Vegas?  

  • Member since 2020 · 2 posts · 0 votes
    6y
    Originally posted by @Eric Fernwood:

    We are in the process of finalizing our 2020 Investor Outlook. Part of it is a review of the 2019 Las Vegas investment market for the segment that we target. We will publish our complete 2020 Outlook next week.

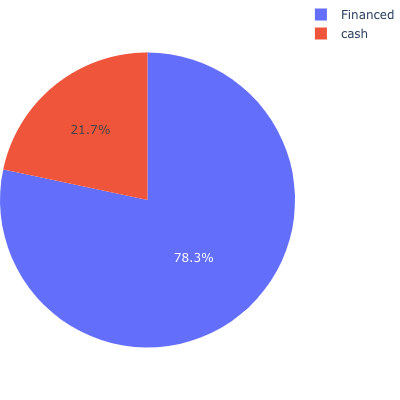
    Sales Types

    Cash vs. Financed Purchases

    The percentage of cash buyers is now about 21%, which is down from previous years. I believe this was largely due to a decrease in Chinese buyers.

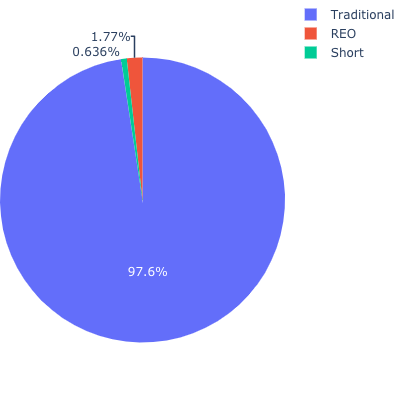
    Traditional Sales vs. REO and Short Sales

    We saw very few foreclosures or short sales in 2019. Property prices have risen to about 90% of peak prices before the 2008 crash so few people are under water.

    Rentals

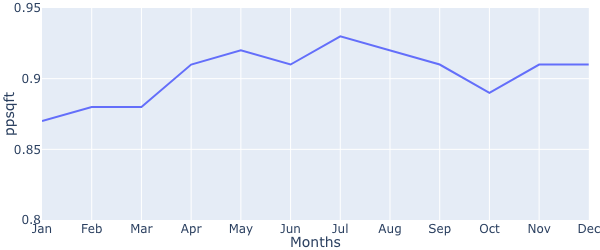
    Median $/SF by Month in 2019

    Median rents rose about 4.5% in 2019. In January, median $/SF was $0.87/SF and at the end of 2019 median $/SF was $0.91/SF. We expect rents to rise faster in 2020.

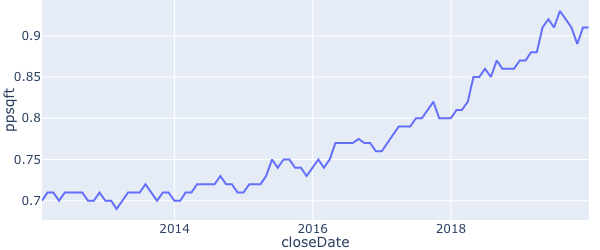
    Median $/SF by Month from 2012 Through 2019

    Rents were flat after the 2008 crash until mid 2013, when they started to rise. Notice the seasonality of the increases. Peak rents occur between mid May through the end of July and lows are mid November through the second week of January.

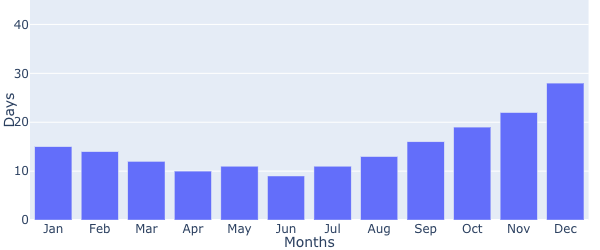
    Days on Market - List to Contract

    Median days from list to contract in peak months is about 9 days. At the slowest time of the year it is about 28 days. In many markets, properties sit on the market for months so 28 days is excellent for slowest time of the year.

    RentalsListToContractByMonth2019

    Months of Supply

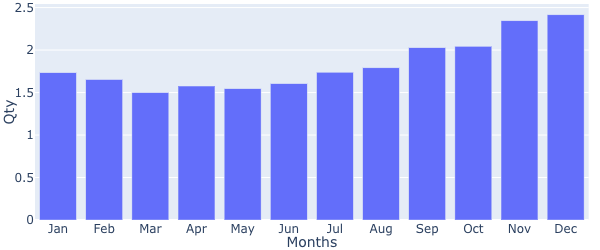
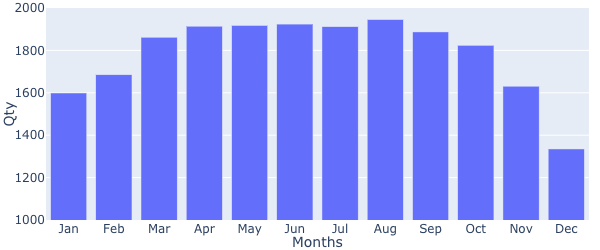
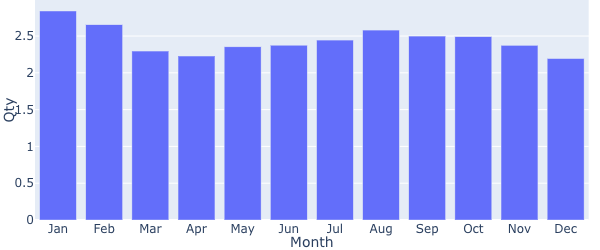
    As you can see, inventory increased towards the end of the year, and decreased during the peak summer months. We were surprised by the build up of rental inventory in November and December. However, we are now seeing a lot of leasing activity so we expect to see the rental supply to decline in the first quarter.

    Sales

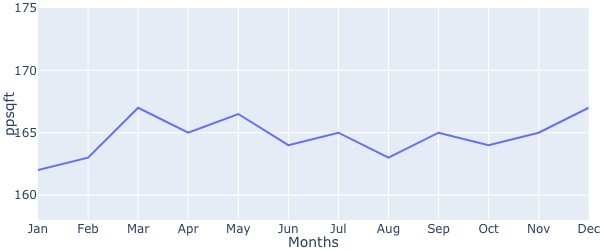
    Median $/SF by Month

    In 2019, conforming properties appreciated by about 3% ($162/SF to $167/SF). This is good news for investors. Another large increase in $/SF after many years of large increases would have concerned me. I believe 3% to be a healthy and sustainable rate of increase. Note that rents rose faster than sale prices.

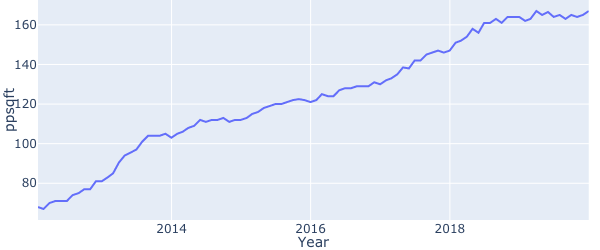
    Median $/SF by Month from 2012 Through 2019

    A 7-year trend trajectory.

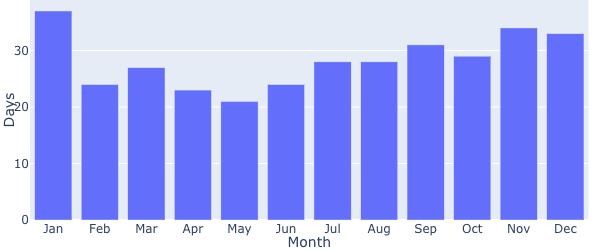
    Days on Market - List to Contract

    The list to contract days fell after January and slowly rose after August which is characteristic of recent years.

    Inventory

    Inventory started falling rapidly in November. This is significant because we are seeing a large increase in showing activity. If this trend continues we will see significant price increase in 2020.

    Months of Supply

    Months of supply peaked at about 2.7 months and has declined since August. 6 months supply is considered a "balanced" market so we are still in a seller's market.

    As inventory and months of supply fall, prices will tend to rise. Good properties are receiving multiple offers and go under contract very rapidly. Showing activity increased significantly in January which is likely to further decrease inventory.

    Based on rapidly declining inventory and the unexpected uptick of competing buyers, we expect prices to start rising in the first quarter. If there is low housing inventory going into the peak May through July period we expect that prices will rise faster in 2020 than they did in 2019.

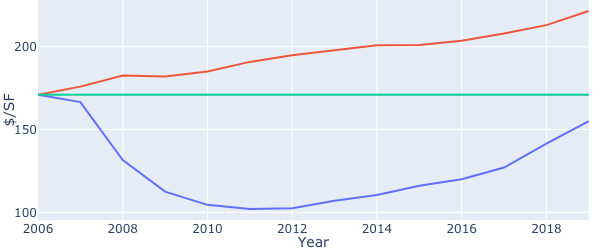
    Still 10% to 40% Below Pre-Crash Peak Price

    Below is a graph comparing the current median $/SF to the peak ($171/SF) in 2006 for conforming properties. The blue line is the non-inflation adjusted $/SF. The red line is the peak $171/SF adjusted for inflation. The green line is just the 2006 peak price ($171/SF) with no consideration of inflation. If you ignore inflation, the current median $/SF (blue line vs. green line) is approximately 90% of the 2006 peak price. If you consider inflation, the current $/SF is about 40% below the peak price. Whether you compare the current $/SF to non-inflation adjusted or to inflation adjusted peak $/SF, Las Vegas still has a long way to go to recover.

    historicalMedianPpsf

    Summary

    Median rents rose 4.5% from beginning of the 2019 to end of the year, a very robust growth. Median sales prices rose 3%, which is a healthy and sustainable growth. Months of supply remained stable and favored seller/landlord. This shows a strong and steadily growing market. We expect this trend to continue in 2020. Look for our complete 2020 Outlook next week.

    Hey everyone, Austin here first time posting on BP. 

    Eric, that is a great post full of information, thanks for sharing. Do you have a link to your 2020 outlook? 

  • Member since 2020 · 2 posts · 0 votes
    6y
  • Eric FernwoodBusiness Member
    Realtor · Las Vegas, NV · Member since 2014 · 1k+ posts · 1k+ votes
    6y

    Hello @A Mills,

    Thanks for the kind words. People were very kind to me when I started. My way of repaying their kindness is to help others.

    Here is our 2020 Las Vegas Investor Outlook.

    FERNWOOD Team, KW VIP Realty520 Reviews
  • Professional · Anaheim, CA · Member since 2017 · 1k+ posts · 686 votes
    6y

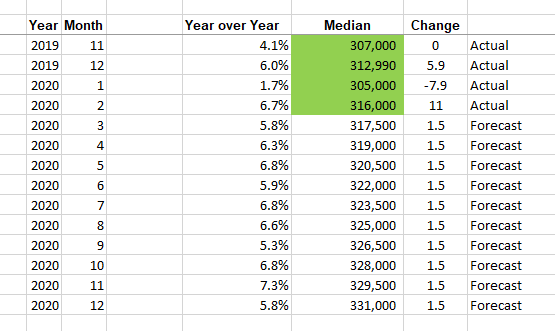
    Hindsight is 20/20. When this original post was posted four months ago, the SFR median home price in Las Vegas was $307k. The Feb'20 SFR median is $316k, gain of 9k. The significance of reaching $316k is this was the first time has surpassed the pre-recession high of $315k way back in Jun'06. It took 13.5 years to reach it's all time high, while many cities passed their all time high many years ago.

    Inventory is still very low, and interest rates for 30 year fix around 3%. Now, the X factor could be Coronavirus. 

    As to my forecast below, SFR median to reach $331k by Dec'20 with modest increase of $1.5k per month. With overall, annual gain of 5.8%, which puts growth among top 3 cities nationally.

    Terry
    https://vegasinc.lasvegassun.com/business/real-estate/2020/mar/06/median-price-for-las-vegas-homes-sets-all-time-rec/

  • Guy with Great Hair · Austin, TX · Member since 2013 · 2k+ posts · 4k+ votes
    6y
    Originally posted by @Terry Lao:

    Hindsight is 20/20. When this original post was posted four months ago, the SFR median home price in Las Vegas was $307k. The Feb'20 SFR median is $316k, gain of 9k. The significance of reaching $316k is this was the first time has surpassed the pre-recession high of $315k way back in Jun'06. It took 13.5 years to reach it's all time high, while many cities passed their all time high many years ago.

    Inventory is still very low, and interest rates for 30 year fix around 3%. Now, the X factor could be Coronavirus. 

    As to my forecast below, SFR median to reach $331k by Dec'20 with modest increase of $1.5k per month. With overall, annual gain of 5.8%, which puts growth among top 3 cities nationally.

    Terry

    https://vegasinc.lasvegassun.com/business/real-estate/2020/mar/06/median-price-for-las-vegas-homes-sets-all-time-rec/

     It's DEFINITELY slowing though right?  :) :) :) 

    I sold my house in Vegas, not sure there will be a dip but in terms of gains relative to the ~5 years prior its definitely at a peak and for me equity capture was the right move. 
Join the conversationCreate a free account to reply, vote on answers and follow this thread.