Do Duplexes Actually Build Wealth? I Tracked 828 St. Paul Properties
I matched 828 St. Paul small multifamily buildings that sold twice since 2012, and here's what the owners actually made.
Most appreciation numbers are averages of different properties in different years, which means changes in the mix of what sold get counted as changes in value. Repeat sales avoid that problem entirely, because you're looking at the same building and two prices and subtracting one from the other. I've laid out the method below so you can tell me where it breaks.
THE DATA
Every closed 2-4 unit residential sale in Saint Paul from December 27 2012 through September 4 2026, out of NorthstarMLS, which came to 4,065 sales.
I normalized the addresses for suffixes, directionals and punctuation, matched within ZIP, and ended up with 1,033 buy-sell pairs. I spot-checked the matches against year built and square footage to confirm they were actually the same building.
The headline set of 828 keeps only pairs held two years or more, with both prices above $50,000 and no decline steeper than 35%. The two-year filter removes fast flips where most of the return is renovation, and the other two remove most foreclosures and family transfers.
RESULTS
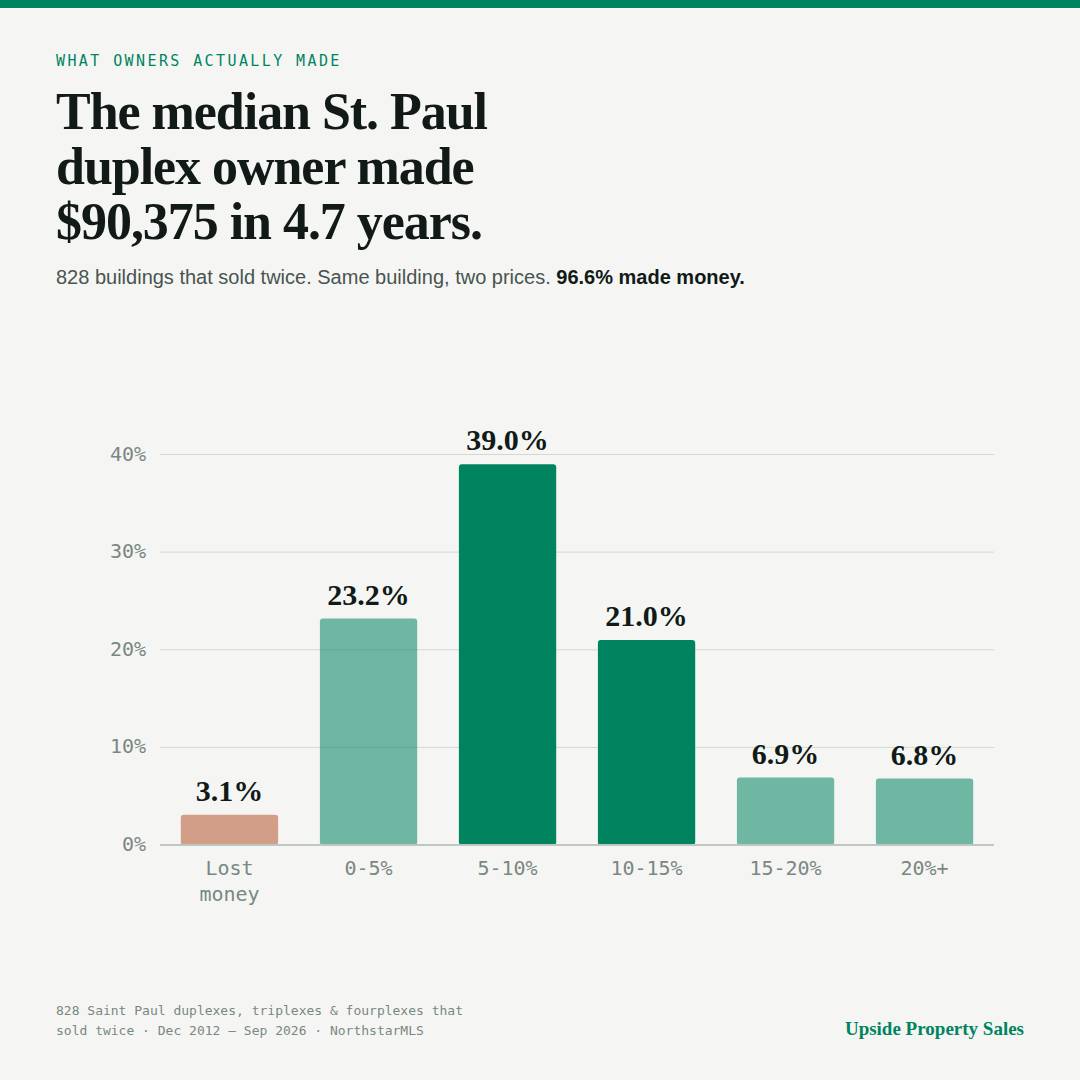
Median purchase was $199,900 and median sale was $300,000, over a median hold of 4.7 years. That's a median gain of $90,375, a total return of 45.5%, and an annualized return of 7.9%. 96.6% made money, with only 26 of the 828 selling for less than they paid, and the total gain across all of them came to about $86.5 million.
Here's how the annualized returns were distributed:
Lost money: 3.1%
0-5%: 23.2%
5-10%: 39.0%
10-15%: 21.0%
15-20%: 6.9%
20%+: 6.8%
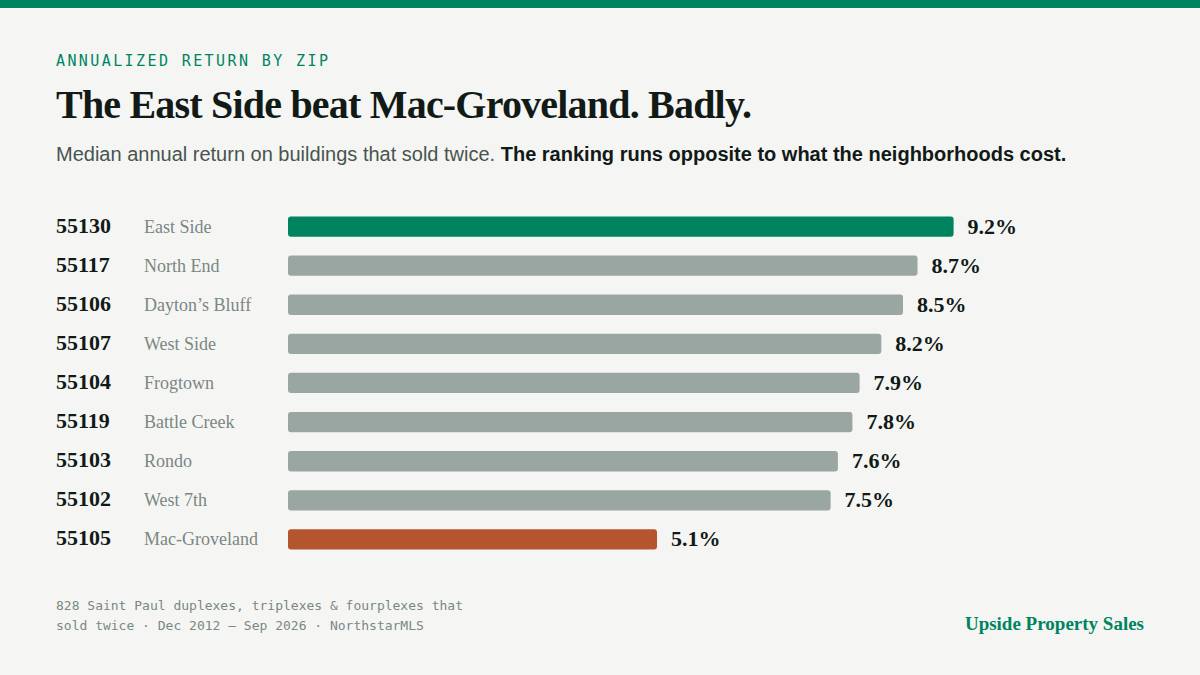
BY ZIP (n >= 15, showing median annualized, median gain, median purchase)
55130 Payne-Phalen 9.2% $71,300 $180,000
55117 North End 8.7% $72,500 $147,750
55106 Dayton's Bluff 8.5% $85,000 $158,700
55107 West Side 8.2% $92,000 $191,000
55104 Frogtown 7.9% $110,500 $229,900
55119 Battle Creek 7.8% $95,100 $240,000
55103 Rondo 7.6% $75,100 $157,550
55102 West 7th 7.5% $120,000 $234,500
55105 Mac-Groveland 5.1% $103,500 $394,950
The percentage ranking runs nearly opposite to the price ranking, but the dollar ranking doesn't, and that distinction matters. A $180,000 East Side building returning 9.2% throws off less cash than a $395,000 Mac-Groveland building returning 5.1%, but it takes less than half the capital to get into.
LEVERAGE
At 25% down on the median 55130 building, you're putting in $45,000 and getting $71,300 of appreciation over four years, which is 2.6 times your cash or about 26.6% annualized.
I'd treat that as a ceiling rather than a forecast, because it counts appreciation and nothing else. It ignores roughly 8% in transaction costs on the way out, four years of capex, vacancy, and the real possibility that the building was cash-flow negative the whole time. It also ignores principal paydown and rent, which cut the other way. The defensible version is narrower: leverage converted a single-digit return on the asset into a double-digit return on the cash, and that's most of why this asset class works.
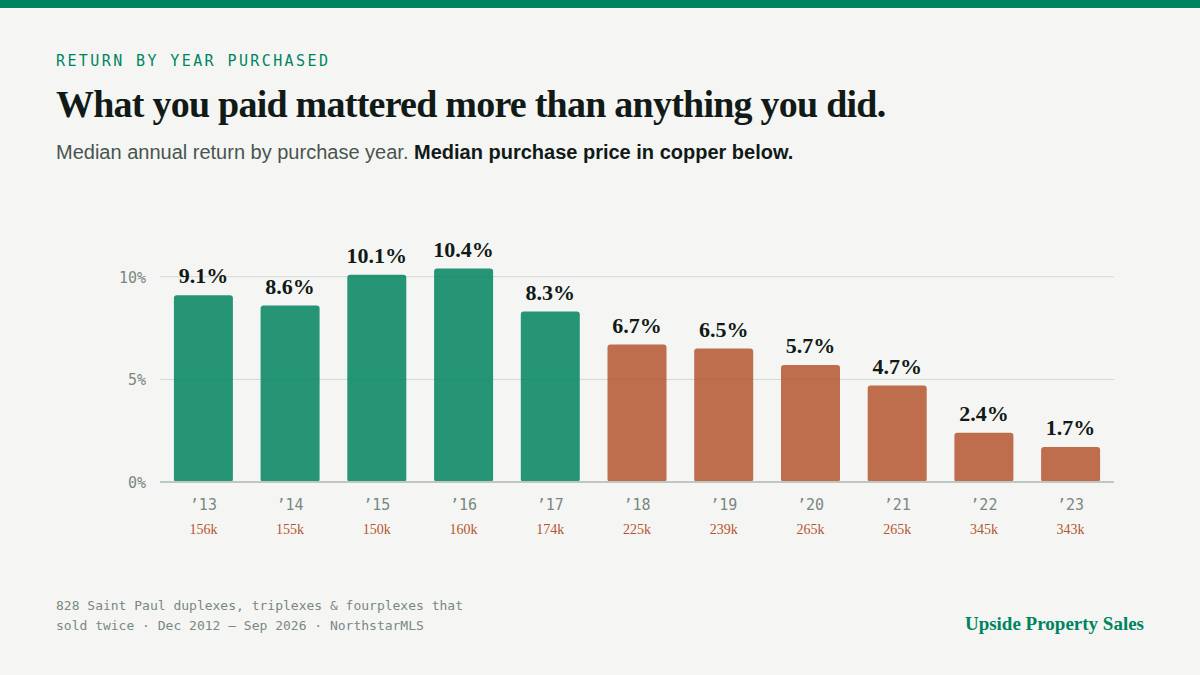
BY PURCHASE YEAR (median annualized, median purchase price)
2013: 9.1% $155,525
2014: 8.6% $155,000
2015: 10.1% $149,900
2016: 10.4% $159,950
2017: 8.3% $174,000
2018: 6.7% $224,500
2019: 6.5% $239,250
2020: 5.7% $265,000
2021: 4.7% $264,500
2022: 2.4% $344,500
2023: 1.7% $342,500
Entry year explains more of the variation than anything else I can measure here. The 2022 and 2023 rows are only 26 and 18 buildings, and only the ones that have already sold, so those two lines will move as more of those cohorts transact.
BY UNIT COUNT
Duplex n=715 median buy $191,000 gain $88,000 7.9%
Triplex n=55 median buy $205,000 gain $110,000 7.9%
Fourplex n=58 median buy $290,000 gain $144,950 9.3%
Fourplexes beat duplexes by 1.4 points annually and produced 65% more dollars per building. It's a small sample, but it matches a separate finding of mine that St. Paul fourplexes held their value against Minneapolis better than duplexes did through the rent stabilization period.
BY HOLD LENGTH (median gain, median annualized)
2-4 years n=310 $58,500 8.5%
4-6 years n=254 $89,050 7.9%
6-9 years n=197 $135,000 7.7%
9+ years n=67 $175,000 7.5%
The annualized return is remarkably flat across hold length, so longer holds produced more dollars rather than a better rate.
WHERE THIS COULD BE WRONG
1. Selection. A building has to trade twice to appear here, so owners who bought well and are still holding never show up. This is the standard repeat-sales selection problem and it can cut either way, since distressed sellers transact more often but so do successful flippers.
2. Renovation counted as appreciation. Dropping the sub-two-year holds removes most of it, but a building that got gutted in year three still books the improvement as return. One property in the top tail went from two units and 2,896 sf to three units and 4,395 sf, which is construction rather than the market. The median isn't very sensitive to this but the upper tail is.
3. Non-arms-length transfers. My screens catch most foreclosures and family transfers, but some survive, and they drag the low end down rather than up.
4. Appreciation only. There's nothing here about rents, expenses, capex or realized returns, and a building can appreciate 8% a year and still be a bad investment if it ate $40,000 in deferred maintenance.
5. The recent cohorts are incomplete and self-selected toward people who had a reason to sell early.
Every headline number was independently re-derived through a separate parsing and matching path, and the two agreed within 0.3% on all of them.
Poke holes in this. I'm particularly interested if anyone has a cleaner way to strip renovation out of the upper tail without throwing away real market return along with it.