Updated about 2 months ago on .

Asset Class Predictions
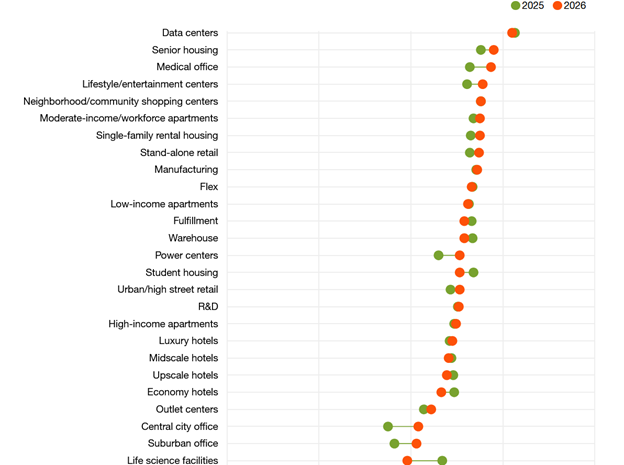
I don't see a copyright indicated on this graphic, so I'll post it here.
These are data from the Urban Land Institute and Price Waterhouse Cooper (I think that is what PwC stands for!).
The scale isn't visible--you have to mouse over it to see the number--on a scale from 1 to 5, with 5 being off the charts lucrative, and 1 being run for the hills.
Comments?