


PCE Rises, New Home Sales Drop, 14% Appreciation Forecast
Week ending May 30, 2026. Here is the full breakdown for investors tracking the data!

Inflation: April PCE
So PCE dropped this week and here is where things stand. Headline PCE rose 0.4% month over month, slightly cooler than expected, bringing the annual reading up to 3.8%. Core PCE (stripping out food and energy) rose 0.2% for the month, also a touch below forecast. Annual core edged up to 3.3% from 3.2%, still well above the 2% target.
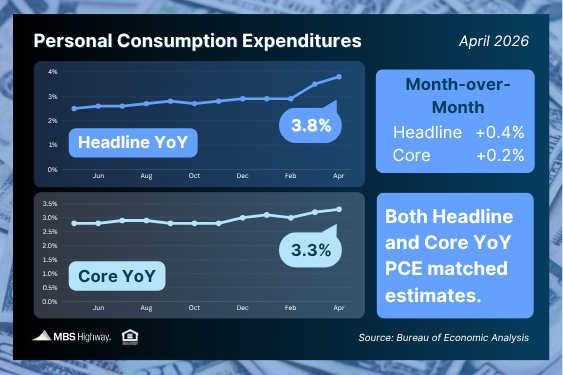
The Fed's balancing act continues: inflation above target, labor market softening, and Middle East tensions keeping energy price risk alive. All eyes are on Kevin Warsh's first meeting as Fed Chair on June 16 and 17 for rate path clarity.
Home Price Data and Appreciation Forecasts
Case-Shiller showed home prices up 0.7% month over month before seasonal adjustment and up 0.7% annually. FHFA came in at basically flat month over month on a seasonally adjusted basis with a 1.7% annual gain for conventionally backed loans.
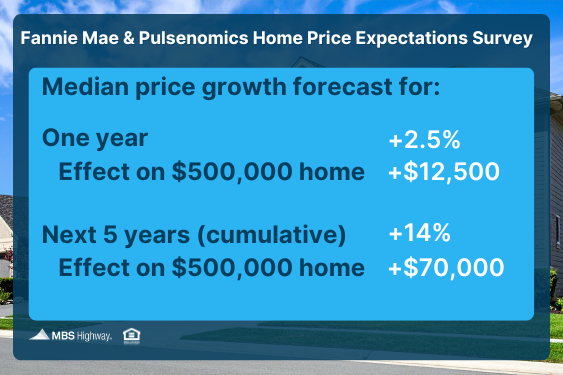
The bigger story is the Fannie Mae and Pulsenomics Home Price Expectations Survey (150+ economists and market strategists) projecting 14% cumulative appreciation over the next five years. On a $500,000 acquisition that is roughly $70,000 in value accretion before you factor in leverage or principal paydown. For SFR investors the long term thesis is holding firm even in a high rate environment.
New Home Sales
April new home sales came in at 622,000 annualized, down 6.2% month over month and 11.3% below year-ago levels. This measures signed contracts so it is a direct read on April buyer demand.
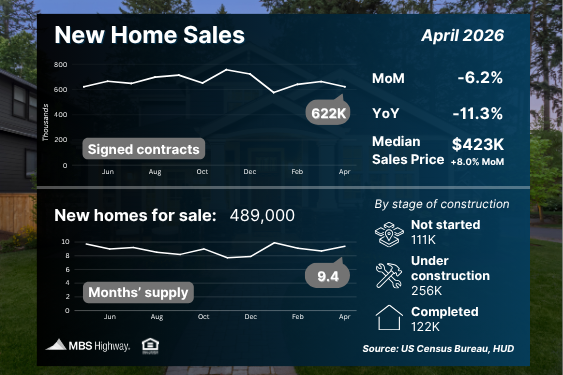
The inventory breakdown is the interesting part. Of the 489,000 new homes for sale only 122,000 are completed and ready to occupy. The rest are under construction or pre-ground. That limited inventory continues to support price floors on new construction and reduces direct competition with resale.
Economic Snapshot
Q1 2026 GDP second estimate: 1.6% annualized. Below the initial 2% read but well above Q4's 0.5% pace, which was weighed down by the government shutdown. AI investment and a government spending rebound drove growth, partially offset by import drag.
Jobless claims: initial 215,000, continuing 1.786 million (up 15,000). Headline initial claims are likely understating labor market stress given gig and freelance absorption trends. Elevated continuing claims signal longer job search timelines, worth watching for consumer demand and Fed timing.
Technical Picture
Mortgage bonds have been climbing since May 20 so we could be in for a meaningful constructive signal for rate direction. Technically constructive posture but Friday's jobs report is the real catalyst test for which direction we break.
What Is on Deck
Tuesday: JOLTS job openings. Wednesday: ADP private payrolls. Thursday: Weekly jobless claims. Friday: Nonfarm payrolls and unemployment rate.
Friday's jobs report is the week's key release. A soft print revives June cut expectations and could meaningfully shift financing costs for leveraged investors. Worth lining up your rate conversations before that data lands.
- Derek Brickley
- [email protected]
- 734-645-7722
