Coronavirus Rental and Housing Market Trends Continue: April 29, 2020 Market Update

Examining the rental market this week, we see a continuation of several trends that have been established since the coronavirus pandemic began interrupting normal economic activity.

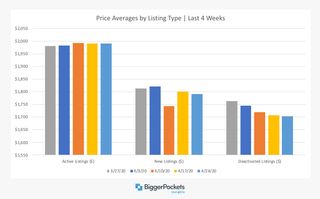
On a national level, the asking price for rents rose 0.2%, to $1,985. Inventory continued its modest slide, down 0.5% from last week, to 676,000. For a full view of inventory across all U.S. markets for this week, click here (password: insights).
The more significant changes can be seen when we look at the three types of inventory we’re tracking as a part of BPInsights: new, active, and deactivated listings. Within these subcategories, there have been some significant declines in activity.
New listings continue their trend and are down 32% week-over-week (WoW). This is the sharpest weekly drop we’ve seen since we began tracking this data in mid-March. Overall, new listings are down nearly 50% in the last five weeks. While jarring, this drop is not unexpected—and could potentially signal good news for landlords.
One reasons new listings might be dropping is because landlords and property managers are choosing not to list vacant units until the economy begins to recover and they can command a higher rent. However, I believe the drop in new listings is actually a sign that landlords and tenants are working together to find mutually agreeable solutions to the current economic challenges, as well as a sign that people are simply moving less. To me, this is encouraging. I believe the best-case scenario for both tenants and landlords right now is to work together and keep renters in their current residences.

Deactivated listings are down 23% WoW—and down 68% since 3/27, the first week we started tracking this data. Again, this is troubling but not unexpected. No one wants to move right now, a trend I believe will continue for at least a few more months.
The lack of demand in the rental markets continues to put downward pressure on rent prices. Deactivated listing prices (which we use as our proxy for “market rent”) are down 0.25% WoW, but that is the smallest decline in the five weeks we’ve been tracking this data. While one week of data does not really tell us anything, it’s something we’ll keep an eye on. A leveling off of deactivated listings could signal the market has found a bottom and a new normal. Hopefully this number will at least remain stable (or go up, but I find that unlikely) over the next few weeks.
Who is Getting Hit Worst?
, we dug into a trending discussion among real estate investors: Will the COVID-19 pandemic lead to a decline or even a reverse of urbanization? In an effort to answer that question, I showed that the average price of a deactivated listing has remained constant for houses over the last quarter, while prices have dropped around 10% for apartments. This data provides some valuable clues as to what has happened. Still, the information is not perfect, so I tried to look at this question in a new way this week.
I broke down cities into three buckets: small, medium and large. I did this based on each city’s average inventory, so it’s not exactly the same as looking at population. It’s based on how many rental units are deactivated on average each week.
- Large cities range from big metropolises like New York City and Chicago to cities like New Orleans, LA and Anaheim, CA.
- Medium cities encompass locales like Omaha, NE and Boise, ID on the large end, down to Albany, NY and Macon, GA on the small end.
- Small cities refer to places like Asheville, NC and Fredericksburg, VA, as well as small towns and villages.

Simply put, large and medium-sized cities are getting hammered. Specifically, large cities are seeing major losses, with an average reduction in deactivations of 72%. Medium-sized markets are not faring much better, with an average loss of deactivations of 67%. Small cities are managing by far the best, with an average loss of deactivations of just 28%.
This data does seem to support the idea that smaller, less dense areas are less affected by the current economic climate. Make no mistake—no market that I have seen is prospering in recent weeks, but small markets are doing the least badly. In normal times, a decline in deactivations of 28% would be devastating, but in our current economic situation, only being down 28% is doing relatively well.
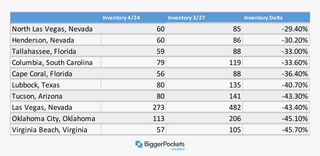
You can take a look at how every market in the U.S. is doing with these inventory declines in this week’s spreadsheet (password: insights) on the “DL Analysis” tab. I also included a breakdown of the top 10 most resilient large markets, as well as the bottom 15 markets below.
Las Vegas seems to be doing particularly well, which confuses me a bit. I would think Las Vegas would be suffering in this market given that casinos are closed, and a large percentage of the population works in the service industry. Still, the data appears to show the opposite to be true—three of the eight cities with the smallest deactivation declines are in the Las Vegas metropolitan area. The rest of the top 10 is largely in the southern half of the country, with Virginia Beach, VA being the northernmost city on this list.

The list of the 15 most dramatically impacted cities in the U.S. looks different geographically. The five markets most affected are all in or around New York City. This is no surprise, given that NYC is the epicenter of the epidemic in the United States. The remainder of the cities is more dispersed geographically.

The key takeaway from this data is simple: People are not moving. Even in the most resilient markets in the U.S., demand is down 30%, and in some of the largest markets in the country, demand is down more than 90%. My personal opinion is that demand is likely to remain down for at least a few more months, and I would therefore advise any landlords reading this to find a way to keep current tenants.
Note: While our data is extensive, we do not have data for every single rental unit in the country. This data is providing a very large sampling from across the country, and we believe it accurately shows the trends in the rental market.
New Housing Starts and New Listings Fall
compared to the previous month. Although this is the largest drop since March 1984, the rate of 1.22 million was still 1.4% higher than March 2019. Starts on multifamily building fell 32%, and single-family dropped 17.5%. The decrease was greatest in the Northeast. Single-family declines were greatest in the Midwest, but increased in the West.
Permits slowed much less. They fell only 6.8% from February and were still 5% higher than 2019.
The number of 47% the week ending 4/11. During the first half of March, the number of new listings had been growing around 5%.
Growth in home prices is also slowing. As opposed to the 4.4% annual increase seen the first two weeks of March, mid-April saw only 0.8% year-over-year growth. It is surprising to see prices continue to rise during this economic climate, and we will continue to monitor this situation.
Not surprisingly, in its confidence index to its lowest level since June 2012. This is the largest shift in the index’s 30-year history.
Changes in Mortgage Forbearance Volume & Requirements
For the week ending 4/12, the percentage of total home loans in coronavirus/COVID-19-related forbearance grew from 3.74% to 5.95%, a nearly 60% increase. Ginnie Mae-backed mortgages in forbearance grew 40%, from 5.89% to 8.26%. Fannie Mae and Freddie Mac forbearance loans increased 90%, from 2.44% to 4.24%.
At the same time, the Federal Housing Finance Agency (FHFA) has changed the number of payments servicers must make on forbearance loans backed by Fannie Mae and Freddie Mac (Government-Sponsored Enterprises, or GSEs). Only four months of borrowers’ missed principal and interest are required. There is “no further obligation to advance scheduled payments” after that.
The definitive timeframe for required payments—even as borrowers may continue to be unable to cover their mortgages—is intended to create stability and clarity for servicers.
FHFA is also changing the policy that would normally have GSEs buy mortgages that have been delinquent for more than four months from mortgage-backed securities pools. Instead, to eliminate the risk of liquidity issues for the GSEs, pandemic-related forbearance loans will stay in the pools for the length of their forbearance plans.
Buyer Traffic Spikes
At the same time as home listings and sales drop, buyer traffic on Zillow has gone up. Even though for-sale listings dropped up to 19% in mid-March, overall visits increased up to 13% in mid-April compared to a year ago.
Minneapolis, San Francisco, and Los Angeles all saw big jumps after their initial declines. The New York area and Boston are both near, or back to, normal levels after their mid-March falls.
Hopefully this does signal that buyers are still eager to purchase homes once they are able to. I believe that buyer demand will come back relatively quickly (once the larger economy starts to recover), particularly if buyers sense a decrease in competition leading to more of a “buyer’s market” than we’ve seen in the last several years.
Volatile Mortgage Rates
When mortgage rates fell at the end of February, common wisdom was that they would continue their decline. They didn’t. The three-month period looked something like this:

Here’s why: A sell-off in the bond market caused bonds to fall in value, which raises mortgage interest. At the same time, lenders raised rates in an effort to control the overwhelming flow of refinance applications they received as a result of the previous drop.
In mid-March, the Fed also announced the first of two pledges to buy large amounts of mortgage-backed securities over several months to stabilize markets. It bought almost $110 billion of its initial $200 billion pledge in one week.
This helped calm markets, and mortgage rates dropped again.
Delayed Appraisals for Credit Unions
The National Credit Union Administration has followed federal banking regulators to allow credit unions to delay mortgage appraisals for up to 120 days after closing. The move is to “extend liquidity to creditworthy households and businesses” during COVID-19 disruptions.
The rule change does not apply to loans sold to or guaranteed by the Federal Housing Administration (FHA), Department of Housing and Urban Development (HUD), the Department of Veterans Affairs (VA), Fannie Mae, or Freddie Mac. Each of these agencies’ existing rules remain in place.
Conclusion
As several U.S. states move towards reopening their economies in various phases, there will be much uncertainty surrounding whether these efforts result in a resurgence of COVID-19 cases, and if so, how overall recovery will look. Stay tuned to BPInsights for a data-driven outlook on how upcoming progress and challenges affect the real estate market.
