The Best Large and Small Markets for Forced Appreciation: August 2020 Markets of the Month

Today, we’re going to search for markets with the greatest opportunities for forced appreciation. What is forced appreciation? It’s when an investor substantially improves a property—thereby raising the value. Good flippers and BRRRR investors always look for forced appreciation opportunities, because by renovating properties, they become more valuable. For example, a flipper might buy a house for $200,000, renovate it for $50,000, and sell it for $300,000 a few months later. That investor “forced” that property to appreciate by $100,000 and thereby profited $50,000. Conversely, traditional appreciation is more dependent on macro-economic market trends. For this analysis, I investigated which markets offer the biggest potential for forced appreciation. I’m really excited for this analysis and think there are some valuable learnings below—but first, a word of caution. I’m not a house flipper, and I have never done a proper BRRRR. I’ve renovated properties, but I’m not an ARV expert. However, I am pretty good at data analysis. I hope I can offer some insight. In this article...
- How to use data to determine markets ripe for forced appreciation
- How calculating a property's "effective year built" can help you determine where rehab money is best spent
- The top large and small markets where BRRRR and fix and flip investors can expect high return on investment.
Analysis and Methodology
For this study, I downloaded a BPInsights dataset including every U.S. property with an “effective year built” (EYB) of 1980 or later.
What is “effective year built”?
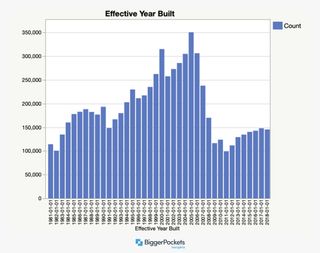
EYB is a really useful stat, which typically comes from county assessor’s offices. It shows the year the house was built or the year the house was significantly renovated. This is super important and useful: When looking for forced appreciation opportunities, you want to know when the house was last renovated to modern standards , not when builders first poured the foundation. As an example, I own a Denver property built in 1897. You might think that means the property is ripe for forced appreciation, but it was completely renovated and expanded in 2013. The year built is 1897, but the EYB is 2013. It would not make a good target for forced appreciation, because it’s a relatively modern home. Below is a histogram showing the EYB of properties in the U.S. over the past 40 years. 


- Houses renovated within the past 10 years maintain “peak” value. If you’re considering selling a property, this graph might offer some guidance on timing.
- Right around 30 years (more like 31), prices move from the “stable” to the “decline” phase. Something to consider when buying and holding investment properties.
Given these distinct patterns, I next looked for markets with the greatest variance between the median value of “peak” and “stable” properties. Why? Because a large difference between peak and stable creates a fantastic opportunity to improve your investment’s value with forced appreciation. Note: I compare the “stable” and “peak” phases, not the “decline” and “peak,” for two reasons. First, the decline phase is not as consistent and stable, meaning it may not produce meaningful information. Second, I don’t want this article to be 20 pages long. I’m picking what I believe to be the more meaningful analysis. I am also limiting this analysis to properties with two bedrooms and two bathrooms. Otherwise, any given market’s unique property mix could skew the analysis. By only pulling numbers for two-bed, two-bath properties, we get the most accurate comparison across markets.
Top Large and Small Markets for Forced Appreciation
When I first ran this analysis, I was overwhelmed by the number of great markets for forced appreciation. To make my analysis easier, I decided to break it out into two different tables:
- Large markets with 1,000-plus properties that fit my criteria
- Small markets with less than 1,000 properties.
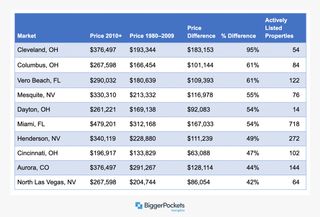
Here’s how to read the tables below.
- Price 2010+ : The median home value for a two-bed, two-bath property with an EYB of 2010 or later
- Price 1980–2009 : The median home value for a two-bed, two-bath property with an EYB between 1980 and 2009
- Price Difference : The absolute difference in median value between Price 2010+ and Price 1980–2009
- % Difference : The relative difference in median value between the Price 2010+ and Price 1980–2009
- Actively Listed Properties : The number of two-bed, two-bath properties with an EYB between 1980 and 2009 currently listed on the MLS.
As an example, we could read the Cleveland, OH, line as such:
- Two-bed, two-bath properties with an EYB of 2010 or later are worth, on average, 95 percent more than similar properties with an EYB between 1980 and 2009.
- The absolute difference is $183,153. Meaning: If you could renovate an older property and bring it up to modern standards for less than $183,000, you would likely turn a profit.
- There are 54 two-bed, two-bath properties with an EYB between 1980 and 2009 on the market as of July 31, 2020.
Top large markets for forced appreciation

Top small markets for forced appreciation

