


Austin Market Report - March 2026
The March 2026 data for the Austin, Texas metro shows a spring market with real signs of life, with pending units up nearly 12% on a year-over-year (YOY) basis and total sales climbing 5.6%. Prices remain slightly lower YOY, but the trend lines are flattening and overall dollar volume increased more than 4%. Mortgage rates have pulled back from their late March highs and are settling in the low to mid 6% range, which is an improvement from where we were just a few weeks ago.
Key Highlights:
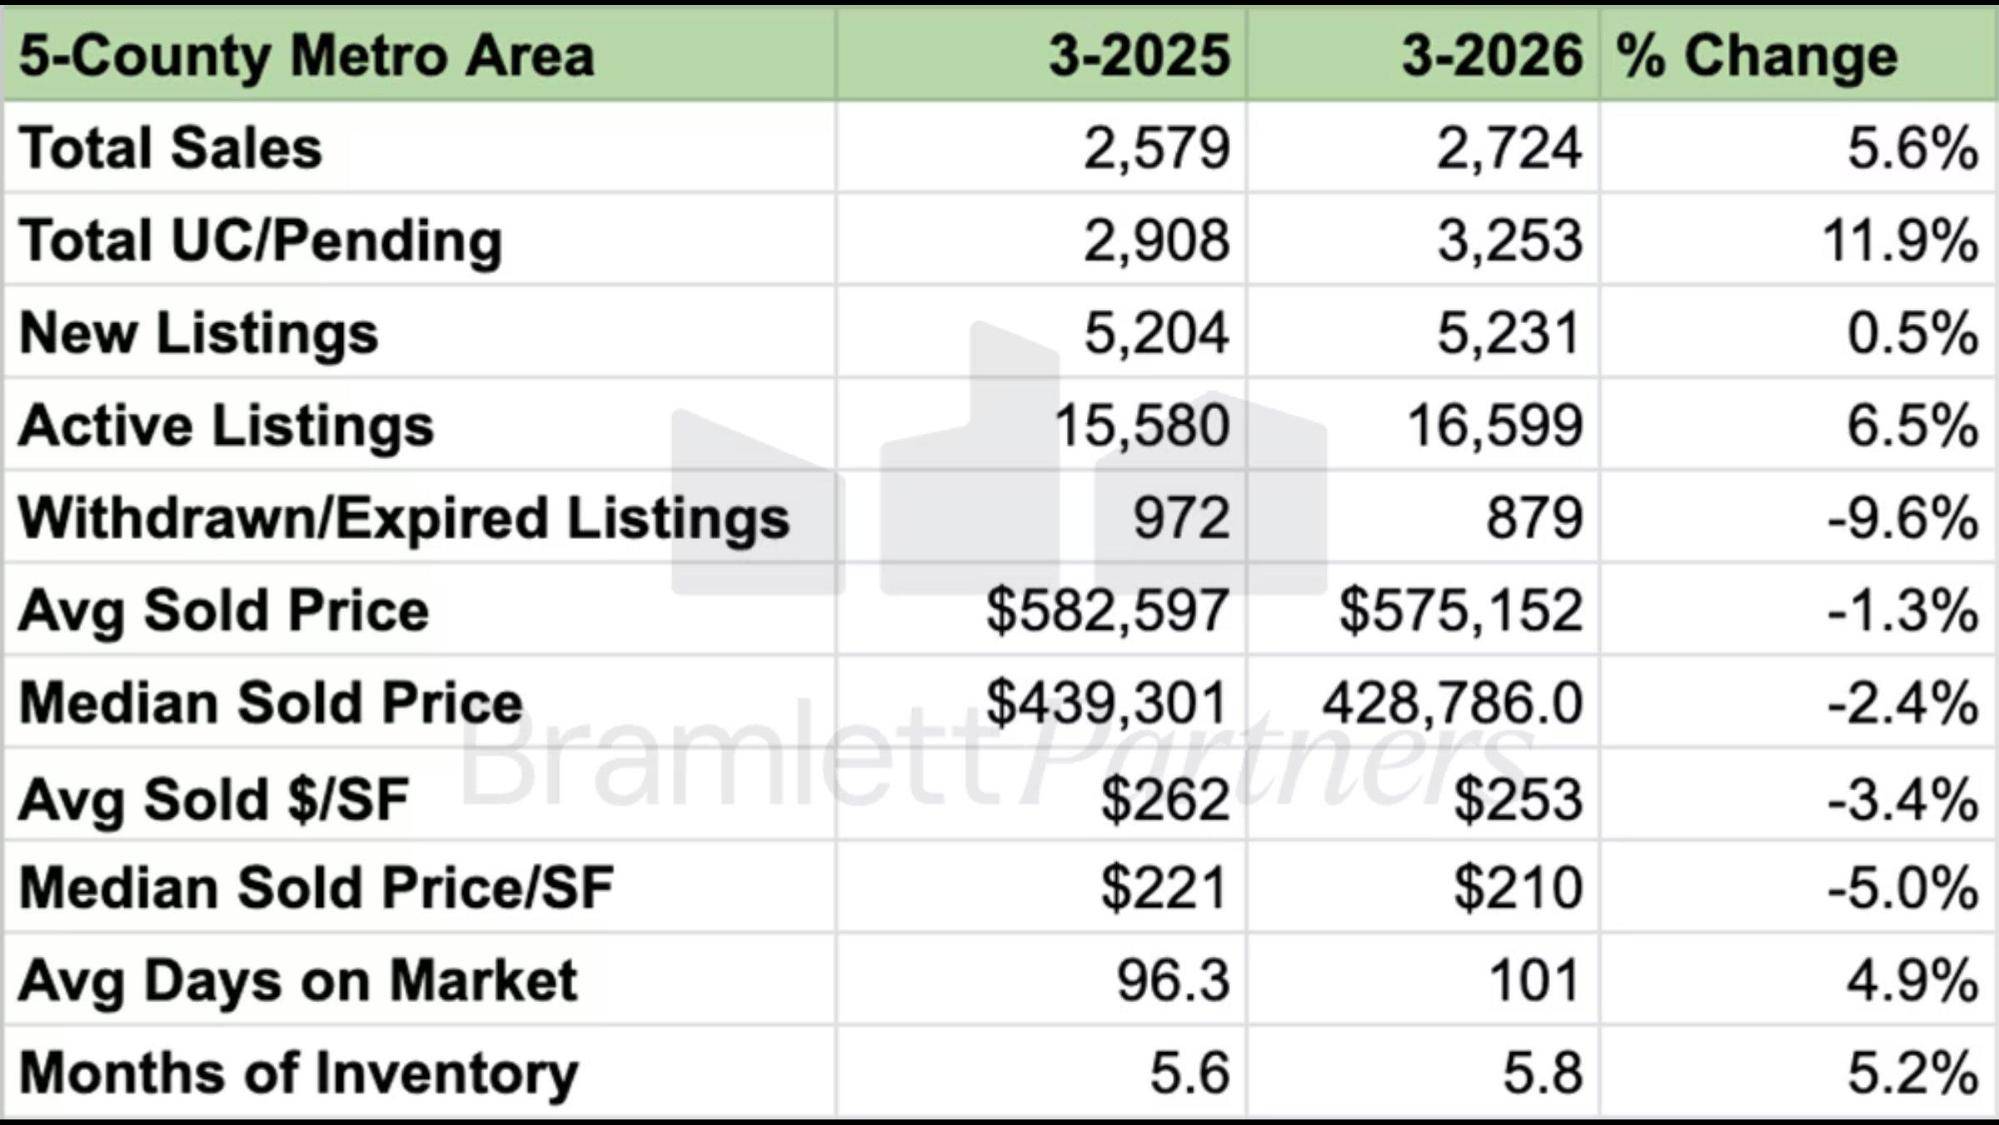
- Months of Inventory (MOI) in the Metro edged up to 5.8, a slight increase from last year’s 5.6 and firmly in balanced market territory.
- YOY Avg Sold Price declined only 1.3% to $575,152 while Median Sold Price declined 2.4% to $428,786, both of which represent a flattening trend.
- Total Pending/Under Contract units jumped +11.9% YOY to 3,253, the strongest demand signal we’ve seen in months.
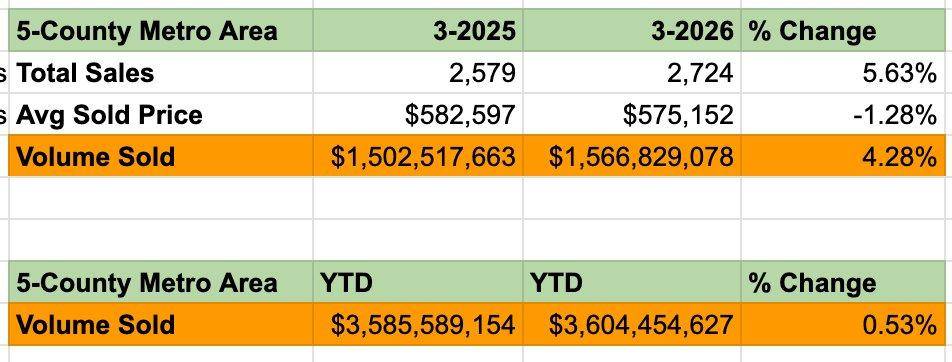
- Total closed sales increased +5.6% and total dollar volume increased +4.3% to $1.57 billion for the month.
- Mortgage rates have eased to roughly 6.37% (30 year fixed) after spiking above 6.6% in late March.
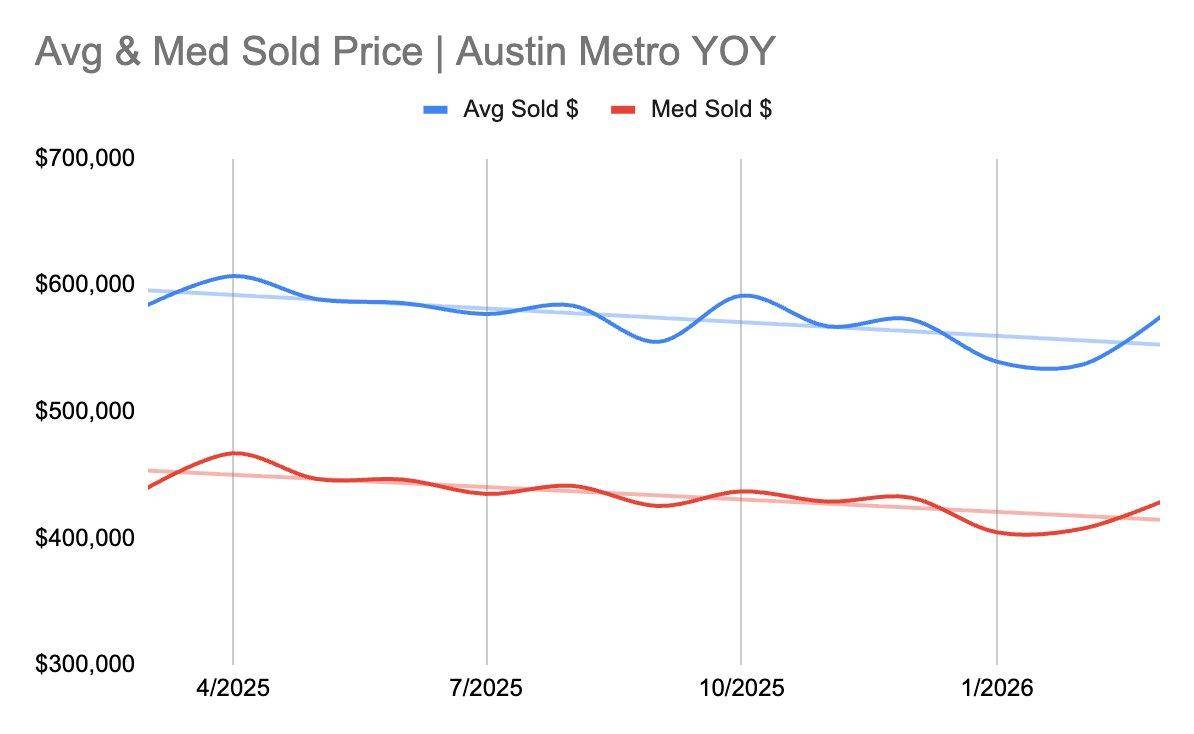
Avg and Median Prices Continue to Flatten
Average and Median Sold Prices both declined modestly on a YOY basis, with Avg Sold Price down 1.3% and Median Sold Price down 2.4%. While prices remain below last year’s levels, the trend line over the past several months shows a clear flattening pattern. We are not seeing significant further declines, and the month-over-month trajectory heading into spring is consistent with normal seasonal appreciation. The price per square foot numbers tell a similar story, with Avg Sold $/SF at $253 (down 3.4%) and Median $/SF at $210 (down 5%). Sellers who price realistically are finding buyers, and the overall picture is one of stabilization rather than continued decline.
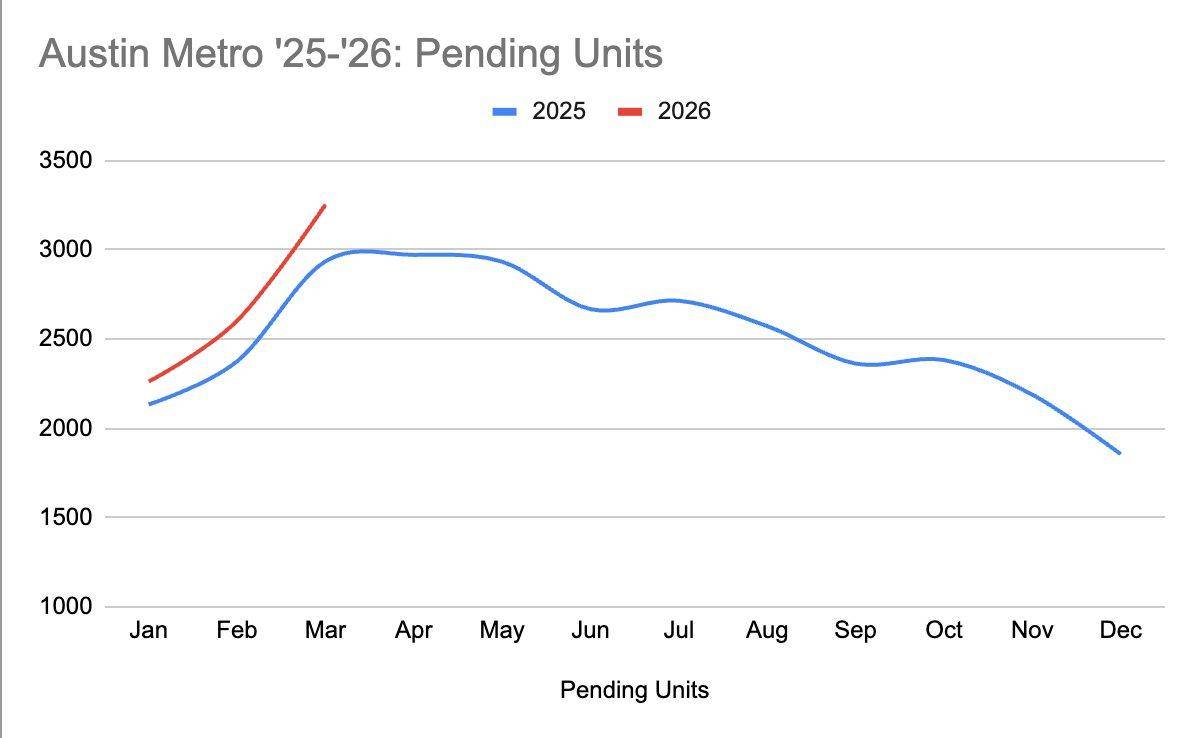
Pending Units Show Real Demand Growth
This is one of the more encouraging data points in the March report. Pending units surged to 3,253, up 11.9% from 2,908 in March 2025. The 2026 pending unit curve is tracking well above the 2025 curve through the first three months of the year, which is a strong forward indicator for Q2 closings. This increase in contract activity tells us that buyers are actively engaging and making decisions, even with mortgage rates in the 6% range. Combined with the 5.6% increase in closed sales, the demand side of the equation is clearly healthier than it was a year ago.
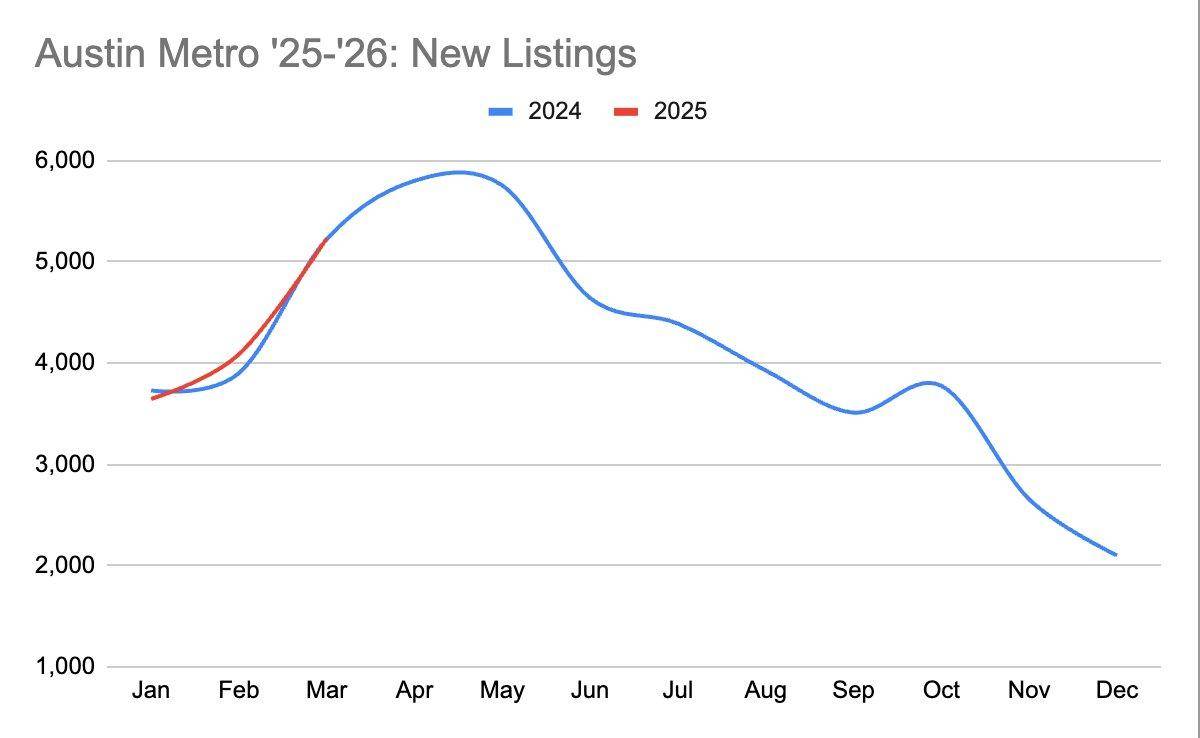
New Listings Flat While Active Inventory Grows
New listings came in essentially flat YOY at +0.5%, with 5,231 new listings hitting the market in March. However, active inventory increased 6.5% to 16,599, which tells us that homes are sitting a bit longer before selling (Avg Days on Market increased to 101 from 96). Withdrawn and expired listings actually declined 9.6%, which suggests fewer sellers are giving up and pulling off the market compared to last year. The net effect is more options for buyers and a market that rewards proper pricing and preparation.
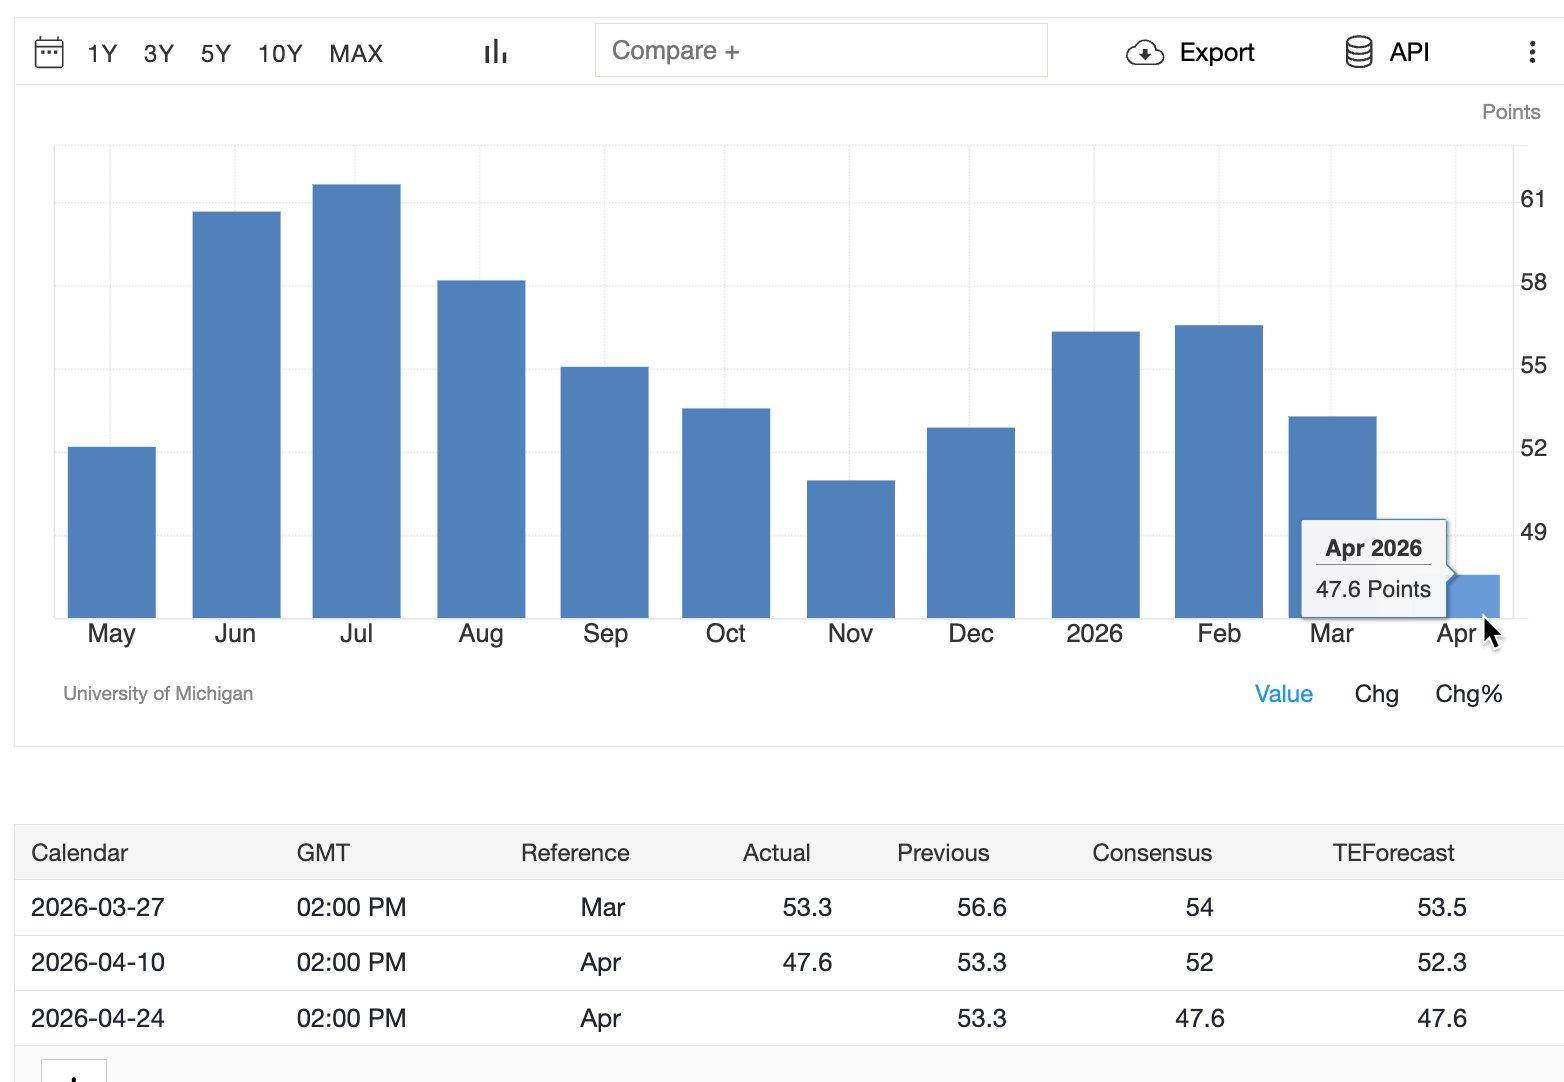
Consumer Sentiment Drops, But Context Matters
The University of Michigan Consumer Sentiment Index fell to 47.6 in the preliminary April reading, down from 53.3 in March. This is one of the lowest readings in the survey’s history. The decline was broad-based and reflects increased consumer caution. In recent years, sharp drops in consumer sentiment have not always translated into reduced spending, and locally, the Austin market’s March pending unit data suggests buyers are not yet pulling back.
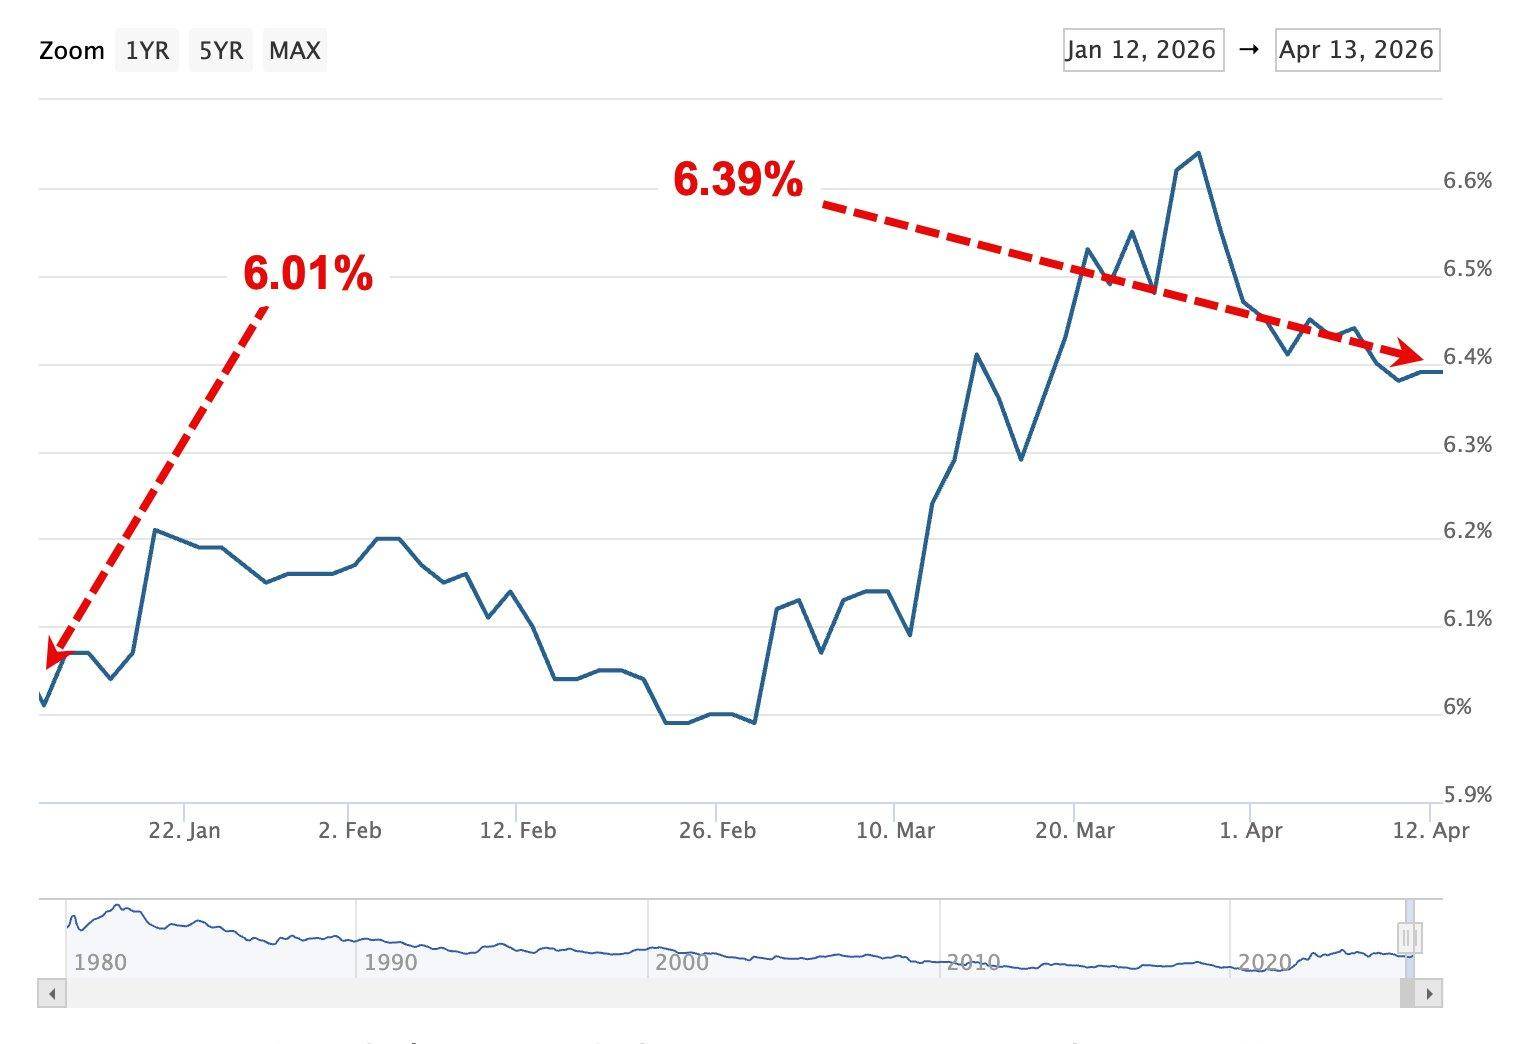
Mortgage Rates Ease from Late March Highs
After starting the year around 6%, mortgage rates climbed through February and into March, peaking above 6.6% in late March. The 30-year fixed-rate mortgage averaged 6.37% as of April 9, 2026, down from the prior week’s 6.46%. This pullback is a welcome development heading into the heart of the spring buying season. Even relatively modest changes in mortgage rates can affect affordability and influence buyer activity.
If you’re a buyer
The spring 2026 market is presenting a more favorable environment than in recent years. You have more inventory to choose from than at any point in the last several years, prices remain below 2024 and 2025 levels in many areas, and mortgage rates have eased from their recent highs. The increase in pending units tells us that other buyers recognize this window too, so competition is picking up. If you find a property that works for you at a price that makes sense, this is a solid time to act.
If you’re a seller
The demand side of the market is genuinely improving, with pending units up almost 12% and closed sales up more than 5%. That said, inventory remains elevated and buyers have options. Pricing your home correctly from day one remains critical. Homes that are priced well are moving, while homes that are overpriced are sitting. Average Days on Market is 101 days in the Metro, so patience is still required, but the data is moving in the right direction.
Always remember that real estate is hyperlocal and situation-specific. If you’d like to talk through your plans, I’d be happy to help.