

Austin Market Report - May 2026
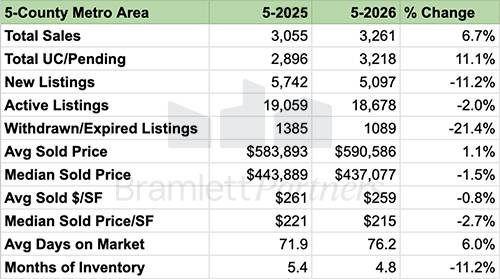
The May 2026 data for the Austin, Texas metro continues to show stronger buyer activity than we saw last year. Pending units increased 11.1% year-over-year, total sales climbed 6.7%, and total dollar volume increased nearly 8% to $1.93 billion for the month.
Pricing remains mixed but relatively stable. Average sold price increased 1.1% YOY, while median sold price declined 1.5%. Months of inventory dropped from 5.4 last May to 4.8 this May, while average days on market increased from 72 to 76 days.
The overall picture is similar to what we saw in April. Demand has improved compared to last year, but buyers remain selective and the market continues to reward realistic pricing.
Key Highlights
Total Sales increased 6.7% YOY to 3,261 closed transactions, while Total Volume Sold increased 7.95% to $1.93 billion for the month.
Total Pending/Under Contract units increased 11.1% YOY to 3,218. Pending units remain one of the clearest indicators of buyer demand, and activity continues to run ahead of last year’s pace.
Months of Inventory declined from 5.4 to 4.8 months, a decrease of 11.2%. That moves the market closer to balanced territory and gives sellers a somewhat more favorable supply environment than they had last year.
Average Sold Price increased 1.1% YOY to $590,586, while Median Sold Price declined 1.5% to $437,077. Pricing remains mixed, but the year-over-year decline in median price continues to narrow.
New Listings declined 11.2% YOY and Withdrawn/Expired Listings declined 21.4%. Fewer homes entered the market, while fewer sellers removed their listings without a sale.
Pricing Stabilizes with Diverging Signals

As you can see in the chart above, Average and Median Sold Prices have both moved higher from the softer winter levels. Average Sold Price increased 1.1% YOY to $590,586, while Median Sold Price declined 1.5% to $437,077. The two measures are still telling slightly different stories, but the broader takeaway is that pricing appears relatively stable.
Pending Units Are Running Well Ahead of 2024 and 2025

As you can see in the chart above, the the 2026 pending unit curve reached its spring peak in March and April at levels meaningfully above both 2024 and 2025. May's reading of 3,218 is still running well ahead of those prior years at the same point in time.
Pending units are one of the clearest indicators of buyer demand because they represent actual buyers moving forward with purchases. The modest decline from the spring peak is consistent with the seasonal pattern we saw in prior years, while activity remains notably stronger than it was last May.
Volume Sold Reflects Stronger Market Activity
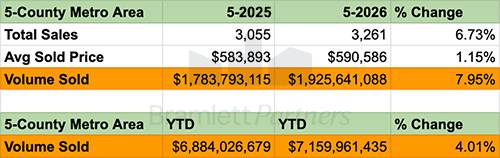
Total dollar volume sold for May came in at $1.93 billion, up nearly 8% year-over-year. Year-to-date volume through May now stands at $7.16 billion, compared with $6.88 billion through the same period last year, an increase of approximately 4%.
These are not dramatic gains, but they reinforce the broader picture. Total sales, pending units, and dollar volume are all running ahead of last year's pace.
Mortgage Rates and Consumer Sentiment Remain Headwinds

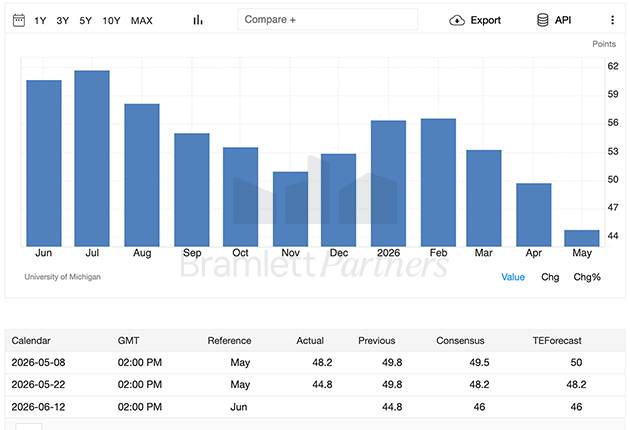
As you can see in the charts above, the broader economic backdrop remains mixed. The University of Michigan Consumer Sentiment Index fell to 44.8 in May, below the consensus estimate of 48.2 and down from around 56 in February. Mortgage rates have also moved back to approximately 6.6% in early June after dipping earlier in the spring, giving back some of the affordability improvement we saw earlier in the year.
Neither trend has prevented stronger buyer activity in Austin compared with last year, but both remain worth watching. Elevated mortgage rates continue to affect affordability, while weaker consumer sentiment may make some buyers more cautious about major purchases.
If You’re a Buyer
The spring 2026 market continues to give buyers meaningful choice. Inventory remains healthy at 4.8 months, median sold price is still down 1.5% YOY, and many sellers are willing to negotiate. However, the 11.1% increase in pending units shows that buyer activity has picked up compared with last year. Well-priced properties are seeing more attention, especially in certain neighborhoods and price points.
If You’re a Seller
The selling environment has improved, but pricing strategy still matters. Total sales and pending units are up, while months of inventory declined from 5.4 to 4.8 months. Buyers remain selective, so sellers who price realistically, prepare the property appropriately, and respond promptly to feedback are in a much better position than sellers who anchor to older pricing expectations.
Always remember that real estate is hyperlocal and situation-specific. Metro-level data is useful, but neighborhood, property type, condition, pricing, and seller motivation can all change the picture quickly. If you’d like to talk through your plans or a specific property, I’m always happy to help.