


Updated 5 months ago on . Most recent reply

December Las Vegas Rental Market Update
Sorry for the delay of the December update. I neglected to send it during the holidays;).
For a more comprehensive look at the Las Vegas investment market, please DM me for a link to our blog. There, you'll find detailed information on investing, both in general and specifically in Las Vegas.
Before I continue, note that unless otherwise stated, the charts only include properties that match the following profile.
- Type: Single-family
- Configuration: 1,000 SF to 3,000 SF, 2+ bedrooms, 2+ baths, 2+ garages, minimum lot size is 3,000 SF.
- Price range: $320,000 to $475,000
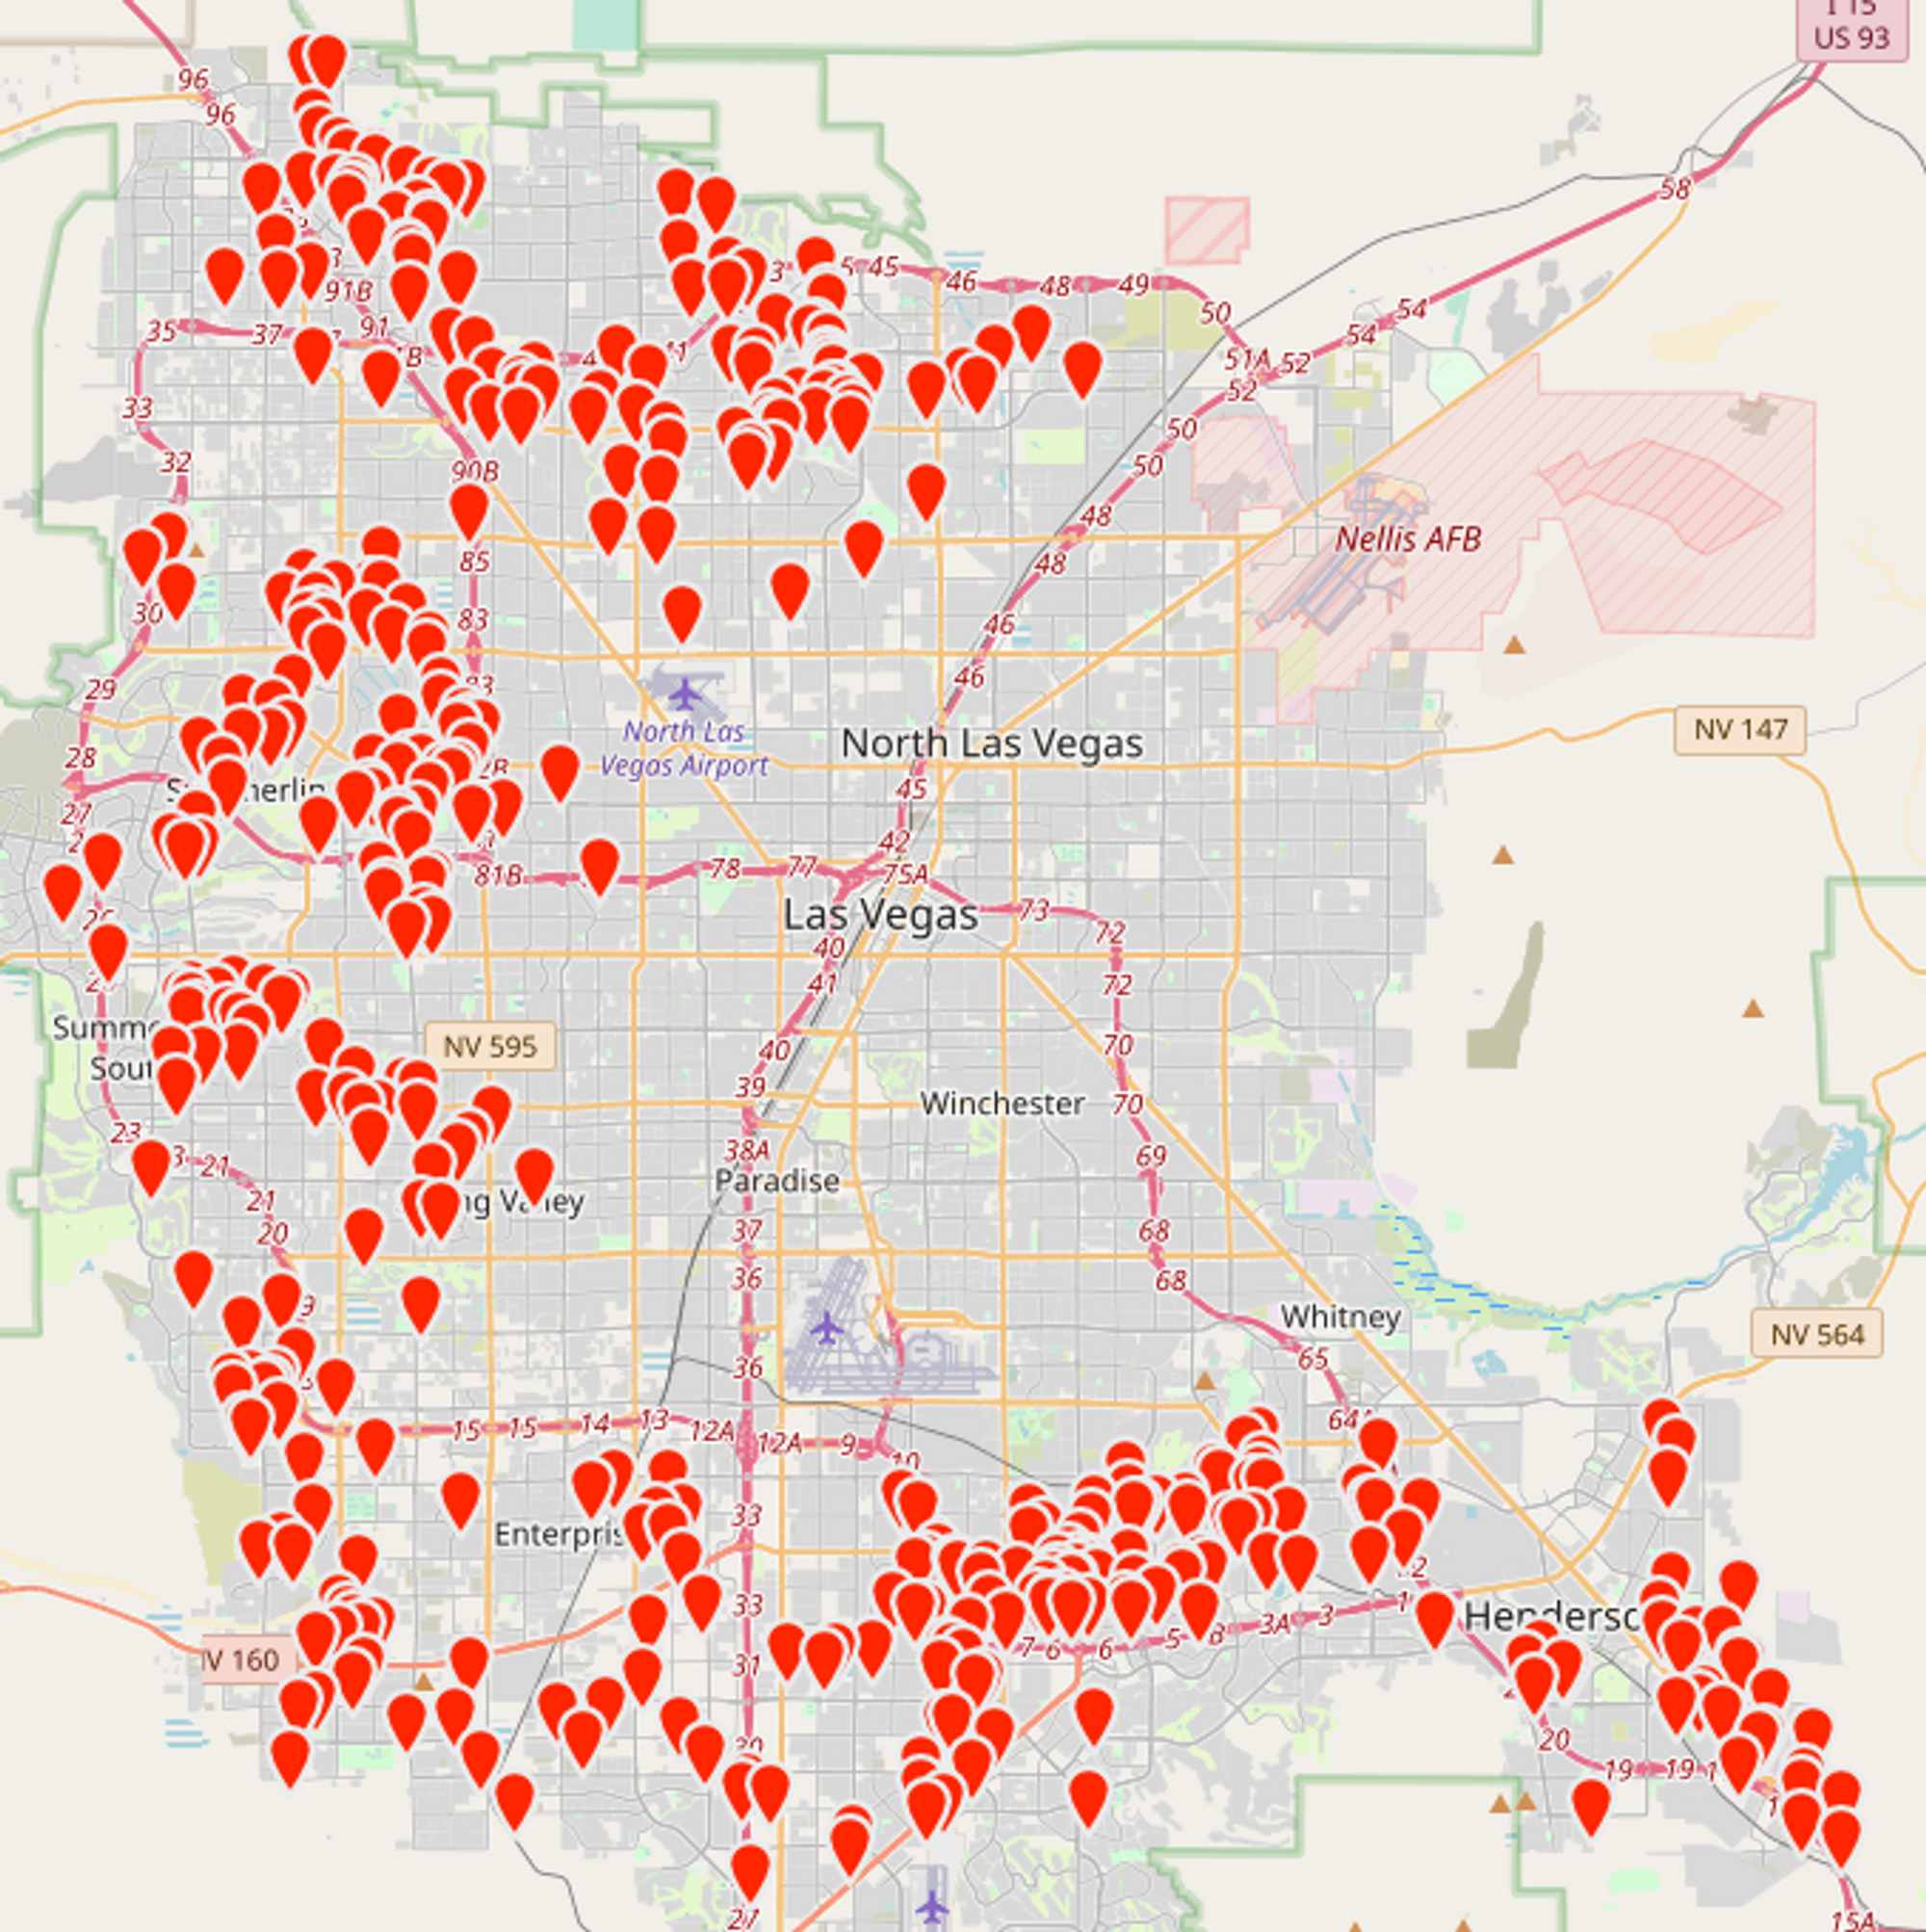
- Locations: See the map below
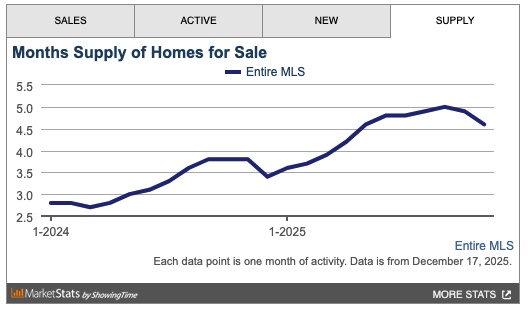
Overall Market Inventory
The chart below, from the MLS, includes ALL property types and price ranges. The overall inventory is trending down.
Rental Market Trends
The charts below are only relevant to the property profile that we target.
Rentals - Median $/SF by Month
Rents were flat MoM. The median $/SF has remained in a tight band of $1.16/SF and $1.20/SF for the past 13 months.

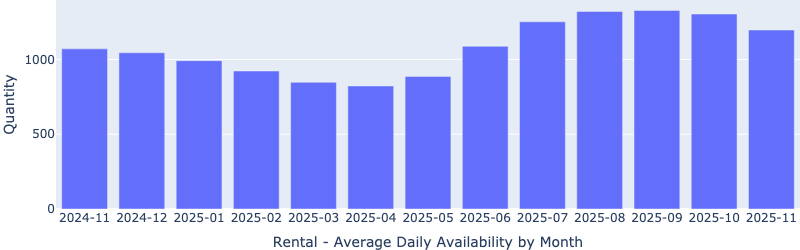
Rentals - Availability by Month
The number of homes for rent continues to decrease MoM, which is unusual for the time of year (it usually rises during the fall).
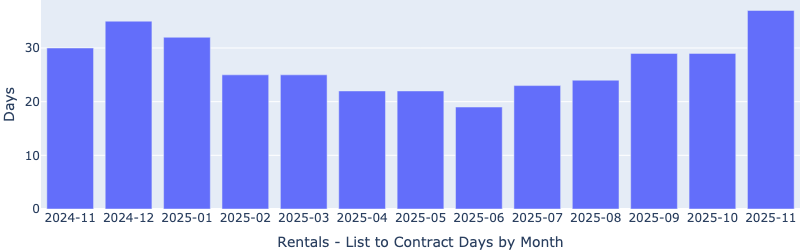
Rentals - Median Time to Rent
Median days to rent increased moderately MoM, conforming to the seasonal trend.
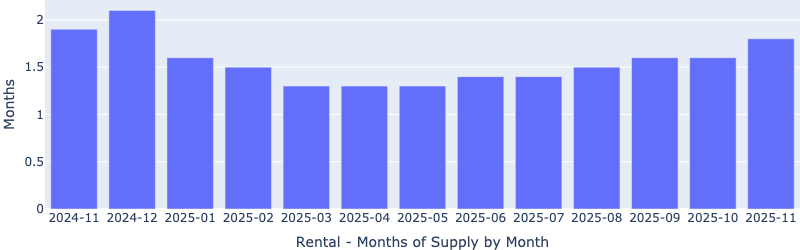
Rentals - Months of Supply
Rental inventory increased MoM, now at almost 1.8 months, still a landlord’s market.
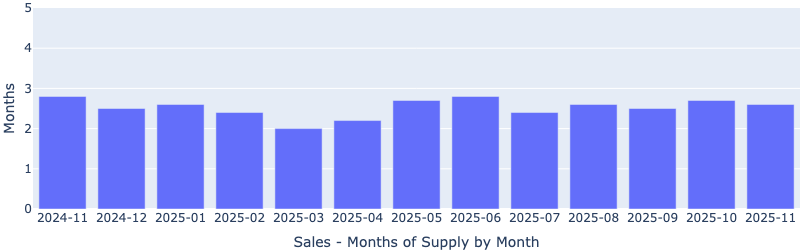
Sales - Months of Supply
Sales inventory has remained in a tight band around 2.5 months for the last several months, indicating a consistent seller’s market.
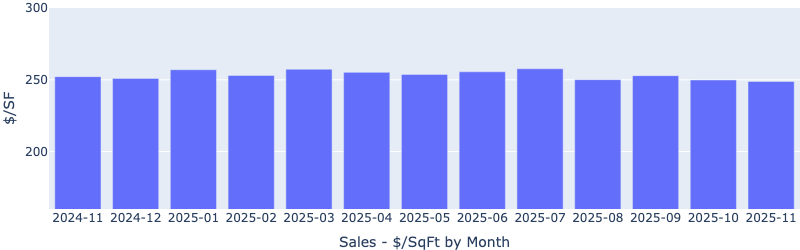
Sales - Median $/SF by Month
Prices were basically flat MoM, a bit unusual for the time of year (it usually drops in the fall).
Why invest in Las Vegas?
The goal of real estate investing is long-term financial independence. That means more than just replacing your current income—you need an income stream that grows faster than inflation to sustain your lifestyle indefinitely. In the property segment we focus on, rents have risen by an average of 7% and sale prices by 9% annually since 2015.
What causes rents (and prices) to increase?
Supply & Demand
Unlike financial markets, real estate prices and rents are driven by supply and demand. What is the supply and demand situation in Las Vegas?
Supply
Las Vegas is unique because it is a tiny island of privately owned land in an ocean of federal land. See the 2022 aerial view below.

Our target tenant segment can only qualify to rent properties priced between $350,000 and $475,000. New single-family homes in desirable areas start at $550,000, largely due to high land costs (over $1M per acre). As a result, the inventory of single-family homes in the $350,000 to $475,000 range remains nearly fixed, while demand continues to increase due to the rising population.
Demand
Population growth drives housing demand. Clark County, which includes Las Vegas, gains approximately 115 new residents every day. The county is expected to add 42,066 residents in 2025 and 56,000 in 2026. What attracts people to Las Vegas? Jobs. Over $30 billion in construction is currently underway, creating thousands of new jobs beyond those already available. The last major job fair advertised over 20,000 open positions.
Future Rent and Price Growth
Rents cannot increase unless personal incomes are rising. Below is a chart showing personal income growth in Clark County (Las Vegas). This is a strong indicator that rents (and house prices) can (and will) continue to increase.
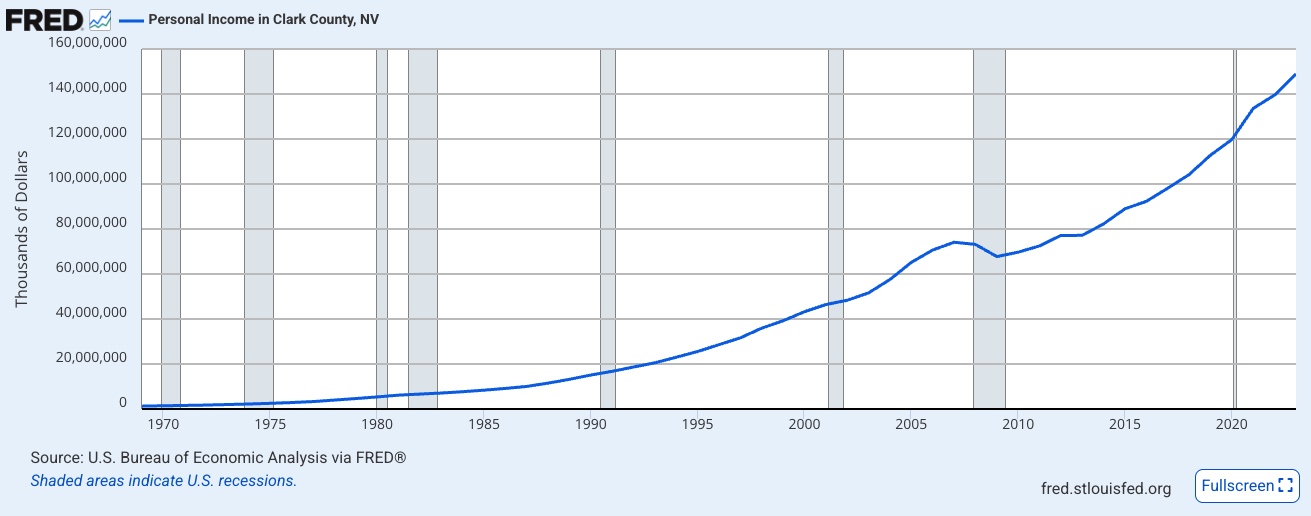
[Source]
In Conclusion
While nothing is guaranteed, the combination of population growth, jobs, and limited land for expansion virtually assures that prices and rents will continue to increase.
Thanks for reading my post.
- Eric Fernwood
- [email protected]
- 702-358-8884
