


- Real Estate Agent
- Nashville, TN
- 180
- Votes |
- 363
- Posts
Headlines Scream Crisis. Data Say Calm.
This week, we’re talkin’ ..... a lot!
A job market that looks strong-ish, a consumer that feels miserable but keeps spending, a multifamily rent picture that just turned positive, and the $875 billion commercial real estate maturity wall, that’s actually shrinking.
Also, Nashville keeps doing its whole growing and attracting new businesses thing.
The whole issue has one thread: the headlines scream crisis, the data says calm.
Let’s get into it.
----------
Today’s Interest Rate: 6.29%
(👇 .10% from this time last week, 30-yr mortgage. Fannie Mae now projects ~6.3% for Q2.)----------
The Weekly 3 in News:
- -March jobs report beats expectations, but not for the reasons you think. Nonfarm payrolls were UP big +178k (vs. 59k consensus), unemployment improved marginally to 4.3% — but mostly because people left the labor force entirely. Wage growth +3.5% is OK, but still outpacing inflation (BLS).
- -Bank CEOs flat-out disagree with the consumer sentiment polls. KeyCorp’s Chris Gorman called the consumer “in good shape” on CNBC Friday. JPM’s Dimon said the same. BofA’s Moynihan said spending is “solid” and credit quality is “stable” (CNBC).
- -Yardi Matrix: multifamily rents posted a monthly gain in March, a change in momentum— But Q1 growth was just 0.2%, the weakest March YoY since 2012, and the 2026 supply forecast just got revised up. Nevertheless with new supply continuing its fall, future rents are expected to start reaccelerating this year (Yardi).
Quickly: An Interest Rate Status Update
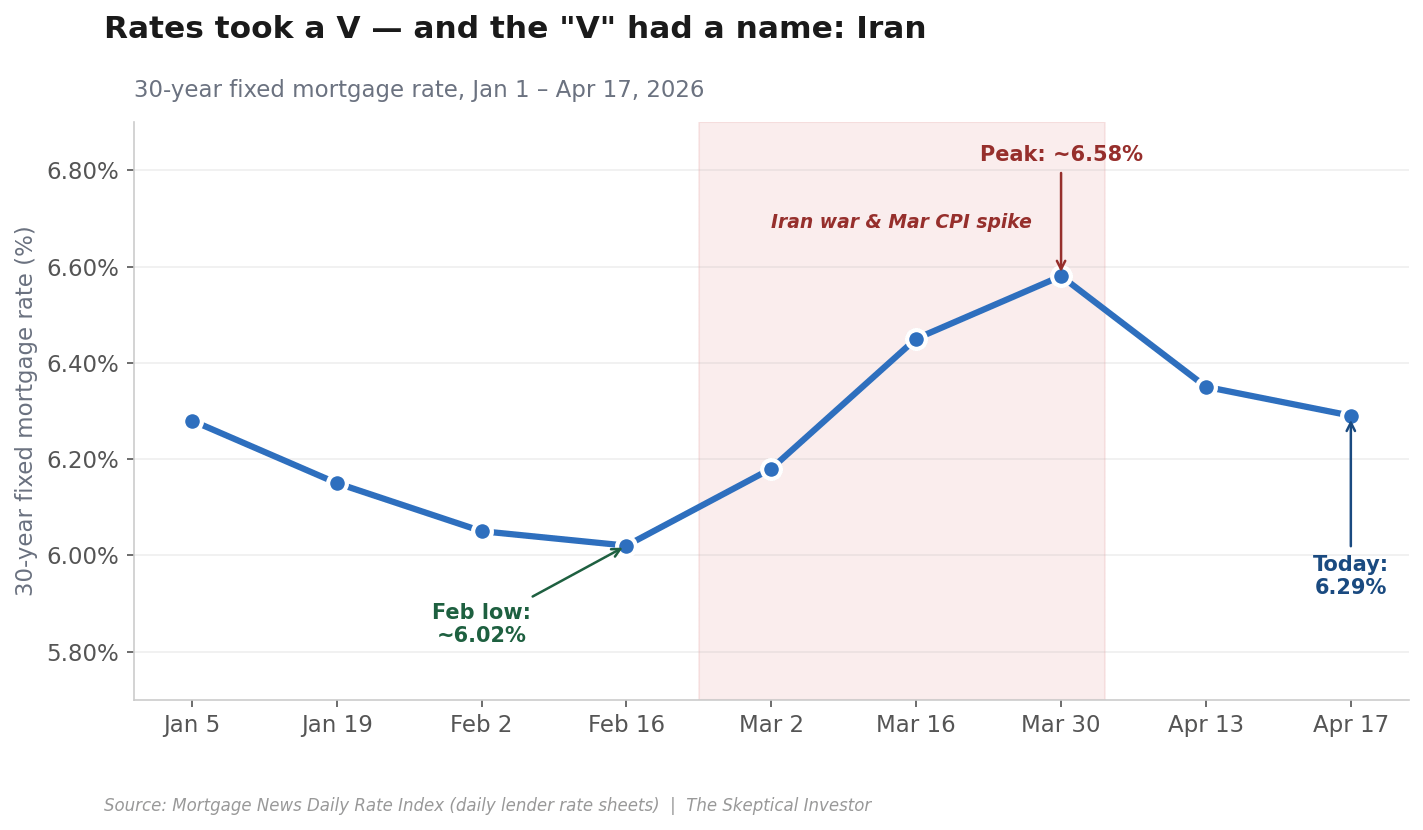
Rates are… well, almost back to where we started 2026. Down slightly. Volatile as hell in between.
The year started off right with the 30-yr mortgage rates continuing their decent to ~6.28% in early January to a low of around 6.00% in mid-February. Then the Iran war kicked off.
On Feb. 28, oil spiked, the March inflation CPI print came in at 3.3%, and rates ran right back up — peaking near 6.58% at end of March.
We’ve since pulled back to 6.29% as the ceasefire took hold and markets repriced lower inflation expectations.
Fannie Mae’s official forecast still calls for 6.3% by Q2 and 5.7% by year-end. But watch out. Directionally yes, I think rates drift lower into 2027, but anyone who lived through the last 60 days knows how quickly that can reverse.
The takeaway for investors: don’t wait for the “perfect rate window” that keeps moving. Just run your numbers and make sure you’re cash flowing. A hot take: rates at 6.29% today with a ceasefire holding is a better environment than crazy low interest rates and prices and inflation, well, inflating.
----------The Sentiment-vs-Data Disconnect
Before we get into our main topic, let’s set the table. Because this is the story of 2026 so far, and every topic this week flows through it.
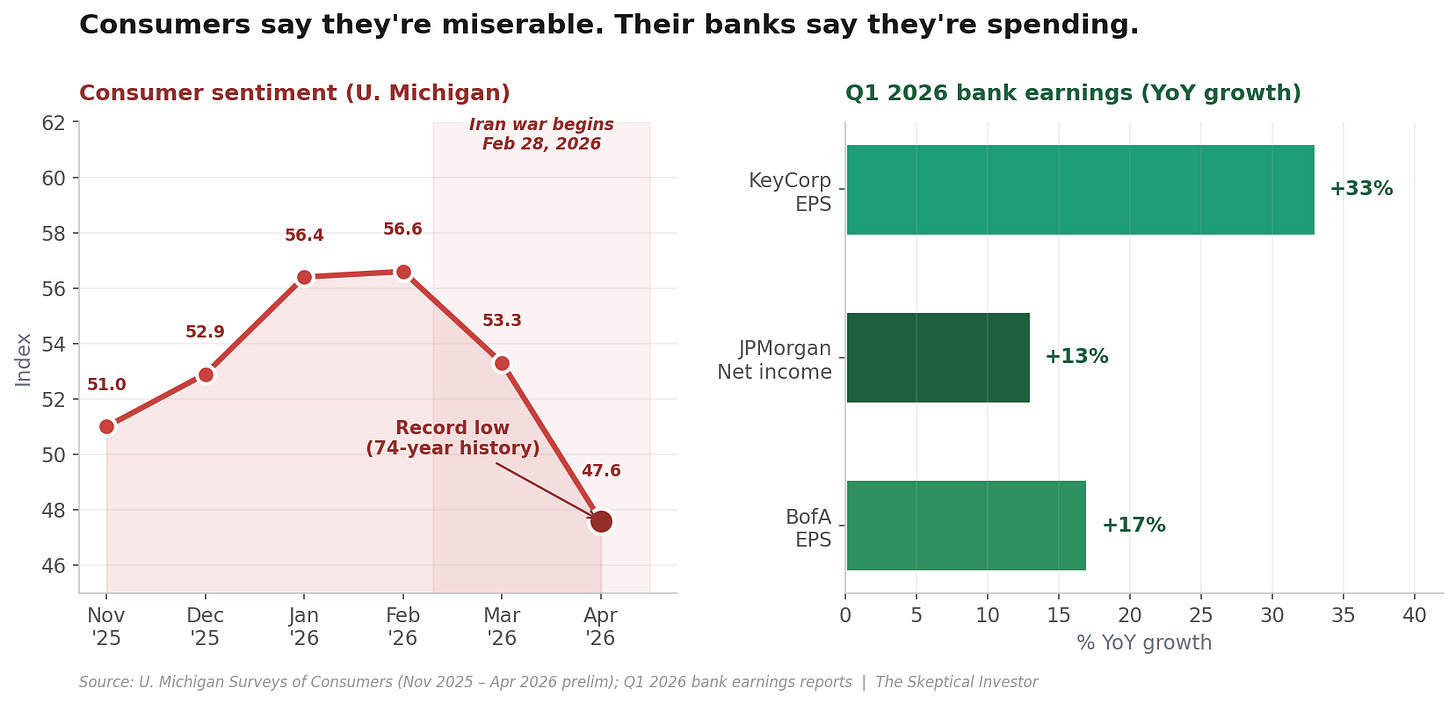
Consumer sentiment just hit a 74-year record low.
The preliminary April reading from the Univ. Michigan Surveys of Consumers came in at 47.6 — down 10.7% from March’s 53.3, and the lowest reading since the survey began in 1952.
Lower than the Great Recession.
Lower than COVID.
Lower than the 2022 inflation peak.
And look at the trajectory. Sentiment was actually climbing from November through February — 51.0 → 52.9 → 56.4 → 56.6. Then the Iran war began on February 28, and the floor dropped out.
And yet.
Bank CEOs — the guys sitting on live transaction data for millions of American consumers, in real time — just told us this week that none of that pessimism is showing up in actual spending or credit behavior.
One of these data sources is a phone survey asking people how they feel about the economy. The other is what those same people actually did with their credit cards and deposit accounts last quarter. I know which one I trust.
The other, politics.
People just feel pessimistic (and like to express this to phone surveyors) when decisions are being made in politics / policy that they don't agree with or are controversial.
Also, a big caveat in the survey data, U. Michigan’s own survey director Joanne Hsu flagged that 98% of the April interviews were completed before the April 7 ceasefire announcement. Which means that 47.6 reading captured the peak of war-driven panic — not where consumers are today.
The way the conflict settles will likely drive sentiment.
But then again, does that even matter?
I'm labeling this negative sentiment more noise than signal.
Let’s look at some hard labor market data next.
----------
Jobs: Strong on the Surface, Soft Underneath
March nonfarm payrolls came in at +178,000, blowing past the 59k consensus. The unemployment rate “edged lower” to 4.3%.
Sounds great.
Count me skeptical.
Here’s what the headlines aren’t telling you:
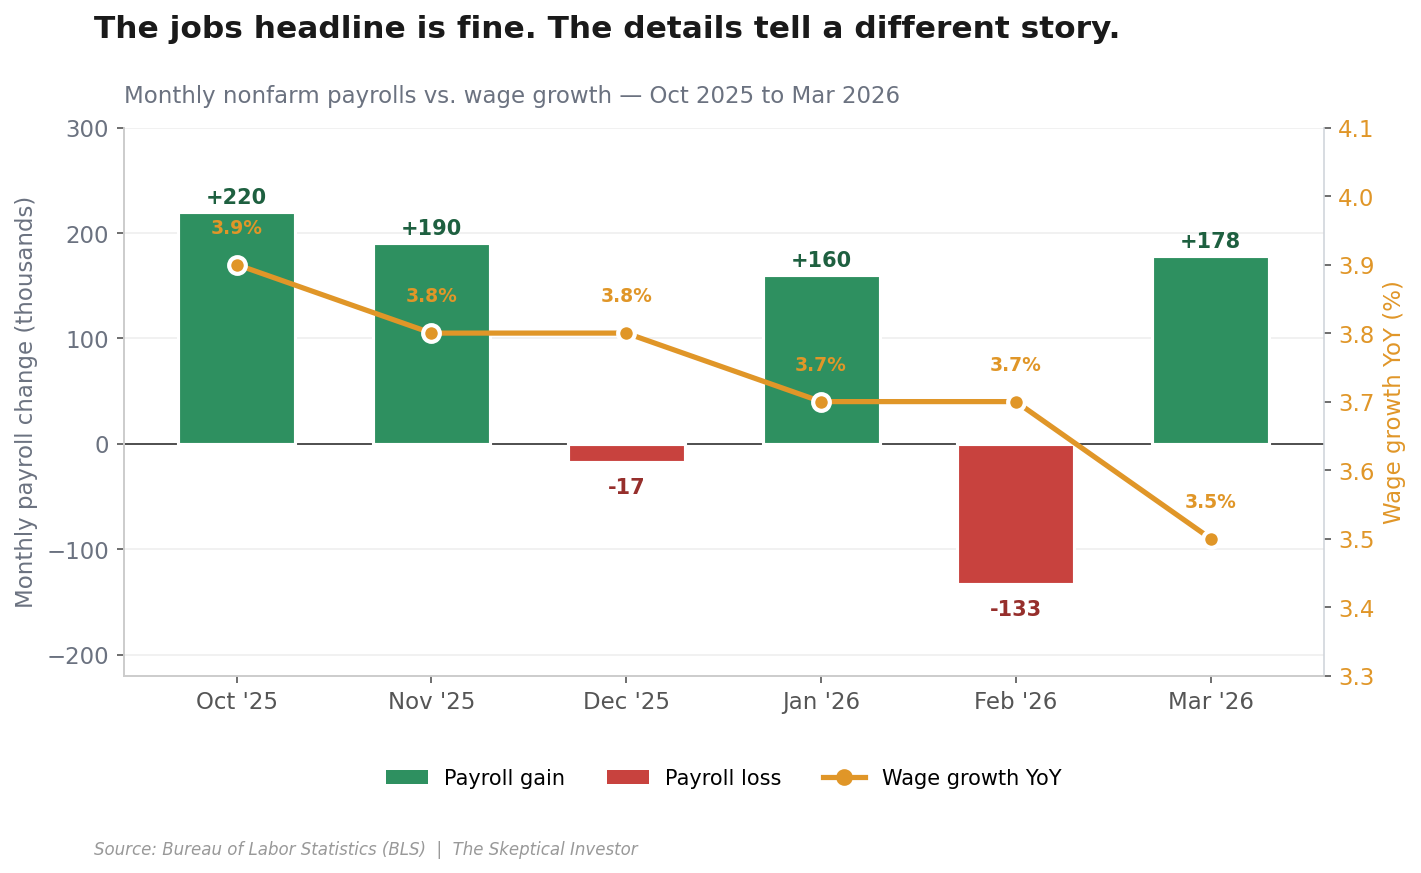
Look at that chart. Three things jump out:
- February was a -133k decline (revised from -92k). March didn’t grow the labor market — it dug out of a hole.
- The unemployment “improvement” came from a shrinking labor force, not a hiring surge.
- Average hourly earnings grew just 0.2% MoM and +3.5% YoY — the lowest annual print since May 2021.
And what I couldn’t fit on the chart:
- Long-term unemployed up 322k over the year to 1.8 million.
- Discouraged workers up 144k in March alone to 510k.
- U-6 underemployment edged up to 8%.
- Gains were concentrated in health care (+76k). Federal government employment keeps declining.
Narrow leadership. Thinning participation. Cooling wages.
Consumer: Feels Terrible, Spends Anyway
And yet — and this is the whole point — the actual consumer data is just fine.
Again, from the bank Q1 earnings calls this week:
- JPMorgan (Dimon): Consumer spending growth in Q1 was faster than the same period a year ago, fueled by employment and wages. JPM reduced its loan loss reserves. Dimon’s shareholder letter: “The US economy remained resilient… consumers still earning and spending and businesses still healthy.”
- Bank of America (Moynihan): EPS of $1.11, highest in nearly two decades. Consumer banking net income up 21%. Consumer loan balances up 4%. Quote: “Consumer spending remained solid and credit quality stayed stable.”
- KeyCorp (Gorman) on CNBC this Friday: Consumer is in “good shape.”EPS up 33% YoY. Record investment banking fees.
Three different banks. Same message.
True, JPM also reported steady increases in revolving credit card balances — so yes, some of that spending is going on credit. And Dimon, as he always does, warned about an “increasingly complex set of risks.” (Jamie Dimon warning about complex risks is like the sun rising in the east, he likes to cry wolf.)
But the direction of the data from the people who watch consumer money move is clear.
Credit quality is holding.
Spending is up.
Loans are getting paid back.
The U. Michigan sentiment survey says we’re living through the worst economy in 74 years. The banks say we’re spending more than last year.
Why this matters
Hang onto this idea, because it comes through in the state of multifamily real estate.
Which happends to be our next topic de jour.
----------
The Housing Supply Cliff Meets the Maturity Wall
Is the consumer healthy enough to keep paying rent, filling apartments, and absorbing the supply wave?
The answer, based on what the banks just told us, is yes.
But the “but” is big. And that’s where we’re headed next.
This is the story that matters most for 2026 and into 2027. And almost nobody is connecting the two dots.
#1: The Multifamily Supply Cliff is Here.
Yardi Matrix (a leading commercial real estate market intelligence and data platform) just dropped its Q1 report on April 8th, and the results are seem to confirm what we’ve been saying for months…
The supply wave of new apartments has crested, and is falling.
But, Yardi’s April 8 report has two competing narratives I found interesting:
The bullish headline: Multifamily rents rose in March — the first monthly gain since last summer. Broadly distributed across markets.
My skeptical reading:
- Q1 rent growth totaled just $4 per month, or 0.2%.
- That’s “less than normal for a year’s first quarter.”
- It’s the weakest March YoY growth since 2012.
- Average advertised rent: $1,741.
Here’s where the market is actually breaking down — and this is the critical chart for understanding 2026:
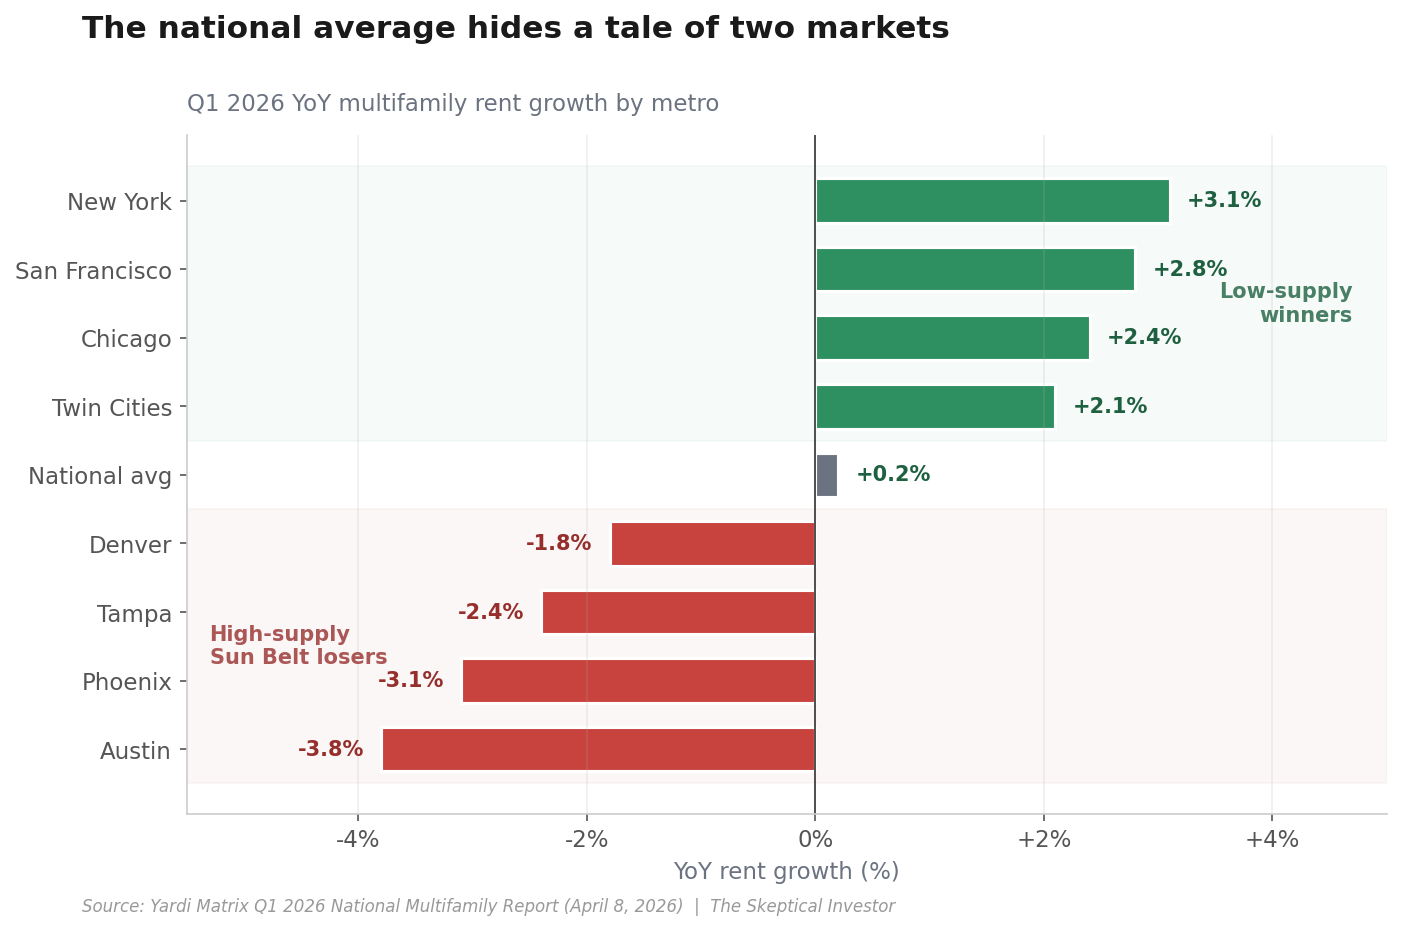
The low-supply coastal/Midwest markets are carrying the entire national number. Every market on the “winners” list built almost nothing during the 2020-2023 ZERP-era boom. Every market on the “losers” list built way too much.
If you build lots of housing, rents don’t inflate.
If you don’t build, rents go up.
It’s not complicated. And it’s exactly what I’ve been saying for the last six months.
But Here’s The Twist
Yardi just revised its completions forecast UP for 2026, 2027, and 2028:
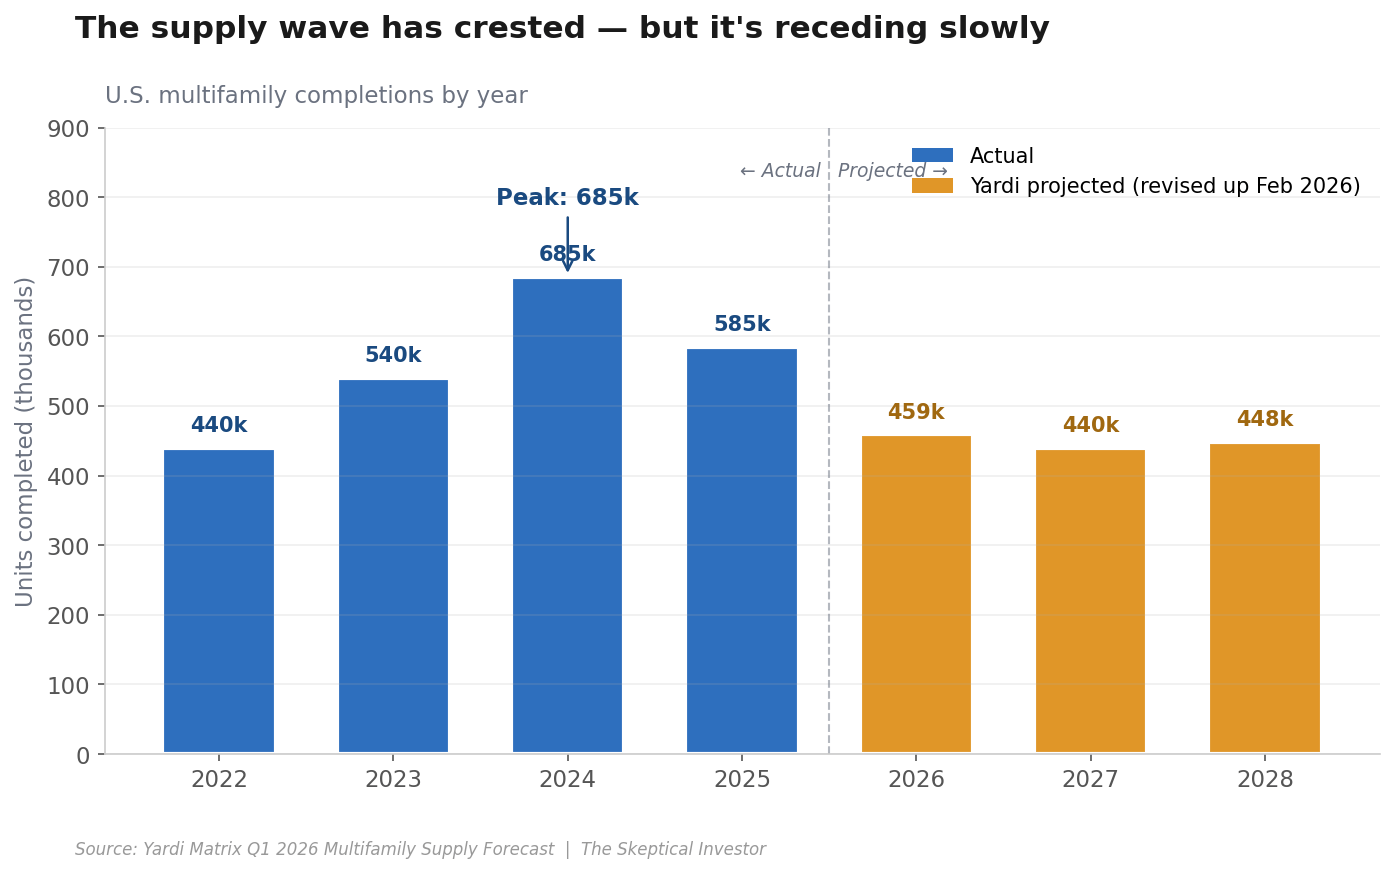
More than 1.3 million units coming over the next three years. The supply wave peaked in 2024 at 685k completions. We’re coming off that peak, but we’re coming off it slowly.
The context matters: market-rate new supply in 2028 is still expected to be 31% lower than 2025’s peak. So supply IS moderating. Just not as fast as everyone hoped.
What that means for your rental income:
- Sun Belt operators: Another 12-18 months of pain before absorption catches up.
- Coastal/Midwest operators: Rent growth is already happening and will accelerate.
- Nashville (my home market): Sun Belt — but benefiting from the HQ migration story (more on that in a minute), which should clear the additional supply faster than Austin or Phoenix.
#2: The Debt Maturity Wall Is Cresting
$875 billion in commercial real estate debt matures in 2026 per the Mortgage Bankers Association — a 9% decreasefrom 2025’s peak of $957 billion.
The maturity wall is actually shrinking.
Almost nobody is reporting it that way.
Now the part that doesn’t get talked about enough — because most folks get this story wrong.
You’ve probably seen the spoooooky headlines:
“$1.5 trillion CRE debt wall!”
“Trillions in maturities coming due!” etc.
The numbers vary because they combine multiple years, but the implication is always the same: the sky is about to fall.
It’s not.
The Mortgage Bankers Association just released its 2025 Commercial Real Estate Survey of Loan Maturity Volumes (February 2026), and the data tells a completely different story:
What the MBA data actually shows:
- 2024: $929 billion matured.
- 2025: $957 billion matured — the peak.
- 2026: $875 billion scheduled to mature — a 9% decrease from 2025.
- 2027 (projected): $652 billion — another 25% drop.
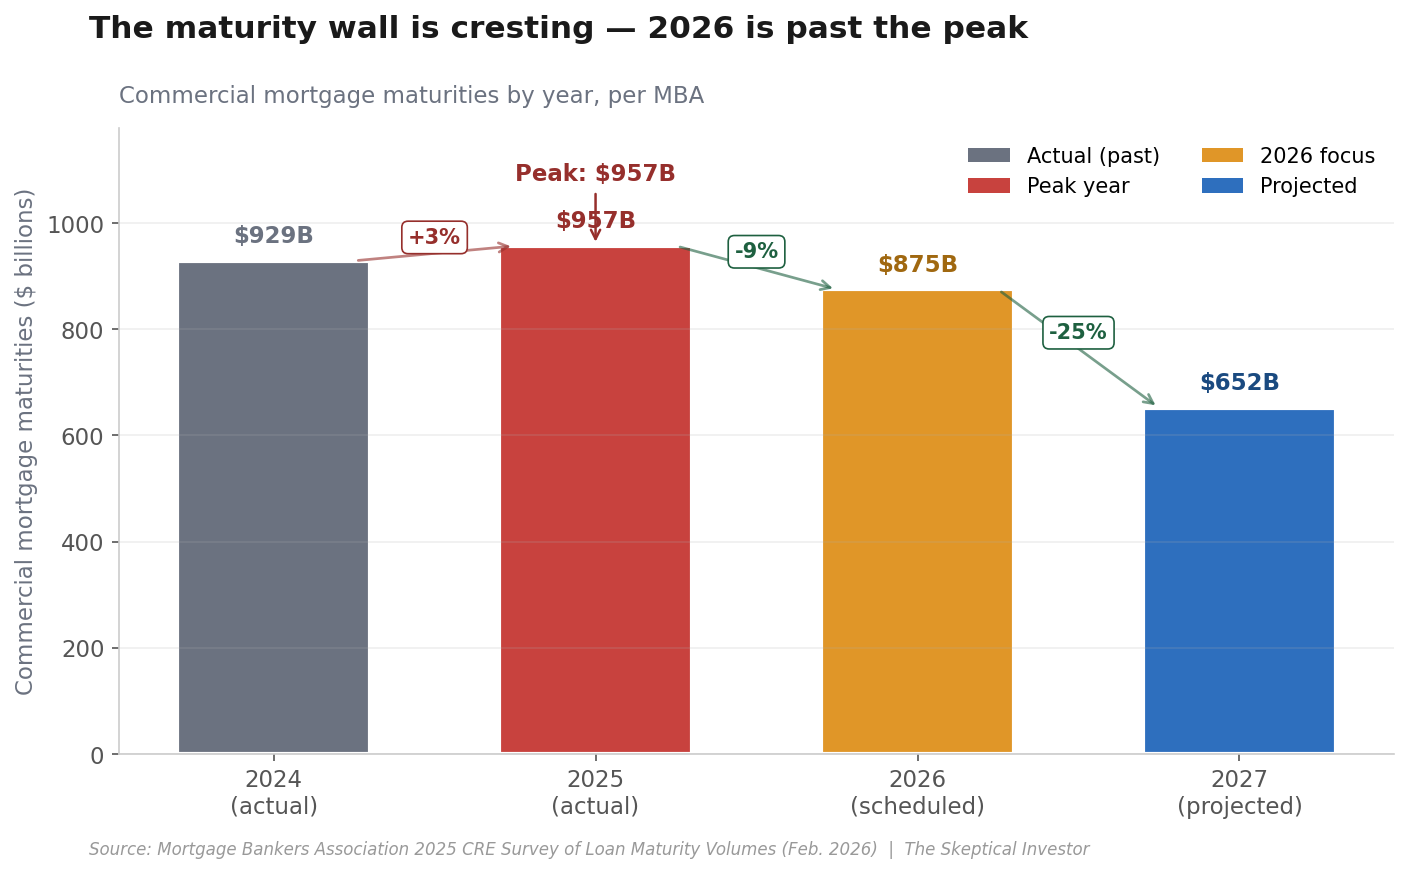
The wall isn’t approaching. We’re past the peak. Most of the loans that were going to be a problem have already rolled through, been extended, or been refinanced. 2026 maturities are actually lower than 2025’s.
This is a huge deal and it doesn’t get reported this way because “maturity wall shrinking” doesn’t sell ad clicks the same way “looming $1.5T crisis” does.
Where the real risk still lives — by lender type:
Of the $875B maturing in 2026, MBA breaks it down by who holds the paper:
- Depositories (banks): $396B (21% of their CRE portfolio)
- CMBS / CLOs / ABS: $200B (25% of their portfolio — highest concentration)
- Credit companies, warehouse lenders, other: $163B (29% — highest percentage)
- Life insurance companies: $76B (10%)
- GSEs (Fannie, Freddie, FHA, Ginnie): just $39B (4%)
The concentration matters more than the total. GSE-backed multifamily paper — which is most of the conforming apartment debt in America — is barely affected. That's why you should basically ignore the "CRE debt apocalypse" narrative if you invest in stabilized multifamily. The 2026 risk is concentrated in CMBS and non-bank lenders, which tend to finance office, older retail, and transitional properties.
Where the risk still lives — by property type:
From MBA’s prior-year vintage data, the highest maturity shares by property type were:
- Hotel / motel: 35%
- Office: 24%
- Industrial: 22%
- Retail / healthcare: 18%
- Multifamily: 14%
So yes, office has a concentration problem. Hotels too (though that sector is actually fine from a cash flow standpoint — occupancy is strong). Multifamily’s 14% share is the lowest of the major property types.
Translation: the market can refinance its way through this. Values are stabilizing. MBA forecasts commercial mortgage originations will actually jump 27% in 2026 to $805 billion — meaning plenty of capital is ready to replace the maturing loans. The pipeline works.
The Big Picture: What Happens Next
Here’s the thing that keeps me optimistic.
This isn’t 2008.
Ignore all the doomers on Twitter and Facebook and TikTok.
In 2008, the problem was credit quality — borrowers couldn’t pay. In 2026, the problem is duration and valuation — borrowers CAN pay, the loan just matures into a worse refinancing environment.
Two very different problems. The second one gets solved by time, patience, and some pain.
What we’re going to see over the next 18 months:
- -Distressed sales and opportunistic buying. Institutional money is sitting on capital waiting. J.P. Morgan's head of CRE already said 2026 will see "more transactions" across the board.
- -Loan extensions and workouts. Banks would rather extend than foreclose, especially in multifamily where the underlying property is performing.
- -Equity getting wiped out on overleveraged deals — especially in Sun Belt multifamily syndications from the 2021-2022 vintage. You’re going to read a lot of grim LP stories this year.
- -The winners emerging with great assets at reset bases — smart, patient capital getting into properties at 2015-2017 pricing.
The affordable housing story here is also underrated. Yardi noted 2028 market-rate supply will be 31% below 2025, while affordable housing supply stays close to 2025 levels. That’s a policy win (mostly via LIHTC) that doesn’t get enough attention.
---------- Let me tie this all together.The bearish read: jobs cooling → wage growth decelerating → apartment absorption slow → rent growth anemic → CRE values under pressure → $875B of maturing debt still needs to refinance into higher rates.
The bullish read: banks say consumer credit is fine → spending is up → supply is finally moderating → coastal/Midwest rents already recovering → maturity wall is shrinking year-over-year, not growing → MBA forecasts CRE originations jumping 27% in 2026 → institutional capital sitting on dry powder → this is a workout cycle, not a crisis.
Both stories are true. The first one is the loud one. The second one is the accurate one for most real estate investors — IF you avoid the trap sectors (Sun Belt overbuilt multifamily, older office, over-leveraged 2021-2022 vintage) and own assets in places where supply can’t catch up with demand.
Like, say, Nashville — where people keep moving regardless of whatever CNBC is panicking about that week.
Speaking of which…
----------
🏙️ Nashville Corner
Nashville is still winning the HQ relocation war.
CBRE dropped its 2026 HQ Relocation Update last week, and the data is as clean as ever:
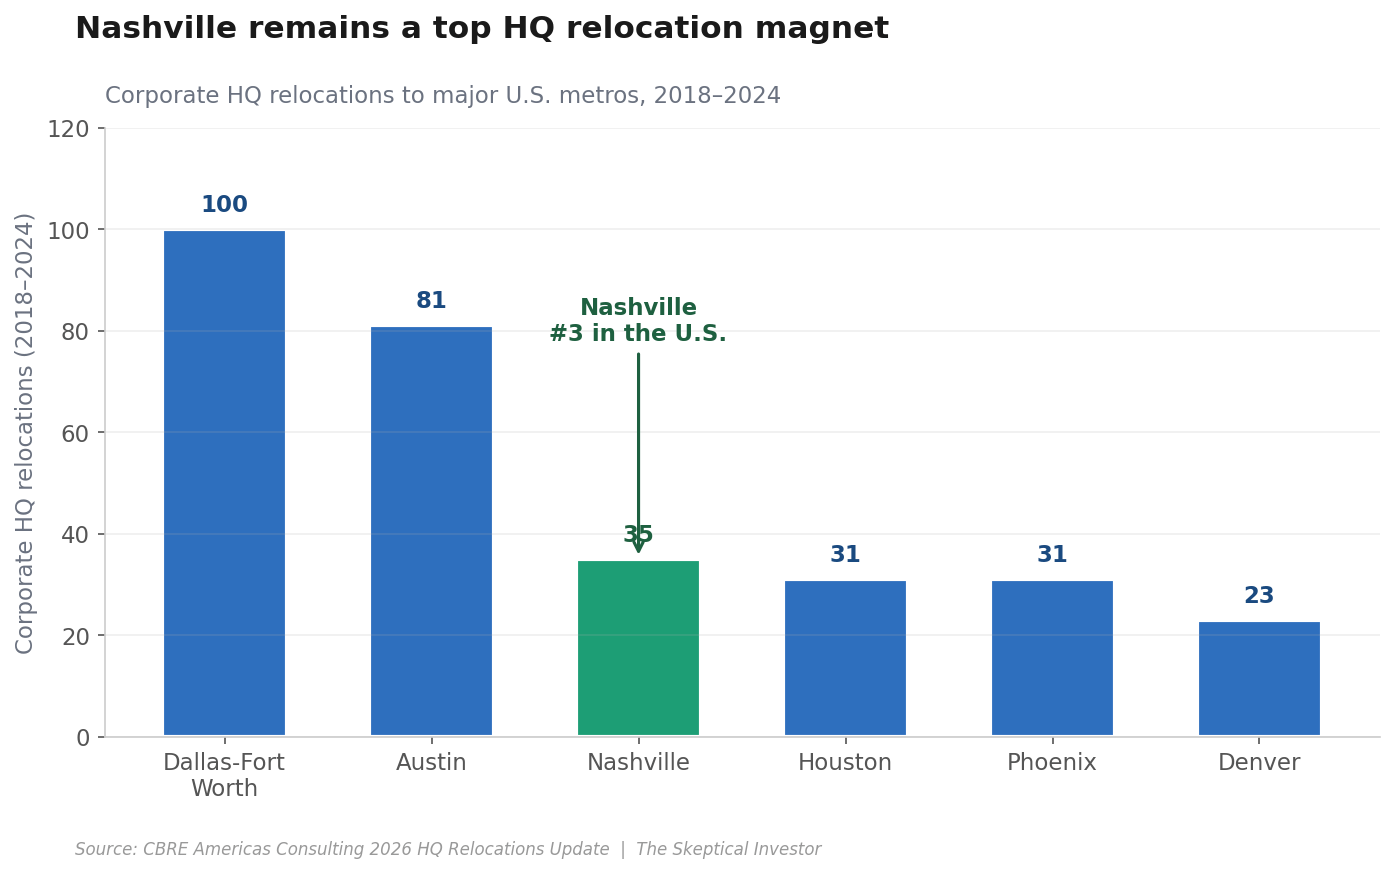
Nashville has pulled in 35 corporate HQ relocations from 2018-2024, trailing only Dallas-Fort Worth and Austin. Activity picked up in 2025 vs. 2024, as companies flee LA, SF Bay Area, NYC, and Chicago for lower taxes, better labor markets, and — let’s be honest — a better quality of life.
CBRE specifically calls out Charlotte, Miami, Nashville, and Phoenix as the “rising contenders” to the Texas metros.
The drivers:
- Pro-business tax environment.
- Growing, diverse talent pool.
- Supportive infrastructure.
- No state income tax (let’s not pretend that doesn’t matter).
Oracle’s $1.35B East Bank campus (demolition started February 2026, opens ~2030) remains the marquee example, but it’s not alone. It’s a feature of a much bigger pattern.
The tie-in: Remember the Yardi Sun Belt rent picture — Austin down, Tampa down, Phoenix down? Nashville is Sun Belt geographically, but the HQ inflow provides ongoing wage and demand support that the Phoenix/Tampa markets don’t have. It’s why I’ve been saying Nashville’s supply glut clears faster than its Sun Belt peers.
HQ moves = high-wage jobs = homebuyers and renters = rent and value support.
This is the demand engine underwriting our market. It’s not going away.
----------
My Skeptical Take
Here’s the thing about being a skeptical investor.
Skepticism usually means pushing back on bullish narratives. Questioning the consensus. “Count me skeptical” is usually followed by “about this happy data.”
This week, my script flipped.
This week, the skeptical take is siding with the banks.
The headlines — consumer sentiment at record lows, inflation back to 3.3%, oil at $100, war in the Middle East, “complex risks” — all of that is the loud, emotional, narrative-driven noise. That’s the sentiment layer.
The signal layer — the actual transaction data from JPM, BofA, and KeyCorp, plus the labor market data (cooling but not collapsing), plus the Yardi rent data (softer than great, but positive and stabilizing) — tells a completely different story.
Consumer sentiment polls are weak economic indicators. Usually more noise than signal.
Dimon warning about “complex risks” while JPM’s own data shows the consumer stronger than a year ago? That’s Jamie Dimon being Jamie Dimon. (You should always read his shareholder letter for what it is: risk management theater from a guy who knows exactly how to hedge his reputation.)
The banks’ spreadsheets — not his anxiety — are what tell you where the economy actually is.
And the spreadsheets say: the consumer is fine, multifamily is troughing, the CRE maturity wall is actually shrinkingyear-over-year, and the places with real demand drivers (like Nashville) are the places to keep underwriting.
Stay skeptical of the narrative. Trust the data.
And in a contrarian little twist — this week, the data is the good news.
Until next time. Stay Curious. Stay Skeptical.
Herzliche Grüße,
-The Skeptical Investor
- Andreas Mueller

Most Popular Reply

Come on, you're such a pessimist. Next thing you're going to say is that people don't usually type 2000 words in English and then sign off using German words like Herzliche Grüße.
Beste Wünsche,
Greg