
July Las Vegas Rental Market Update
It's July, and time for another Las Vegas update. For a more comprehensive look at the Las Vegas investment market, please DM me for a link to our blog. There, you'll find detailed information on investing, both in general and specifically in Las Vegas.
Before I continue, note that unless otherwise stated, the charts only include properties that match the following profile.
- Type: Single-family
- Configuration: 1,100 SF to 2,400 SF, 3+ bedrooms, 2+ baths, 2+ garages, minimum lot size is 3,000 SF.
- Price range: $320,000 to $475,000
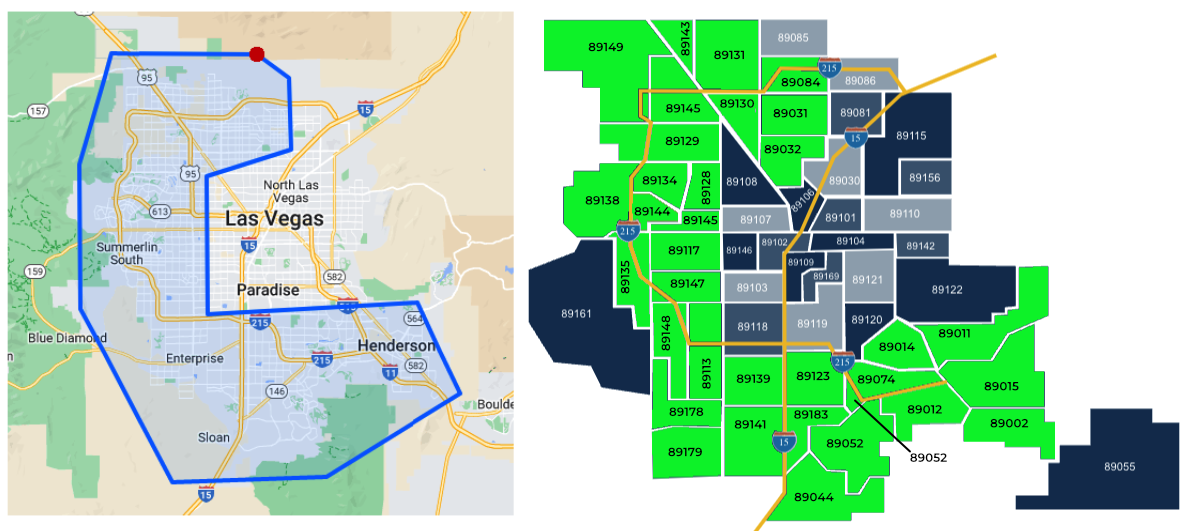
- Location: All zip codes marked in green below have one or more of our client’s investment properties.
What we are seeing:
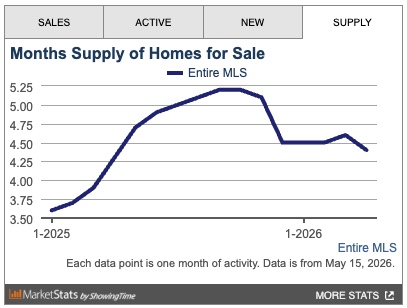
The chart below, from the MLS, includes ALL property types and price ranges. The overall inventory is trending down.
Rental Market Trends
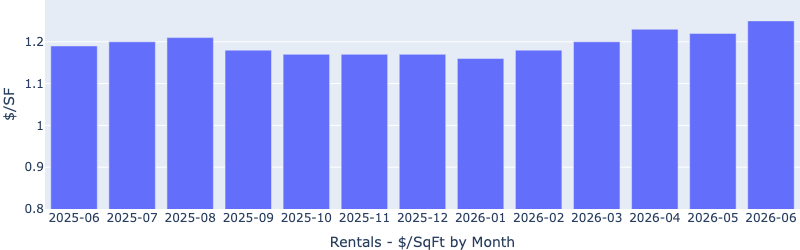
Rentals - Median $/SF by Month
Rent per square foot resumed growth MoM. YoY is up 4%.
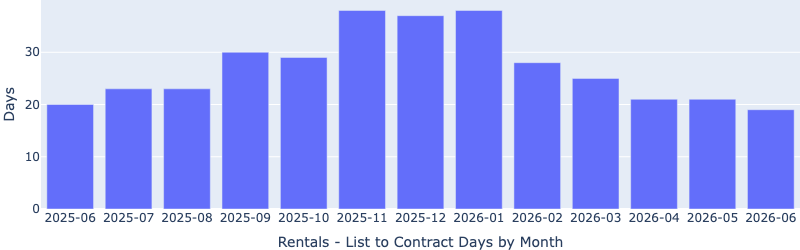
Rentals - Median Time to Rent
Despite rising rent, median days to rent decreased MoM, now below 20 days. This shows continued growth in rental demand.
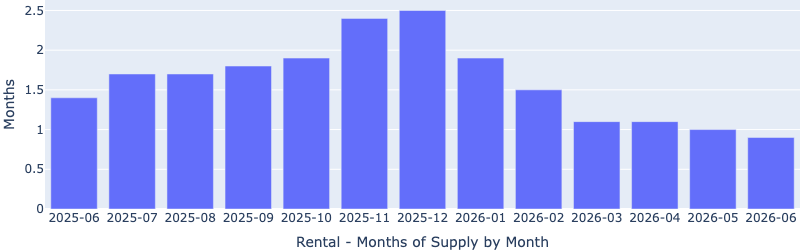
Rentals - Months of Supply
Inventory had another slight decrease MoM, now at only 0.9 months (less than a 30-day supply), the lowest in the last 13 months, and down 30% YoY! This indicates a strong landlord’s market, and rents continue to face upward pressure.
Sales Market Trends
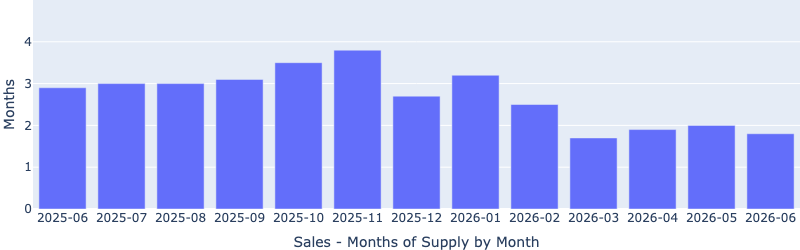
Sales - Months of Supply
Inventory decreased MoM to about 1.8 months. YoY is down 38%! The number of homes for sale continues to decrease MoM (fewer sellers), while the number of transactions increased MoM (more buyers), thereby reducing inventory.
However, a balanced market is about 6 months of supply, where prices can be expected to remain stable. A 1.8 months of supply is firmly in the seller’s market, and puts upward pressure on prices. It also signals strong buyer demand.
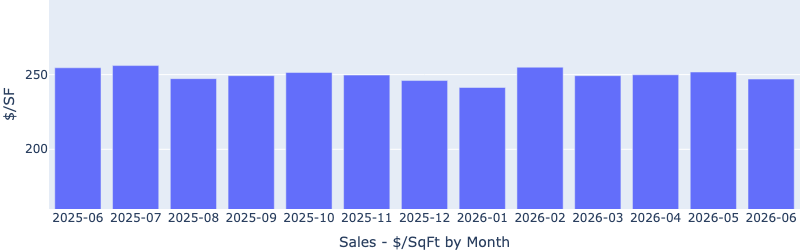
Sales - Median $/SF by Month
Median price per square foot dropped slightly MoM and continued to defy the usual seasonal trend (which usually increases during the spring/summer sale season). YoY is down ~2%. One explanation is the persistently elevated mortgage rates.
Why invest in Las Vegas?
The goal is to achieve and maintain financial freedom. Financial freedom goes beyond simply replacing your current income—it's about sustaining your lifestyle for life. To accomplish this, you need an income that outpaces inflation. Otherwise, you won't have the additional funds necessary to cover the rising costs of goods and services.
What causes rents (and prices) to increase?
Supply & Demand
Unlike financial markets, real estate prices and rents are driven by supply and demand. What is the supply and demand situation in Las Vegas?
Supply
Las Vegas is unique because it is a tiny island of privately owned land in an ocean of federal land. See the 2022 aerial view below.
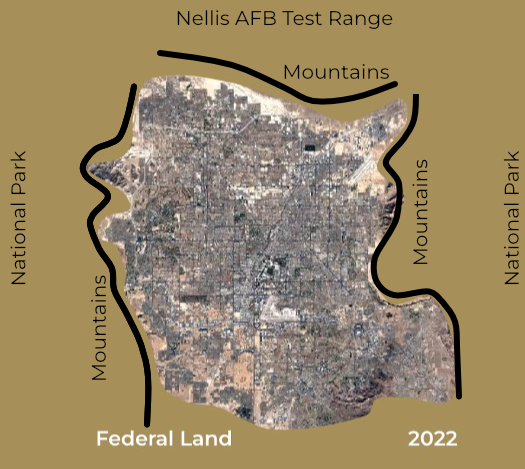
Very little undeveloped private land is left in the Las Vegas Valley, and desirable areas cost more than $1 million per acre. Consequently, new homes in these locations start at $550,000. Homes that appeal to our target tenant segment range from $350,000 to $475,000, so the supply of housing we target remains almost the same regardless of how many new homes are built.
Demand
Population growth drives housing demand and price increases and rent increases. Las Vegas's average annual population increases by 40,000 to 50,000. What attracts people to Las Vegas? Jobs. Ongoing construction projects valued between $26 billion and $30 billion fuel employment opportunities. The most recent job fair featured over 20,000 open positions.
In Conclusion
While nothing is guaranteed, the combination of population growth and limited land for expansion virtually assures that prices and rents will continue to increase.
Thanks for reading my post. Reach out if you have questions or would like to discuss investing in Las Vegas.
- Eric Fernwood
- [email protected]
- 702-358-8884
