$695,900
Investment Summary
- Monthly Cash Flow
- $1,167
- Cap Rate
- 8.2%
- Cash-on-Cash Return
- 8.7%
- Debt Coverage Ratio
- 1.33
- Internal Rate of Return (5 years)
- 12.5%
Cash Flow
Net Operating Income (NOI) minus mortgage payments.
Calculation:
NOI - Mortgage Payments
Cap Rate (Market Value)
Capitalization Rate is a rate of return that compares the yearly Net Operating Income (NOI) to the market value.
Calculation:
NOI / Market Value
Cash-on-Cash Return (CoC)
Annual Cash Flow / Cash Invested
Calculation:
Annual cash flow divided by initial cash invested.
Debt Coverage Ratio (DCR)
Net Operating Income (NOI) divided by total debt payments.
Calculation:
NOI / Total Debt Payments
Internal Rate of Return (IRR)
A metric for assessing profitability over time. IRR is the discount rate at which the net present value (NPV) of all future cash flows (positive and negative) from an investment equals zero — including both periodic cash flow (such as rent) and a projected sale at the end of the holding period. It represents the expected annualized return, accounting for income, expenses, and the recovery of capital through a future sale.
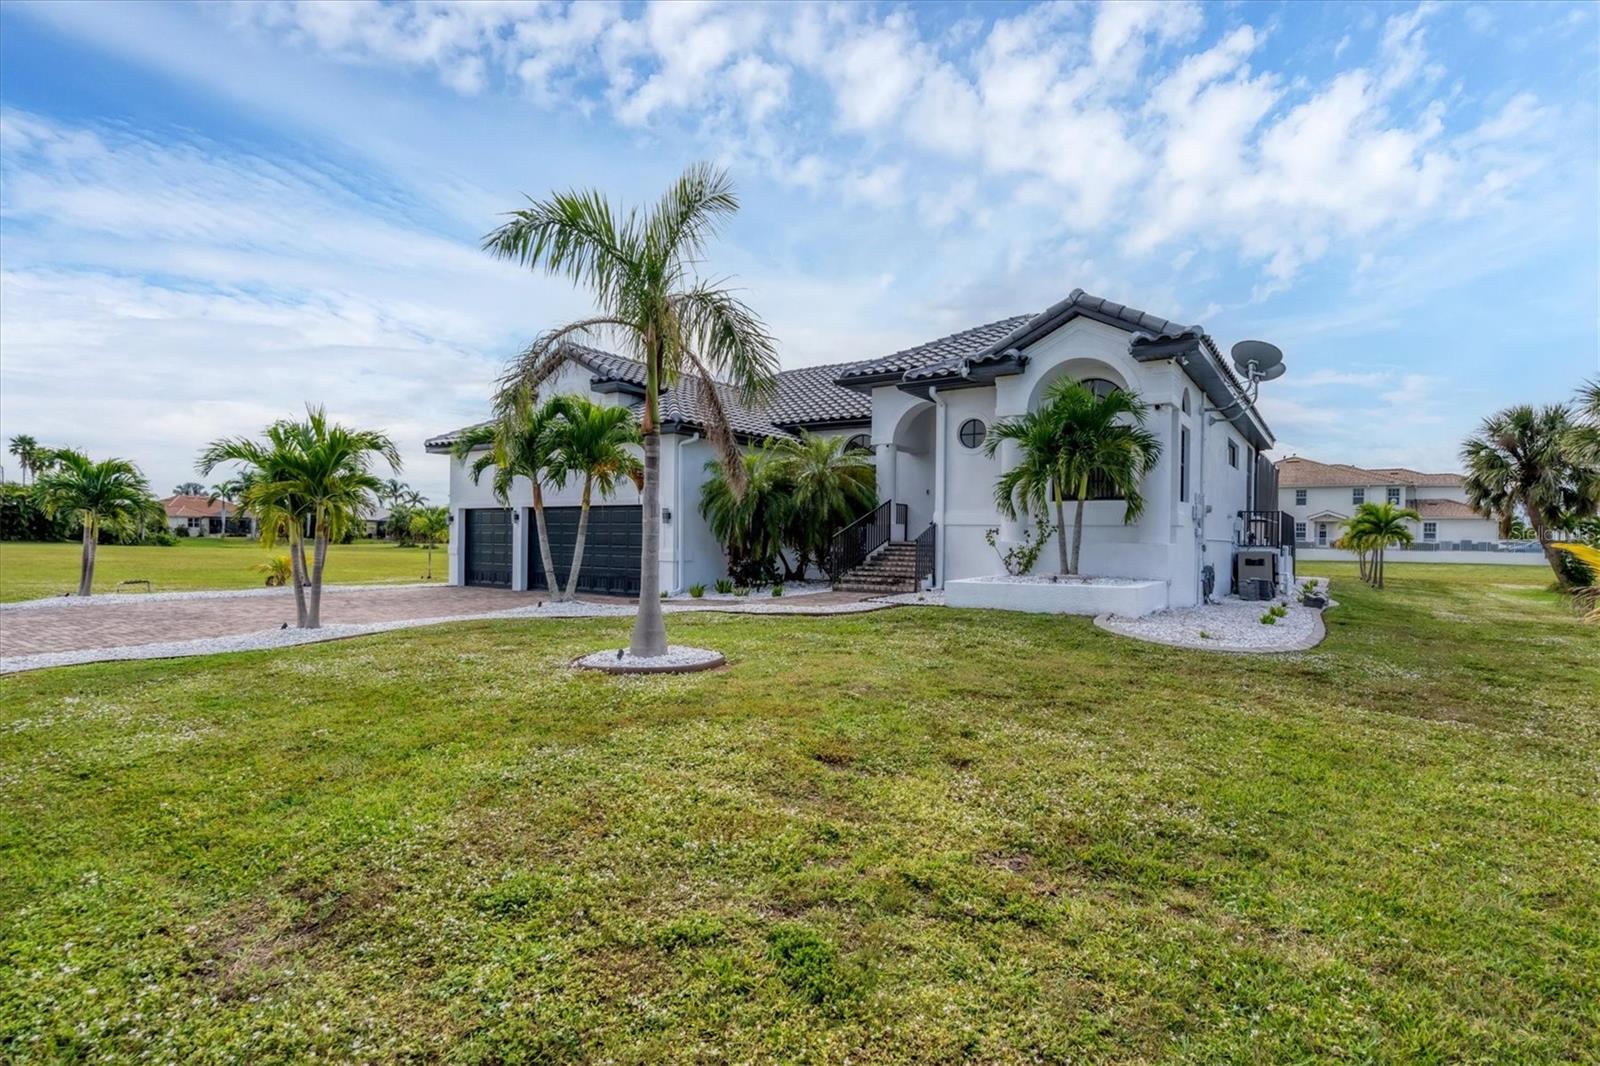
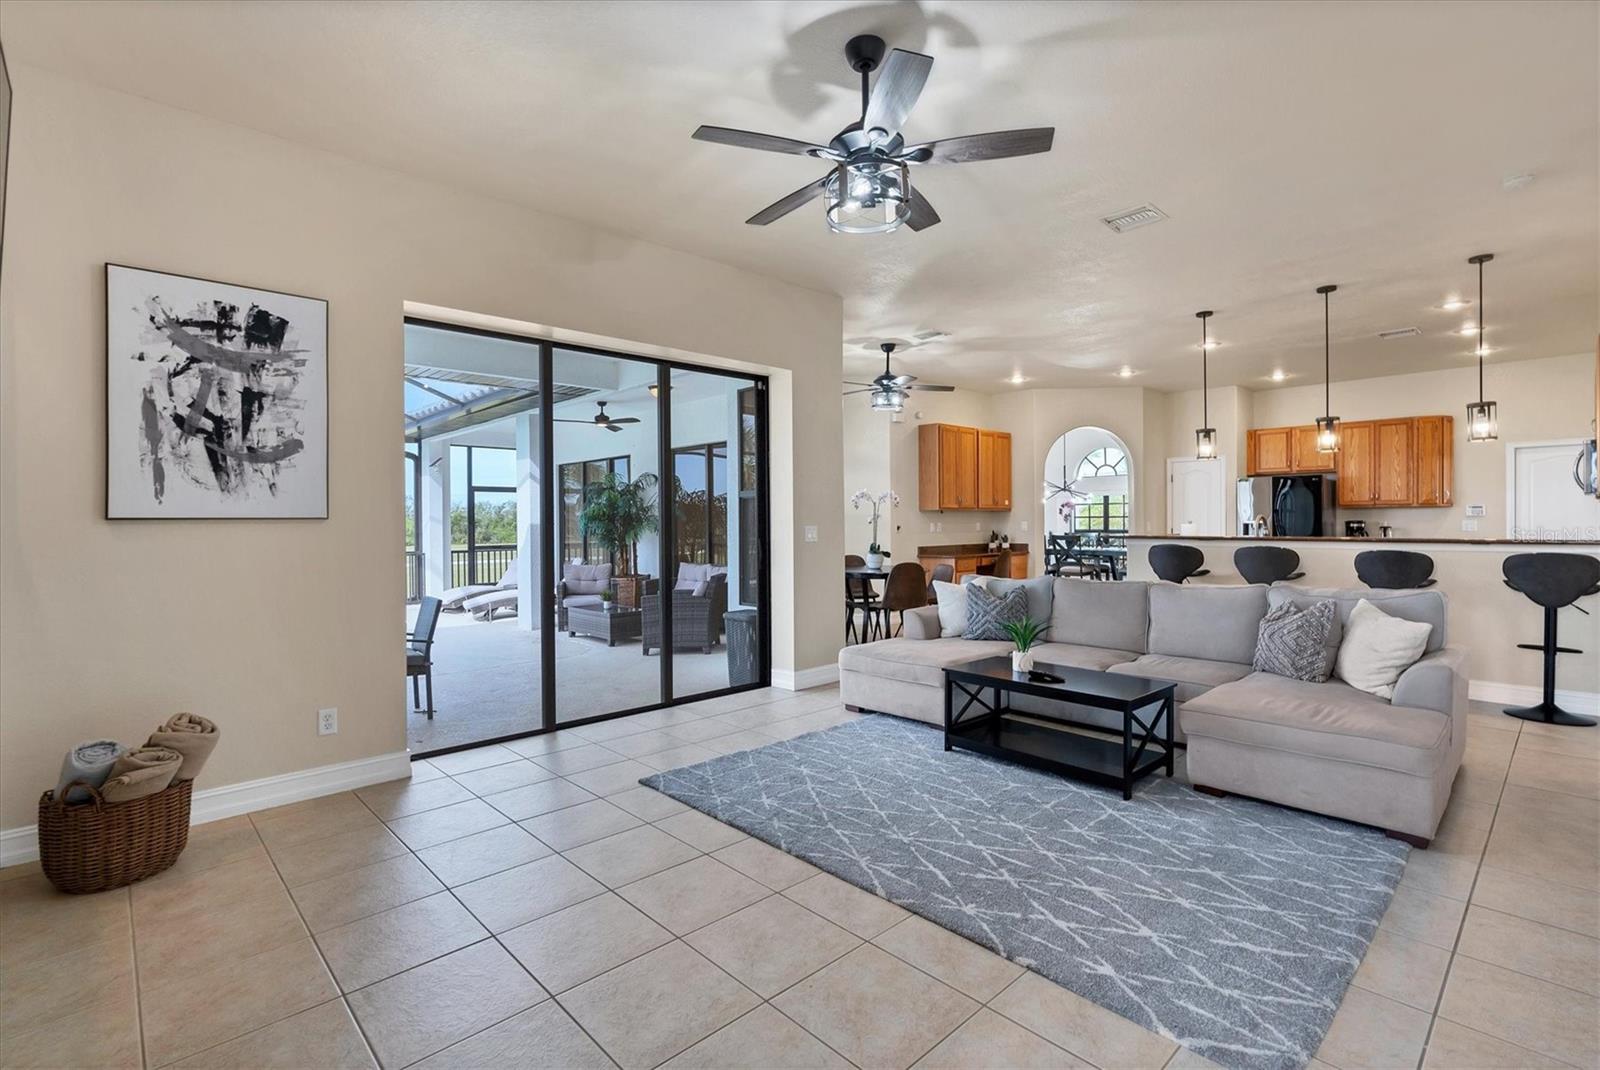
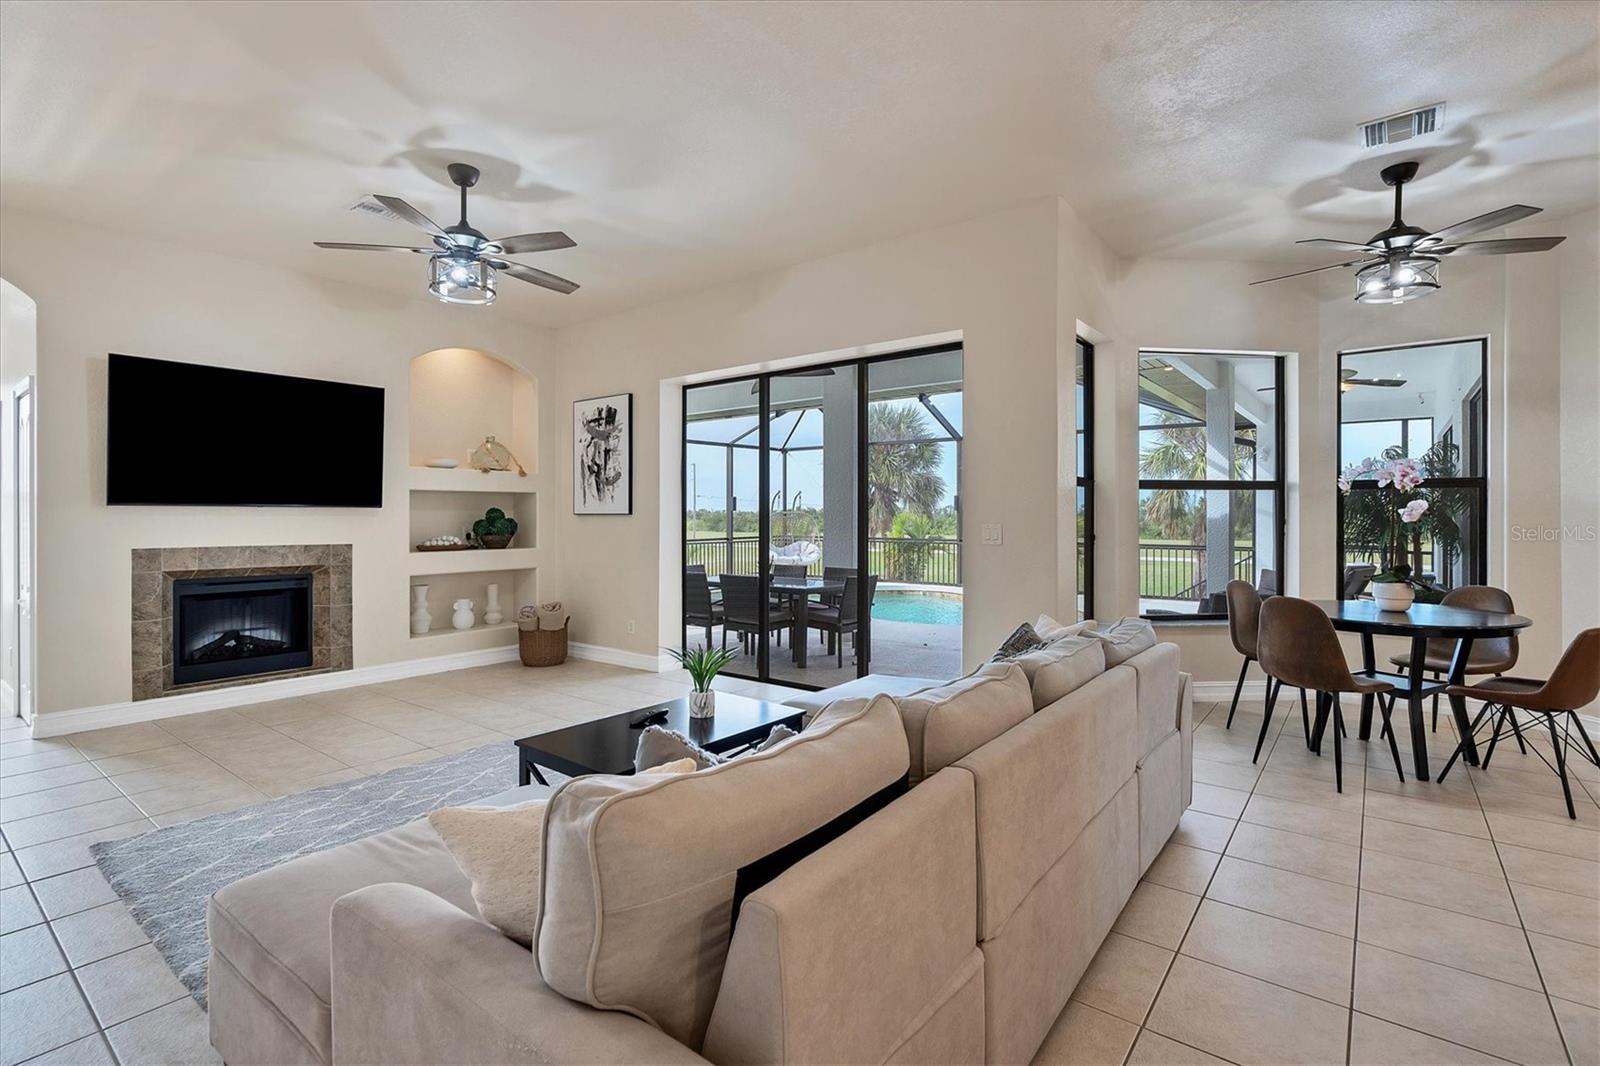
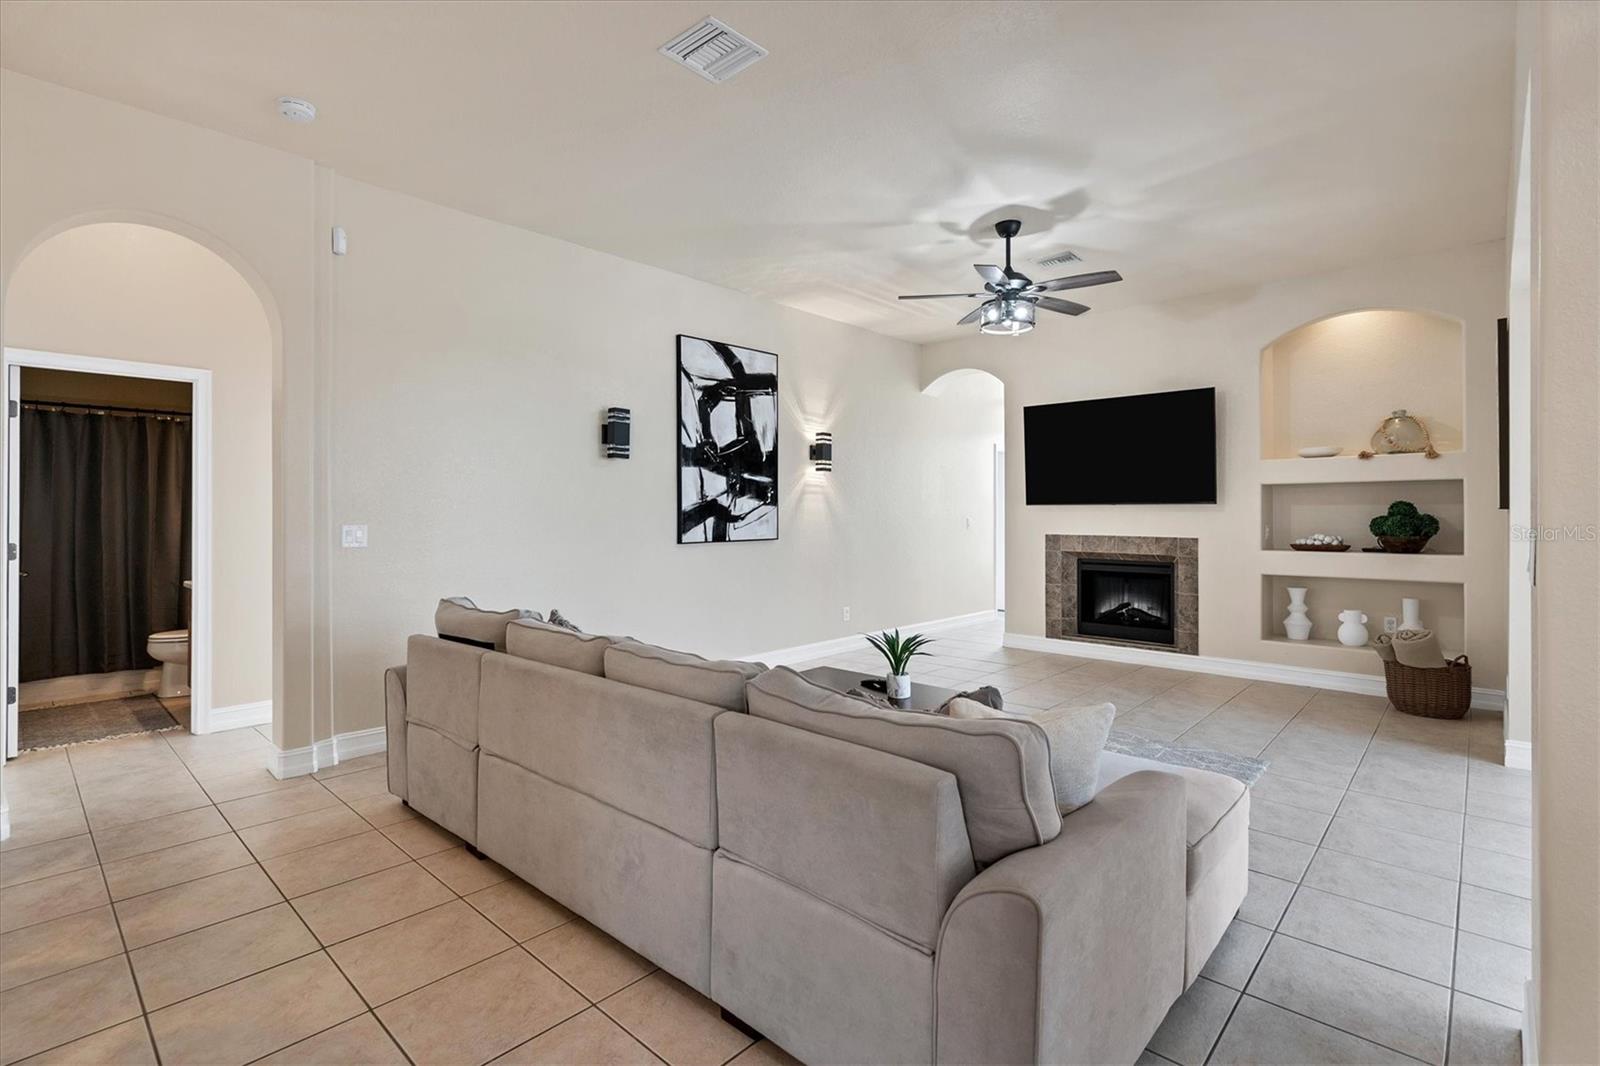
Property Description
Welcome to your next Luxurious Dream home in the Prime area of the highly sought after Punta Gorda, Florida. Nestled in the amazing neighborhood renowned for its top-tier schools and family-friendly ambiance, this spectacular residence embodies the epitome of class, luxury and upscale living. GREAT LOCATION WITH EASY ACCESS COMMUTING NORTH OR SOUTH! Step inside to discover a meticulously maintained residence that seamlessly blends updated amenities with spacious interior highlights recent upgrades throughout the home, ensuring comfort and style at every turn. Centered in the heart of the home, the gourmet chef's kitchen boasts immaculate granite countertops, wood cabinetry, stainless steel appliances, elegant bathrooms, and thoughtfully curated living spaces. This ideal Home has a NEW ROOF-2023, NEW LANAI-2023, New Exterior and Interior Lighting Systems. All the bedrooms fully Remodeled in 2022. This upscale home has four bedrooms, three bathrooms, and a den/home office, with room for family and friends within the 2,450 square feet of living area. Many upgrades including the living area feature high ceilings, arched entryways, an abundance of natural light, neutral décor, new tile flooring, a large formal living/dining room with pocket sliders to lanai, The master suite offers a lighted tray ceiling, slider to lanai, his and HUGE hers walk-in closets, and a private bath with dual sinks, a garden tub, and walk-in shower. Off the Family room there are 2 guest bedrooms with separate full baths and down the hall awaits the fourth bedroom with a separate third bathroom offering a walk-in shower and access to the pool. The outdoor entertaining area features a large, covered lanai and screened pool overlooking a quiet serene setting where sunsets can be enjoyed. This luxurious residence is Meticulously maintained with pride in ownership. Other amenities include an oversized 2.5-car garage, whole-house hurricane protection w/impact-resistant doors & windows, zoned A/C, water heaters. This luxury property is located close to A-rated Schools such as Florida Southwestern Collegiate High School, Sallie Jones Elementary School and Babcock High School which stands as a beacon of academic excellence. Renowned for its rigorous academic programs and commitment to student success, these institutions consistently rank among the TOP SCHOOLS in the area. Punta Gorda, is known for 10 stunning golf courses and 15 parks spanning 80 acres for walking and biking trails. Centrally positioned with easy access to three major airports. However, what truly sets this property apart is its proximity to the picturesque beach, offering a haven for outdoor enthusiasts and those seeking tranquility by the water's edge. There are 20 lakes in Charlotte County for fishing and is close to all the main waterways. This home is located within a short distance of many local favorites, the Isles Yacht Club, moments away from Boca Grande, Fisherman's Village, Fine Dining, Shopping & Boutiques, LIVE entertainment, and the Beautiful Downtown Punta Gorda.
Build Your Team
Quickly find investor-friendly professionals who can help you succeed in real estate investing at any stage of the investing journey.


Agents
Match with investor-friendly agents who can help you find, analyze, and close your next deal


Lenders
Get the best funding…find investor-friendly lenders who specialize in your deal strategy


Property Managers
Transition to passive investing. Find a trusted property management partnership that lasts.


Tax Pros & Accountants
Taxes and financial reporting made easy—find experts to create tax savings strategies, file taxes, and more
Location
Property Details
Parking
- Description: Garage
- Details: Attached
- Garage Spaces: 3
- Spaces Total: 0
Bedroom Information
- # of Bedrooms: 4
Bathroom Information
- # of Baths (Full): 3
- # of Baths (Total): 3.0
Interior Features
- # of Rooms: 8
- # of Stories: 1
Exterior Features
- Exterior Walls Materials: Stucco
- Foundation: Slab
- Roof Material: Tile
- Pool: Yes
HOA
- Has HOA: Yes
- Association: Burnt Store Property Owners Assocation
- HOA Fee: $494/annually
Land Information
- Land Use: Residential
- Land Use Subtype: Single Family Residential
Lot Information
- Parcel ID: 422331160002
- Lot Size: 10375 sqft
Property Information
- Property Type: Single Family Residence
- Style: Mediterranean
- Year Built: 2007
Tax Information
- Annual Tax: $9,793
Utilities
- Water & Sewer: Public
- Heating: Central
- Cooling: Central Air
Location
- County: Charlotte
Listing Details
Investment Summary
- Monthly Cash Flow
- $1,167
- Cap Rate
- 8.2%
- Cash-on-Cash Return
- 8.7%
- Debt Coverage Ratio
- 1.33
- Internal Rate of Return (5 years)
- 12.5%
Cash Flow
Net Operating Income (NOI) minus mortgage payments.
Calculation:
NOI - Mortgage Payments
Cap Rate (Market Value)
Capitalization Rate is a rate of return that compares the yearly Net Operating Income (NOI) to the market value.
Calculation:
NOI / Market Value
Cash-on-Cash Return (CoC)
Annual Cash Flow / Cash Invested
Calculation:
Annual cash flow divided by initial cash invested.
Debt Coverage Ratio (DCR)
Net Operating Income (NOI) divided by total debt payments.
Calculation:
NOI / Total Debt Payments
Internal Rate of Return (IRR)
A metric for assessing profitability over time. IRR is the discount rate at which the net present value (NPV) of all future cash flows (positive and negative) from an investment equals zero — including both periodic cash flow (such as rent) and a projected sale at the end of the holding period. It represents the expected annualized return, accounting for income, expenses, and the recovery of capital through a future sale.
Purchase Details
Purchase PriceThe price paid for the property. Purchase price:
| $695,900 |
|---|---|
Amount FinancedThe amount of the purchase financed through a loan. Amount financed:
| -$556,720 |
Down paymentThe initial payment made towards the purchase. Down payment:
| $139,180 |
Closing CostsFees and expenses associated with purchasing a property, typically ranging from 2% to 5% of the home’s purchase price, paid at the end of a home purchase to cover services like lending, title transfer, and taxes. Closing costs:
| $20,877 |
Rehab CostsCosts incurred to repair or improve the property, including: roof, flooring, exterior siding, kitchen, exterior paint, bathrooms, etc. Rehab costs:
| $0 |
Initial Cash InvestedThe total initial cash invested in the property. Calculation:Down payment + Buying costs + Rehab costs Initial cash invested:
| $160,057 |
Square Feet (SQFT)The total square footage of the property. Square feet:
| 2,465 |
Cost Per Square FootCost per square foot of the property. Calculation:Purchase Price / Square Feet Cost per square foot:
| $282 |
Monthly Rent Per Square FootMonthly rent divided by the number of square feet. This ratio helps investors compare rental income efficiency across properties, markets, and unit sizes Calculation:Monthly Rent / Square Feet Monthly rent per square foot:
| $3.29 |
Financing Details
Loan AmountThe total sum of money borrowed from a lender to finance a property purchase. Calculation:Purchase Price - Down Payment
Loan amount:
| $556,720 |
|---|---|
Loan to Value Ratio (LTV)Loan amount divided by the market value of the property. Calculation:Loan Amount / Market Value
Loan to value ratio:
| 80.0% |
Loan TypeThe type of loan (e.g., fixed, adjustable).
Loan type:
| Amortizing |
TermThe loan repayment period in years.
Term:
| 30 years |
Interest RateThe percentage a lender charges on the borrowed amount of a loan, determining the cost of borrowing money.
Interest rate:
| 6.625% |
Principal & Interest (PI)The principal is the portion of the loan payment that reduces the loan balance. The interest is the lender's charge for borrowing money. Calculation:(P * r * (1 + r) ** n) / ((1 + r) ** n - 1) Where:
P = Loan amount (principal)
Principal & interest:
| $3,565 |
Property TaxesAnnual taxes levied by local governments on real estate properties. These taxes fund public services like schools, roads, and emergency services.
Property tax:
| $816 |
InsuranceThe costs for insurance coverage to protect against financial losses due to risks like fire, natural disasters, theft, liability, or tenant-related damages. Calculation:Assumes 7% of gross rental income, unless insurance rates are specified.
Insurance:
| $567 |
Private Mortgage Insurance (PMI)A fee that borrowers pay when they take out a conventional loan with a loan-to-value (LTV) ratio above 80%.
Private mortgage insurance (PMI):
| $0 |
Monthly PaymentThe fixed amount a borrower pays each month to repay a loan. It typically includes principal and interest (P&I) and may also cover property taxes, insurance, HOA fees, and PMI if escrowed. Monthly payment:
| $4,948 |
Operating Income
| % Rent | Monthly | Yearly | |
|---|---|---|---|
Gross RentThe total rental income received from tenants before deducting any expenses. Includes base rent, late fees, pet fees, parking fees, and other recurring charges.
Gross rent:
| $8,100 | $97,200 | |
Vacancy LossExpected loss of rent due to vacancies.
Vacancy loss:
(6%)
| 6% | -$486 | -$5,832 |
Operating IncomeGross rental income minus vacancy loss. Calculation:Gross rent - Vacancy loss
Operating income:
| $7,614 | $91,368 |
Operating Expenses
| % Rent | Monthly | Yearly | |
|---|---|---|---|
Property TaxesAnnual taxes levied by local governments on real estate properties. These taxes fund public services like schools, roads, and emergency services. | 10% | -$816 | -$9,794 |
InsuranceThe costs for insurance coverage to protect against financial losses due to risks like fire, natural disasters, theft, liability, or tenant-related damages. Calculation:Assumes 7% of gross rental income, unless insurance rates are specified. | 7% | -$567 | -$6,804 |
Property ManagementThe costs associated with hiring a property manager to handle the day-to-day operations of a rental property. Includes management fees, leasing fes, eviction fees, etc. Calculation:Assumes 8% of gross rental income. | 8% | -$648 | -$7,776 |
Repairs & MaintenanceOngoing costs for routine upkeep and minor fixes needed to keep a property in good working condition. Calculation:Assumes 5% of gross rental income. Varies by property age and condition. | 5% | -$405 | -$4,860 |
Capital ExpensesLarge, infrequent costs for major improvements or replacements, like a new roof, HVAC system, or appliances. Calculation:Assumes 5% of gross rental income. Varies by property age. | 5% | -$405 | -$4,860 |
HOA FeesRegular dues paid to a Homeowners Association for community maintenance, amenities, and management. Similar fees include: Condo Association Fees, Co-op Maintenance Fees, etc. | 1% | -$41 | -$492 |
Operating ExpensesRecurring costs required to maintain and manage a rental property, including property taxes, insurance, maintenance, repairs, utilities (if paid by the owner), property management fees, and other day-to-day expenses. Calculation:Insurance + Property Taxes + Property Management + Repairs & Maintenance + Capital Expenditures + HOA Fees | 36% | -$2,882 | -$34,586 |
Cash Flow
| Monthly | Yearly | |
|---|---|---|
Net Operating Income (NOI)The income generated from a property after deducting all operating expenses but before deducting mortgage payments, taxes, and capital expenditures. Calculation:Gross Operating Income - Operating Expenses
Net operating income:
| $4,732 | $56,784 |
Mortgage PaymentThe fixed amount a borrower pays each month to repay a loan. It typically includes principal and interest (P&I) and may also cover property taxes, insurance, HOA fees, and PMI if escrowed. | -$3,565 | -$42,780 |
Cash FlowNet Operating Income (NOI) minus mortgage payments. Calculation:NOI - Mortgage Payments | $1,167 | $14,004 |