
Narrowing the Search for Property using Price-Rent Ratio Maps
Note: Part 2 of this series is now online as well. Read this one first though!
Price-rent ratios are a common metric used by investors to determine if a residential property investment will be profitable. The price-to-rent ratio is a measure of the relative affordability of renting and buying in a given housing market. It is calculated as the ratio of home prices to annual rental rates. So, for example, in a real estate market where, on average, a home worth $100,000 could rent for $1000 a month, the price-rent ratio is 8.83. That’s determined using the formula: $100,000 ÷ (12 x $1,000). A lower number generally indicates a better investment from a cash flow perspective.
Some investors call this the 1% rule. Anything at or above 1% is a good indicator of solid cash flow potential. $1,000 a month in rent is 1% of the purchase price of $100,000. A price-rent ratio of 8.83 corresponds to 1%. Keep in mind though that neither account for other factors including property taxes, insurance, repairs, tenant turnover, and others. Nevertheless, many investors use this as a good rule of thumb.
According to Smart Asset, current price-rent ratios vary greatly in the major U.S. cities with a high of 45.88 in San Francisco all the way down to 6.27 in Detroit. Of course, the lowest price-rent ratios don't guarantee that one city is necessarily better than another. They are just one indicator to consider when researching potential investment properties. In general though if you are looking for good cash flow on a property you're going to be better off looking at properties with lower price-rent ratios.
Understanding the price-rent ratios of a particular city gives us some insight into the viability of residential real estate investment for that locale, but drilling down into small geographies of an area are even more useful. Today I'm going to show you how Zillow data can be used to determine price-rent ratios for smaller areas including zipcodes and neighborhoods. Knowing this information can help you narrow down your search when researching an area.
Zillow Datasets
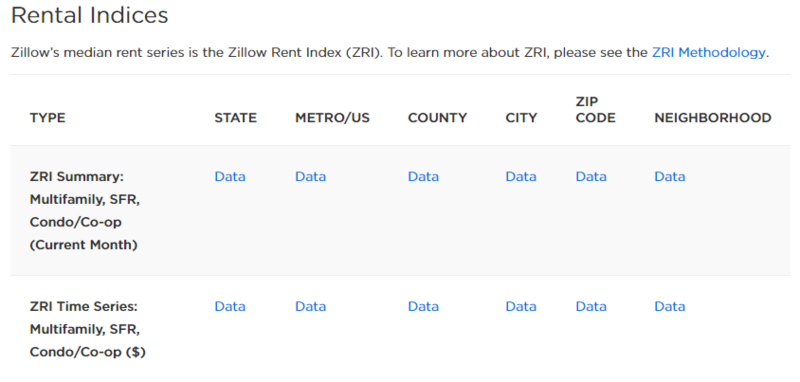
Many people don't realize that Zillow makes it's data publicly available for download as spreadsheets. The main data download page includes links for both residential sales, residential rentals, and some miscellaneous datasets. While you can't necessarily depend upon this data being completely accurate for all areas, it does provide a good dataset to supplement your other research.
As you can see in the screenshot below, Zillow provides a number of different metrics at various levels of geography including state, metro, county, city, zipcode, and neighborhood. Each link for a metric will allow you to download a spreadsheet of data. For example, if you click the Data link for ZRI Summary: Multifamily, SFR, Condo/Co-op (Current Month) under Zipcode it will download a spreadsheet containing this data at a zipcode level for the entire United States. These spreadsheets often contain contain not only the current month, but also columns for each month as far back as they have information. This can be really useful for time-series analysis as we'll see in a future post.
After downloading the spreadsheet you're going to need software that will enable you to visualize the patterns in the data. In this post I'm going to demonstrate how the data can be mapped so that you can see the geographic patterns in the data. However, you could also create graphs and charts with Excel, Tableau, or any number of software providers that enable data visualization in different ways. For this exercise I used ArcGIS Pro. This is a desktop GIS (mapping) software package provided by Esri.
Fortunately, Zillow includes a dataset called Price-Rent Ratio, which is under the Other Metrics category for the main data download page. After downloading the zipcode level dataset for Price-Rent ratio, I opened the table in ArcGIS Pro to find many columns of information including the five digit zipcode along with many months of price-rent ratio information include the most recent month. You can see a partial view of the data in the screenshot below. The 2017-11 (November of 2017) column is the most recent month, but notice that there are many prior months as well. There is also a column for the 5 digit zipcode.

Census Datasets
I then downloaded a geographic dataset containing zipcode boundaries from the U.S. Census Bureau. You can see a screenshot of this dataset below. In this case I'm interested in researching the Austin, TX metropolitan area so I've zoomed into that area, but the same process would apply to any region.

Creating the Map
The trick is to attach the Zillow price-rent ratio data to the U.S. Census Bureau geographic dataset so that you can analyze the data. ArcGIS Pro actually makes this easy as long as you have columns that can be matched. In this case, both datasets include a column for five digit zipcode (76556 for example). So, I used ArcGIS Pro to join these two datasets together so that they can then be visualized geographically.
I then color-coded the dataset using the most recent price-rent ratio provided by Zillow to arrive at the map that you see below.

And here is a legend that describes the color coding:

Interpreting the Map
The zipcodes with a darker blue color have higher-price to rent ratios, and the lighter blue-gray colors have lower price to rent ratios. Unfortunately, Zillow doesn't typically have complete datasets, so the zipcodes that don't have price-rent ratio are those listed as <out of range> and are dark gray on the map. It is common to see income data in most areas so these datasets are by no means perfect, but they do provide a good way of seeing patterns in the data.
In general we can say that the zipcodes that are light gray or blue should be the best candidates for residential real estate, at least from a price-rent ratio. The lowest two categories are less than 10.54 and 10.54 to 12.86. The higher price-rent ratios probably won't make as much sense from a cash flow perspective. This is an excellent way to narrow down your search for an investment property. Rather than just guessing or directing your marketing efforts to the entire metropolitan area, you can now focus on areas that make the most sense. This saves you both time and money!
Zillow Neighborhood Data
I repeated this process using the Zillow neighborhood data to drill down to an even smaller level of geography. Using this level of geography I might further narrow my focus to neighborhoods like Franklin Park, McKinney, Brentwood, and others with a lower price-rent ratio relative to the metropolitan area.

Conclusion
Price-rent ratio mapping using Zillow and U.S. Census data can help you identify areas that have the potential to provide good cash flowing properties. By identifying smaller levels of geography you can also focus your marketing efforts, which saves both time and money.

Comments (16)
I feel that D class neighborhoods will yield the best price:rent ratio. Although, you will sacrifice appreciation, and will have to factor in higher costs for more frequent evictions. As well as turn over costs (higher wear and tear).
Thoughts anyone?
Eric Jones, over 5 years ago
I feel that D class neighborhoods will yield the best price:rent ratio. Although, you will sacrifice appreciation, and will have to factor in higher costs for more frequent evictions. As well as turn over costs (higher wear and tear).
Thoughts anyone?
Eric Jones, over 5 years ago
Apparently Zillow does not provide that data anymore - does anyone know of any alternatives?
Philipp Marceta, about 6 years ago
Apparently Zillow does not provide that data anymore - does anyone know of any alternatives?
Philipp Marceta, about 6 years ago
Great article, exactly what I was looking for. Does Zillow no long support the price to rent ratio metric? I can't seem to find the option to download that.
Michael Anderson, about 6 years ago
Thanks Eric. Where did you acquire the geographic boundary data that defines the Zillow neighborhoods? Does this have to be requested from Zillow or is it available for direct download somewhere?
Ryan Reeves, over 6 years ago
Thanks Eric. Where did you acquire the geographic boundary data that defines the Zillow neighborhoods? Does this have to be requested from Zillow or is it available for direct download somewhere?
Ryan Reeves, over 6 years ago
Eric,
Great post! just wanted to say thank you for the information. I use Tableau at work daily, and this made choosing the areas i want to invest in much easier.
Ryan Weber, almost 8 years ago
Has anybody gotten this to work? I'm a complete newbie to GIS and have been trying to get this working using GRASS GIS (open source) with the help of the GRASS forums, but seem to be getting stuck at every step along the way. Should I be using a different GIS program, or is it easier to use Excel, etc as mentioned in the 7th paragraph? Thx!
Gil Happy, over 8 years ago
Thanx for a higly educative post. Reading it felt like going back to graduate school,I should have taken my statistics course much more seriously! My computer broke down months ago,and reading this I am determined to get a new one and try this out. I am a beginner here,so I really appreciate this post.
Afia Amponsah, over 8 years ago
Wow, this is amazing! Information like this was previously only available to big businesses and institutions employing thousands of analysts and now we can get it while sitting at home at a computer. Thank you!
Bryan Zuetel, over 8 years ago
@Brandon Turner This article references the ESRI I mentioned in one of your Facebook Live videos.
Dustin Young, over 8 years ago
Thanks for the comment @Dustin Young. I've been working with Esri products at my "day job" for about 25 years now. They make good mapping products and are unquestionably the leader in that software space. There are some other good options as well that are lower priced though including Carto and MapBox.
Eric Pimpler, over 8 years ago
This is awesome! I've been looking for this type of dataset for awhile to build a map for myself to make out of town investing less risky. I'm guessing the Zillow data cant be used for commercial use though?
Justin M Christian, over 8 years ago
Hey Justin,
Unfortunately Zillow doesn't provide much in the way of commercial data sets. Maybe someday.
Eric Pimpler, over 8 years ago
Very helpful. I'm going to investigate the Zillow datasets.
Suzie Remilien, over 8 years ago