$1,199,000
Investment Summary
- Monthly Cash Flow
- -$1,694
- Cap Rate
- 4.5%
- Cash-on-Cash Return
- -7.4%
- Debt Coverage Ratio
- 0.72
- Internal Rate of Return (5 years)
- -3.1%
Cash Flow
Net Operating Income (NOI) minus mortgage payments.
Calculation:
NOI - Mortgage Payments
Cap Rate (Market Value)
Capitalization Rate is a rate of return that compares the yearly Net Operating Income (NOI) to the market value.
Calculation:
NOI / Market Value
Cash-on-Cash Return (CoC)
Annual Cash Flow / Cash Invested
Calculation:
Annual cash flow divided by initial cash invested.
Debt Coverage Ratio (DCR)
Net Operating Income (NOI) divided by total debt payments.
Calculation:
NOI / Total Debt Payments
Internal Rate of Return (IRR)
A metric for assessing profitability over time. IRR is the discount rate at which the net present value (NPV) of all future cash flows (positive and negative) from an investment equals zero — including both periodic cash flow (such as rent) and a projected sale at the end of the holding period. It represents the expected annualized return, accounting for income, expenses, and the recovery of capital through a future sale.
Property Description
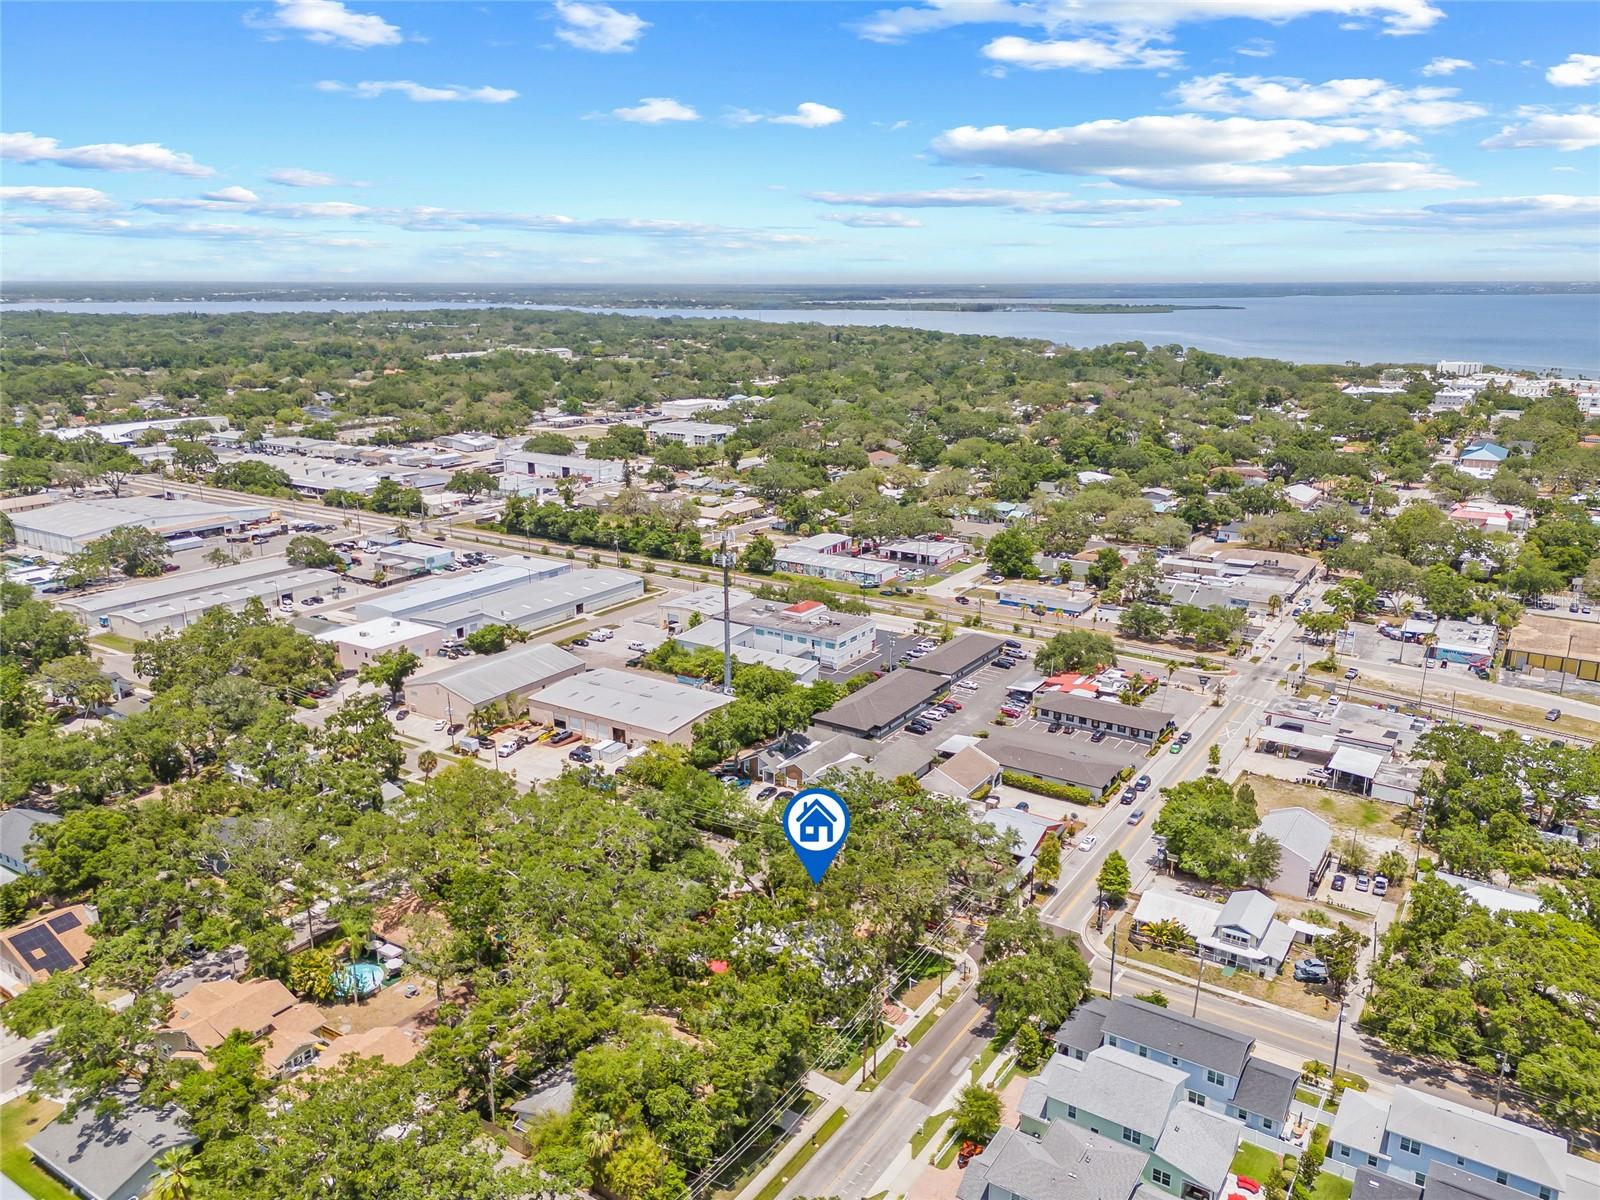
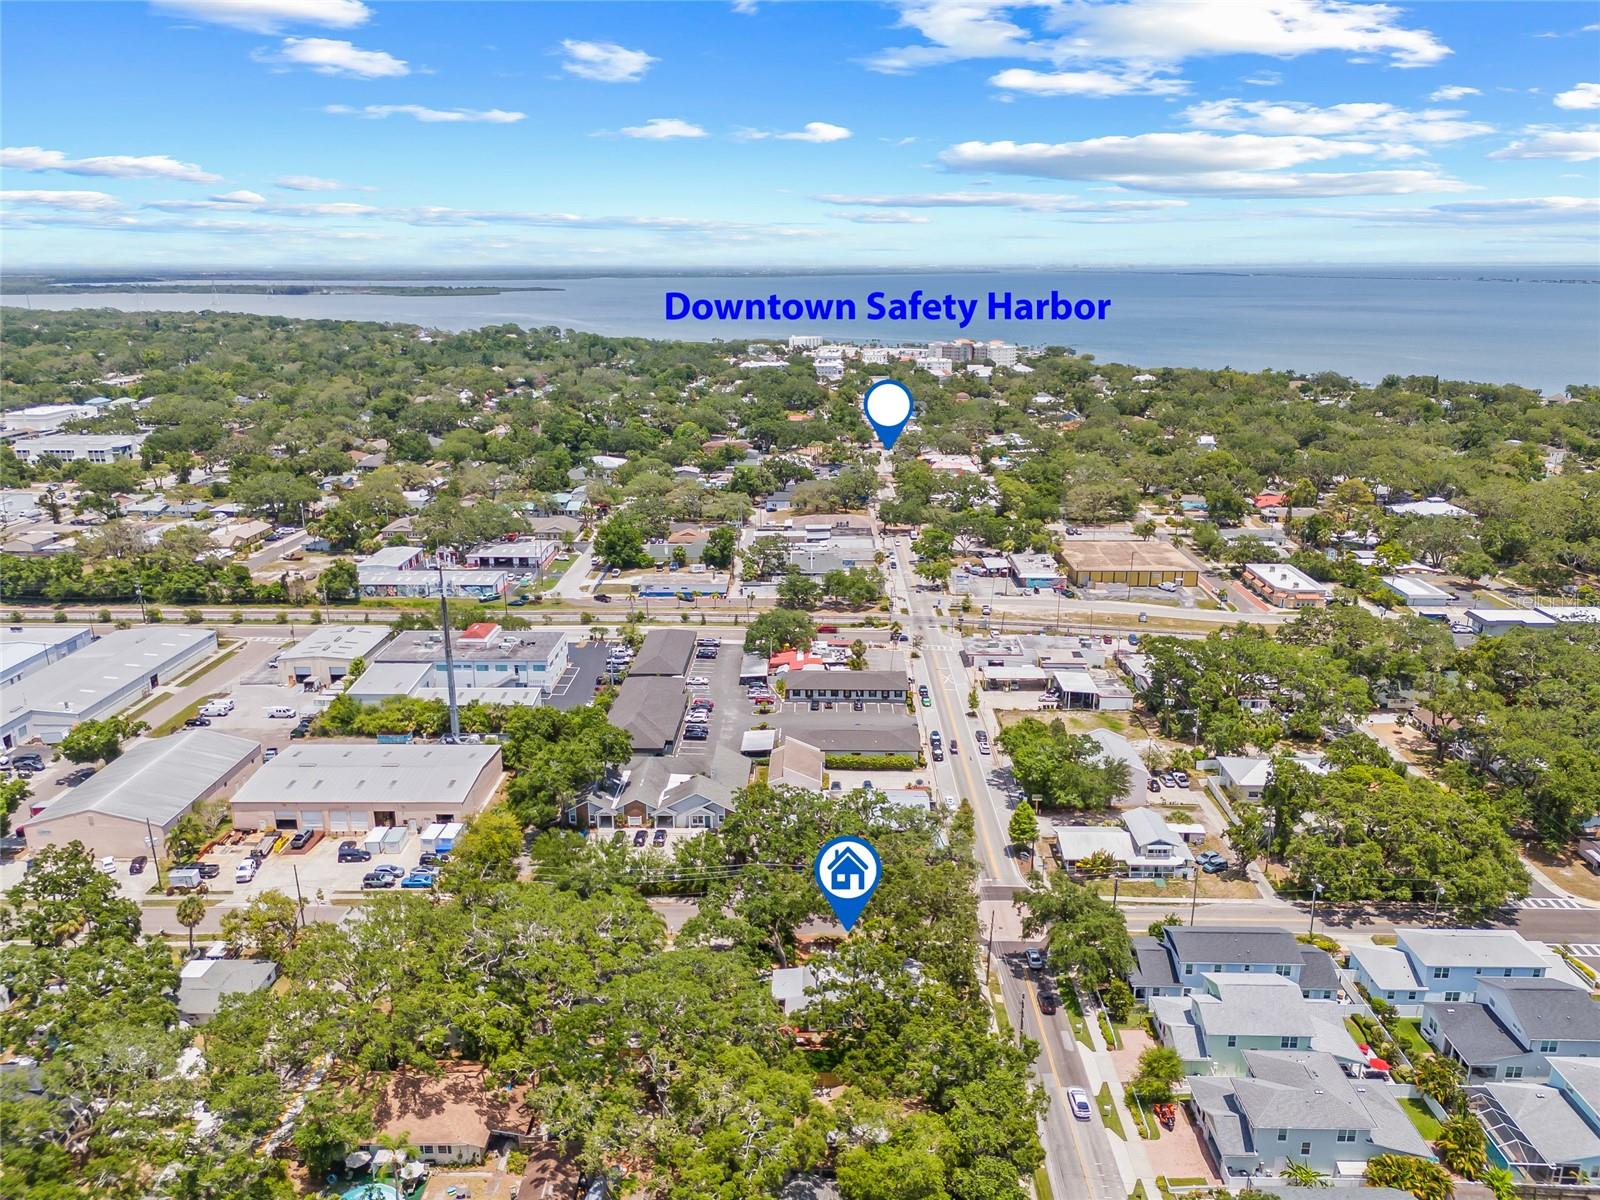
A true Safety Harbor original—full of warmth, charm, and history. 1005 Main Street isn’t just a home—it’s a front-row seat to one of Florida’s most beloved small towns. Built in 1915, two years before the town was officially founded, this 3-bedroom, 2-bath plus den Craftsman Bungalow sits proudly on a rare double lot right at the edge of downtown. From the moment you step onto the string-lit front porch, the home feels like something out of a storybook. Inside, nearly 2,600 square feet unfold with refinished original hardwood floors, coffered ceilings, a cozy window bench, and built-in details throughout. The main level features a welcoming front sitting room, a large dining area, and a living room that flows seamlessly into the heart of the home—the kitchen. The kitchen is warm, inviting, and full of character. Fully reimagined in 2020, it features quartz countertops, a marble backsplash, and a showpiece ILVE gas range framed by an arched brick wall built with reclaimed brick from Ybor City in Tampa. Just off the kitchen, the laundry and mudroom combo adds both function and charm, complete with a custom indoor dog wash station—perfect for post-park cleanups or muddy paws after a downtown stroll. Downstairs also includes a guest bedroom and full bath, along with a flexible den or office space. Upstairs, the spacious primary suite includes an ensuite bath and walk-in closet, while the third bedroom brings in tons of natural light and charm. Out back, the fully fenced yard offers a peaceful escape with artificial turf, mature trees, and a courtyard-style layout. Alley access, a circular driveway, and a detached shed offer added convenience. Approved for a pool, garage, or ADU, this rare double lot offers privacy when you want it and walkability to downtown when you don’t—the best of both worlds. The home has been consistently cared for and thoughtfully updated. In 2020, the kitchen, family room, and laundry area were completely redone, along with new hardwood floors and custom finishes. Both bathrooms have been refreshed, and the upstairs bath received a full update in 2013. There are two central AC units—one just a few years old—the gas tankless water heater adds efficiency, and the standing seam metal roof had all its fittings replaced in 2020. Plumbing has been upgraded with PVC, including a full sewer line replacement, and the electrical system includes two updated breaker panels. Spray foam insulation helps with year-round comfort, and foundation piers were redone in 2013. A brand-new wood fence was added in 2025, the yard includes artificial turf, and the landscaping has been professionally maintained, with tree trimming in both 2023 and 2025. Other thoughtful touches include a 10x10 custom shed, full irrigation system, water softener, and string lighting that brings a cozy glow to the porch and backyard. The home sits in Flood Zone X—no flood insurance required—and has never had storm damage. It’s high and dry, solid and sound, and ready for the next chapter. And the best part? You’re just steps from everything downtown Safety Harbor has to offer. Walk or hop in the golf cart to Gigglewaters, The Brinehouse, HavenHouse Coffee, Water Oak, and the Sunday Market. With art festivals, live music, and local favorites all around, this home isn’t just a place to live—it’s a lifestyle. This is more than just one of Safety Harbor’s original homes. It’s one of its most admired—and now it’s ready to be part of someone else’s story.
Build Your Team
Quickly find investor-friendly professionals who can help you succeed in real estate investing at any stage of the investing journey.


Agents
Match with investor-friendly agents who can help you find, analyze, and close your next deal


Lenders
Get the best funding…find investor-friendly lenders who specialize in your deal strategy


Property Managers
Transition to passive investing. Find a trusted property management partnership that lasts.


Tax Pros & Accountants
Taxes and financial reporting made easy—find experts to create tax savings strategies, file taxes, and more
Location
Property Details
Parking
- Details: Alley Access, Circular Driveway, Driveway, Parking Pad
- Garage Spaces: 0
- Spaces Total: 0
Bedroom Information
- # of Bedrooms: 3
Bathroom Information
- # of Baths (Full): 2
- # of Baths (Total): 2.0
Interior Features
- # of Rooms: 3
- # of Stories: 2
- Basement Description: Crawl Space
- Fireplace: Yes
Exterior Features
- Exterior Walls Materials: Wood
- Foundation: Pillar/Post/Pier
- Roof Type: Gable
- Roof Material: Metal
Land Information
- Land Use: Residential
- Land Use Subtype: Single Family Residential
Lot Information
- Parcel ID: 042916800280040190
- Lot Size: 10241 sqft
Property Information
- Property Type: Single Family Residence
- Year Built: 1915
Tax Information
- Annual Tax: $4,578
Utilities
- Water & Sewer: Public
- Heating: Central
- Cooling: Central Air
Location
- County: Pinellas
Listing Details
Investment Summary
- Monthly Cash Flow
- -$1,694
- Cap Rate
- 4.5%
- Cash-on-Cash Return
- -7.4%
- Debt Coverage Ratio
- 0.72
- Internal Rate of Return (5 years)
- -3.1%
Cash Flow
Net Operating Income (NOI) minus mortgage payments.
Calculation:
NOI - Mortgage Payments
Cap Rate (Market Value)
Capitalization Rate is a rate of return that compares the yearly Net Operating Income (NOI) to the market value.
Calculation:
NOI / Market Value
Cash-on-Cash Return (CoC)
Annual Cash Flow / Cash Invested
Calculation:
Annual cash flow divided by initial cash invested.
Debt Coverage Ratio (DCR)
Net Operating Income (NOI) divided by total debt payments.
Calculation:
NOI / Total Debt Payments
Internal Rate of Return (IRR)
A metric for assessing profitability over time. IRR is the discount rate at which the net present value (NPV) of all future cash flows (positive and negative) from an investment equals zero — including both periodic cash flow (such as rent) and a projected sale at the end of the holding period. It represents the expected annualized return, accounting for income, expenses, and the recovery of capital through a future sale.
Purchase Details
Purchase PriceThe price paid for the property. Purchase price:
| $1,199,000 |
|---|---|
Amount FinancedThe amount of the purchase financed through a loan. Amount financed:
| -$959,200 |
Down paymentThe initial payment made towards the purchase. Down payment:
| $239,800 |
Closing CostsFees and expenses associated with purchasing a property, typically ranging from 2% to 5% of the home’s purchase price, paid at the end of a home purchase to cover services like lending, title transfer, and taxes. Closing costs:
| $35,970 |
Rehab CostsCosts incurred to repair or improve the property, including: roof, flooring, exterior siding, kitchen, exterior paint, bathrooms, etc. Rehab costs:
| $0 |
Initial Cash InvestedThe total initial cash invested in the property. Calculation:Down payment + Buying costs + Rehab costs Initial cash invested:
| $275,770 |
Square Feet (SQFT)The total square footage of the property. Square feet:
| 2,550 |
Cost Per Square FootCost per square foot of the property. Calculation:Purchase Price / Square Feet Cost per square foot:
| $470 |
Monthly Rent Per Square FootMonthly rent divided by the number of square feet. This ratio helps investors compare rental income efficiency across properties, markets, and unit sizes Calculation:Monthly Rent / Square Feet Monthly rent per square foot:
| $2.75 |
Financing Details
Loan AmountThe total sum of money borrowed from a lender to finance a property purchase. Calculation:Purchase Price - Down Payment
Loan amount:
| $959,200 |
|---|---|
Loan to Value Ratio (LTV)Loan amount divided by the market value of the property. Calculation:Loan Amount / Market Value
Loan to value ratio:
| 80.0% |
Loan TypeThe type of loan (e.g., fixed, adjustable).
Loan type:
| Amortizing |
TermThe loan repayment period in years.
Term:
| 30 years |
Interest RateThe percentage a lender charges on the borrowed amount of a loan, determining the cost of borrowing money.
Interest rate:
| 6.625% |
Principal & Interest (PI)The principal is the portion of the loan payment that reduces the loan balance. The interest is the lender's charge for borrowing money. Calculation:(P * r * (1 + r) ** n) / ((1 + r) ** n - 1) Where:
P = Loan amount (principal)
Principal & interest:
| $6,142 |
Property TaxesAnnual taxes levied by local governments on real estate properties. These taxes fund public services like schools, roads, and emergency services.
Property tax:
| $382 |
InsuranceThe costs for insurance coverage to protect against financial losses due to risks like fire, natural disasters, theft, liability, or tenant-related damages. Calculation:Assumes 7% of gross rental income, unless insurance rates are specified.
Insurance:
| $490 |
Private Mortgage Insurance (PMI)A fee that borrowers pay when they take out a conventional loan with a loan-to-value (LTV) ratio above 80%.
Private mortgage insurance (PMI):
| $0 |
Monthly PaymentThe fixed amount a borrower pays each month to repay a loan. It typically includes principal and interest (P&I) and may also cover property taxes, insurance, HOA fees, and PMI if escrowed. Monthly payment:
| $7,014 |
Operating Income
| % Rent | Monthly | Yearly | |
|---|---|---|---|
Gross RentThe total rental income received from tenants before deducting any expenses. Includes base rent, late fees, pet fees, parking fees, and other recurring charges.
Gross rent:
| $7,000 | $84,000 | |
Vacancy LossExpected loss of rent due to vacancies.
Vacancy loss:
(6%)
| 6% | -$420 | -$5,040 |
Operating IncomeGross rental income minus vacancy loss. Calculation:Gross rent - Vacancy loss
Operating income:
| $6,580 | $78,960 |
Operating Expenses
| % Rent | Monthly | Yearly | |
|---|---|---|---|
Property TaxesAnnual taxes levied by local governments on real estate properties. These taxes fund public services like schools, roads, and emergency services. | 5% | -$382 | -$4,578 |
InsuranceThe costs for insurance coverage to protect against financial losses due to risks like fire, natural disasters, theft, liability, or tenant-related damages. Calculation:Assumes 7% of gross rental income, unless insurance rates are specified. | 7% | -$490 | -$5,880 |
Property ManagementThe costs associated with hiring a property manager to handle the day-to-day operations of a rental property. Includes management fees, leasing fes, eviction fees, etc. Calculation:Assumes 8% of gross rental income. | 8% | -$560 | -$6,720 |
Repairs & MaintenanceOngoing costs for routine upkeep and minor fixes needed to keep a property in good working condition. Calculation:Assumes 5% of gross rental income. Varies by property age and condition. | 5% | -$350 | -$4,200 |
Capital ExpensesLarge, infrequent costs for major improvements or replacements, like a new roof, HVAC system, or appliances. Calculation:Assumes 5% of gross rental income. Varies by property age. | 5% | -$350 | -$4,200 |
HOA FeesRegular dues paid to a Homeowners Association for community maintenance, amenities, and management. Similar fees include: Condo Association Fees, Co-op Maintenance Fees, etc. | n/a | n/a | n/a |
Operating ExpensesRecurring costs required to maintain and manage a rental property, including property taxes, insurance, maintenance, repairs, utilities (if paid by the owner), property management fees, and other day-to-day expenses. Calculation:Insurance + Property Taxes + Property Management + Repairs & Maintenance + Capital Expenditures + HOA Fees | 30% | -$2,132 | -$25,578 |
Cash Flow
| Monthly | Yearly | |
|---|---|---|
Net Operating Income (NOI)The income generated from a property after deducting all operating expenses but before deducting mortgage payments, taxes, and capital expenditures. Calculation:Gross Operating Income - Operating Expenses
Net operating income:
| $4,448 | $53,376 |
Mortgage PaymentThe fixed amount a borrower pays each month to repay a loan. It typically includes principal and interest (P&I) and may also cover property taxes, insurance, HOA fees, and PMI if escrowed. | -$6,142 | -$73,704 |
Cash FlowNet Operating Income (NOI) minus mortgage payments. Calculation:NOI - Mortgage Payments | $1,694 | $20,328 |