
$740,000
Investment Summary
- Monthly Cash Flow
- -$3,064
- Cap Rate
- 1.3%
- Cash-on-Cash Return
- -21.6%
- Debt Coverage Ratio
- 0.21
- Internal Rate of Return (5 years)
- -16.9%
Cash Flow
Net Operating Income (NOI) minus mortgage payments.
Calculation:
NOI - Mortgage Payments
Cap Rate (Market Value)
Capitalization Rate is a rate of return that compares the yearly Net Operating Income (NOI) to the market value.
Calculation:
NOI / Market Value
Cash-on-Cash Return (CoC)
Annual Cash Flow / Cash Invested
Calculation:
Annual cash flow divided by initial cash invested.
Debt Coverage Ratio (DCR)
Net Operating Income (NOI) divided by total debt payments.
Calculation:
NOI / Total Debt Payments
Internal Rate of Return (IRR)
A metric for assessing profitability over time. IRR is the discount rate at which the net present value (NPV) of all future cash flows (positive and negative) from an investment equals zero — including both periodic cash flow (such as rent) and a projected sale at the end of the holding period. It represents the expected annualized return, accounting for income, expenses, and the recovery of capital through a future sale.
Property Description
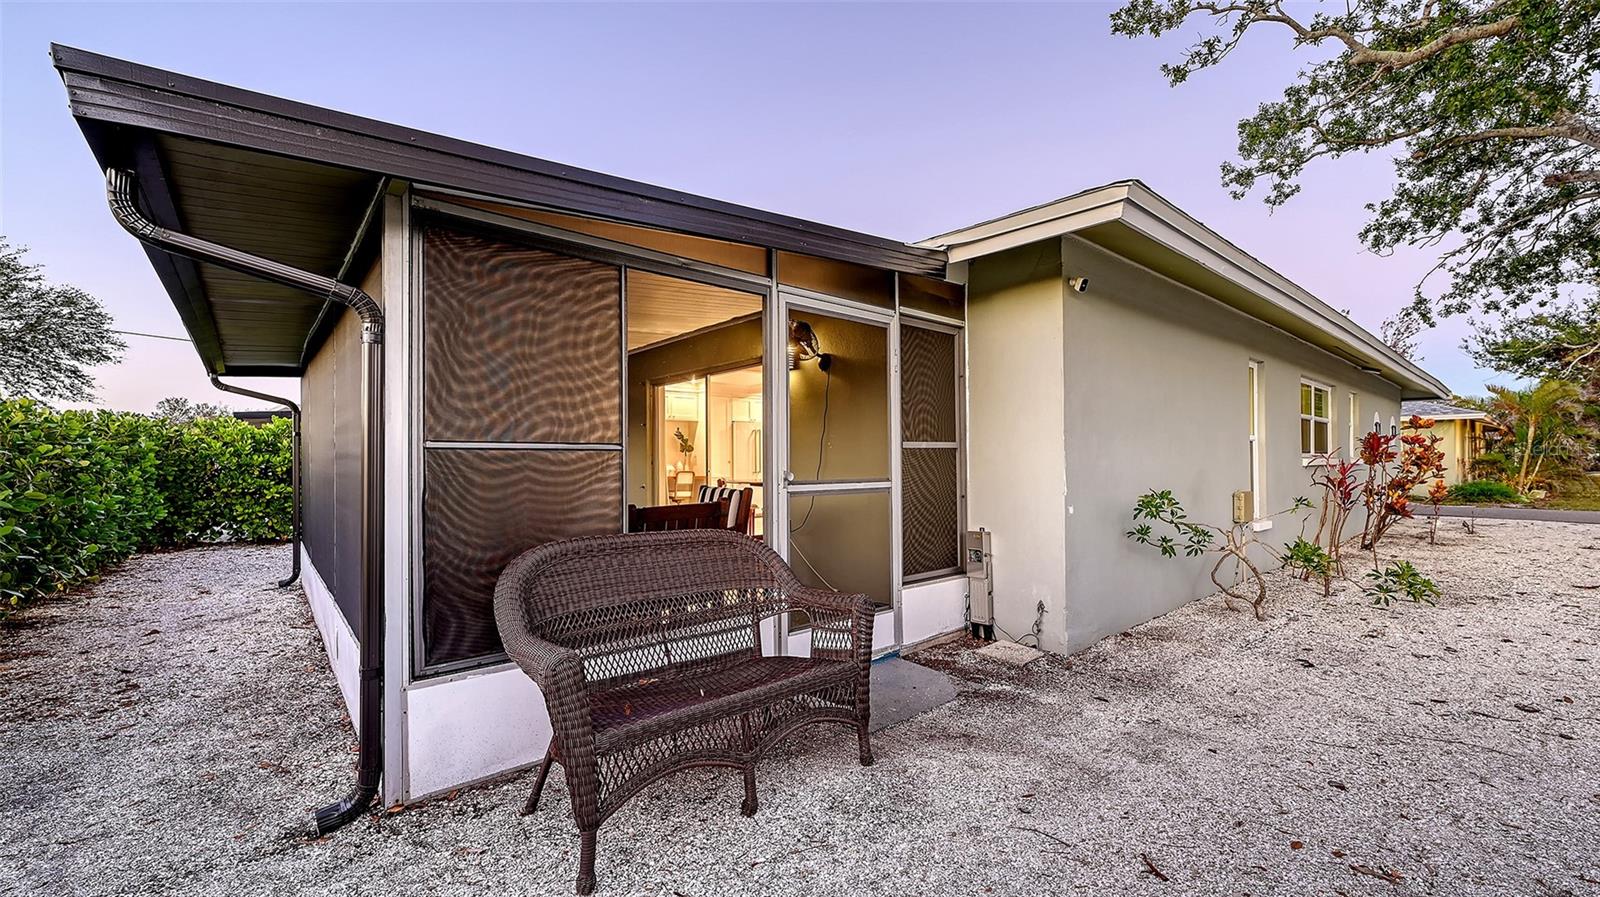
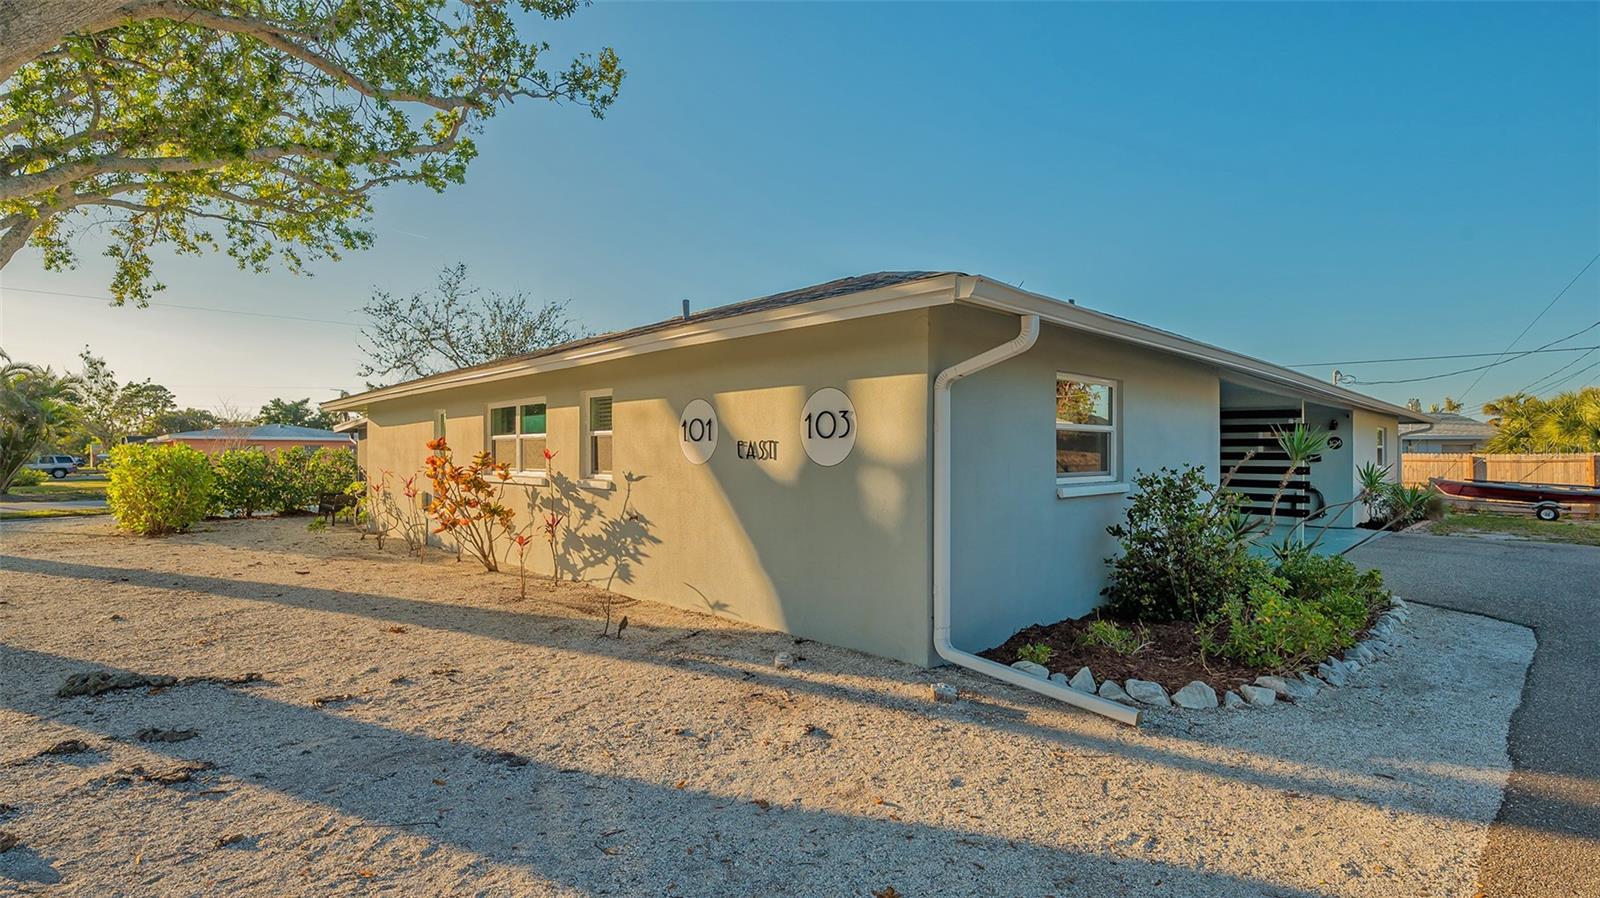
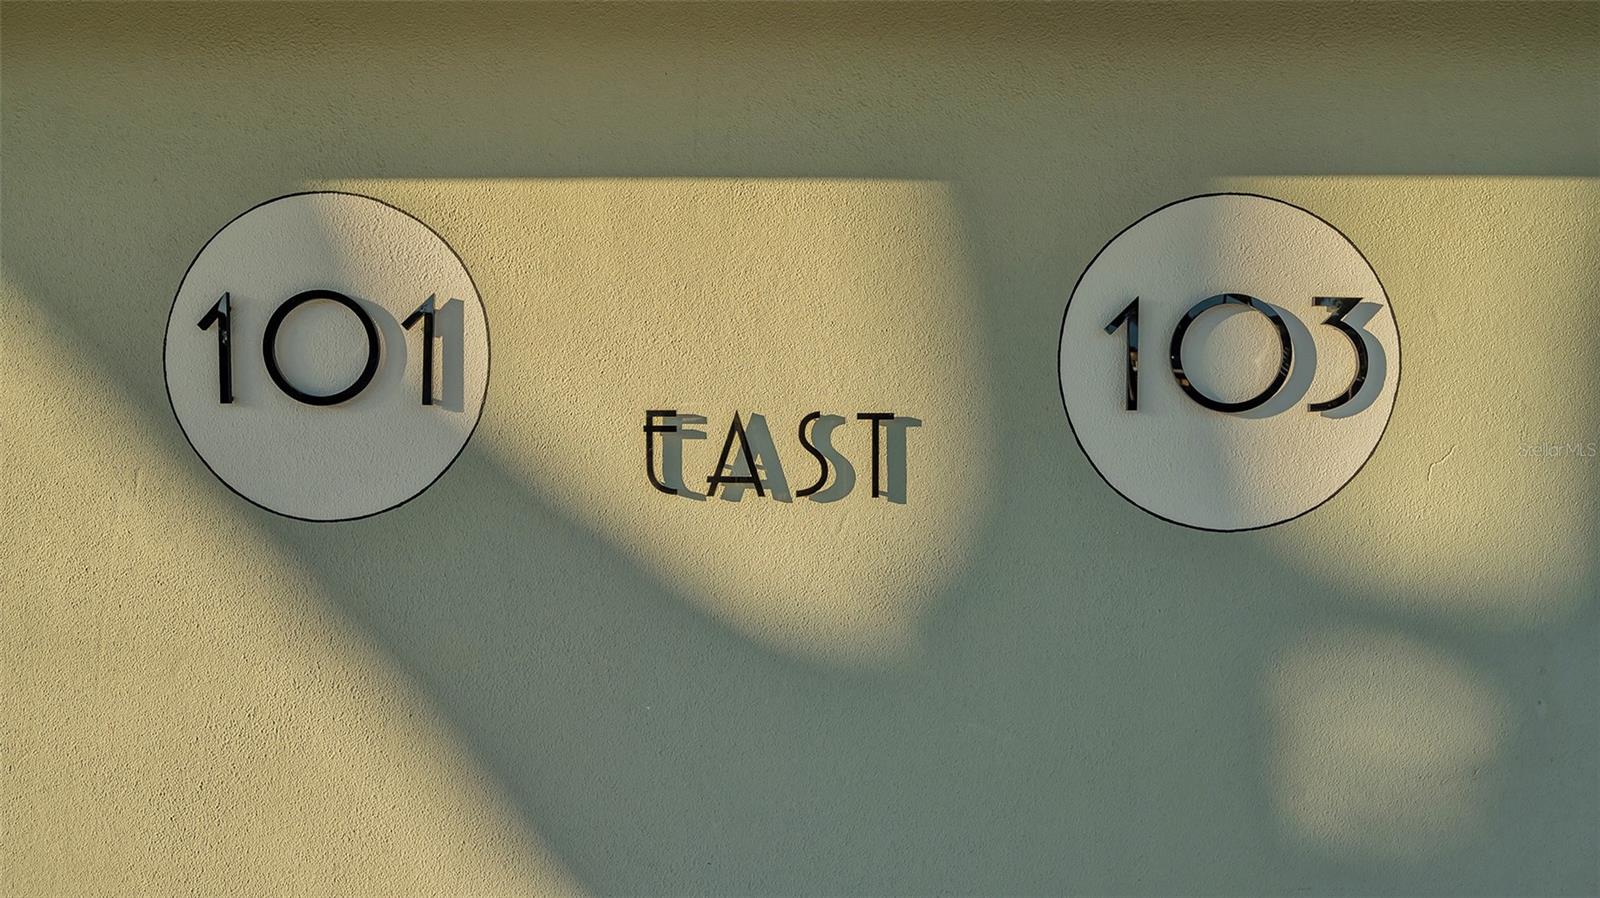
WEEKLY RENTAL AS CONFIRMED BY THE CITY OF VENICE'S PLANNING AND ZONING. An estimated $105,000/yr in gross income. You can do more often, 3-5 day rental periods, as long as it's not run like a "hotel." There should be ROOM FOR POOL between the rear lanais, as long as it's within the setbacks. Inquire with agent for details. A premier WEEKLY (or more frequent!) income-producing (or) multi generational property on Venice Island, this fully renovated mid-century duplex blends exceptional craftsmanship with modern luxury. Just blocks from the Gulf of Mexico, this residence is ideal for high-demand rentals, an executive retreat, or a live-and-rent investment, offering strong income potential in a prime coastal setting. Maybe 5 mins to Venice Dog Beach and similar to Venice Beach. Designed and enhanced by skilled artisans with decades of expertise in custom woodworking, the home showcases coffered ceilings, elegant crown molding, and custom-milled window casings. 7’ mahogany interior doors with sleek chrome hardware add warmth and sophistication, while new plumbing, electrical systems, HVAC ductwork, PVC drain pipes, and drywall ensure long-term durability. Safe and Sound Rockwool insulation enhances privacy, and the wall between the two laundry rooms of units 101 & 103 has been soundproofed for added comfort, ensuring privacy between spaces. The open-concept layout is designed for both style and function, featuring porcelain tile flooring throughout—no carpeting anywhere. The modern kitchens include deep white farmer’s sinks, elevated cabinetry, quartz countertops, and premium appliances, while canless LED lighting, ceiling fans throughout, and USB charging outlets provide contemporary convenience. All windows are hurricane impact-rated, except for the sliding glass doors. Each unit extends outdoors with its own private screened and covered lanai, creating a peaceful retreat to enjoy the fresh coastal air. Oversized carports with additional storage offer plenty of space for vehicles, beach gear, and personal belongings. The front yard is landscaped with all shell and no grass, making it both low-maintenance and visually appealing. Mature, oversized trees in the front yard provide shade and character, while the side yard features simple landscaping for added charm. With zero-scaped landscaping, upkeep is minimal, allowing more time to enjoy the Florida lifestyle. This dog-friendly neighborhood is perfect for walking, with quiet streets and a welcoming atmosphere. Venice’s year-round tourism market ensures strong rental demand, with visitors drawn to its pristine beaches, the Venice Fishing Pier, and popular waterfront dining at Sharky’s on the Pier. Nearby boating access, scenic trails along the Venetian Waterway Park, and historic downtown Venice offer shopping, dining, and entertainment in a charming, walkable setting. NOT in a flood zone, NO HOA or CDD fees, all of which both lessen the hassle of more rules and overall profits. WEEKLY or more frequent rental upside for ROI. With its high-end upgrades, low-maintenance landscaping, and prime island location, this property presents an extraordinary opportunity to own a luxury duplex in one of Florida’s most desirable coastal communities. Whether maximizing rental income or enjoying an elegant island retreat, this is an investment in both lifestyle and financial success. ROOF 2017, AC 2011. WATER heaters both 2020.
Build Your Team
Quickly find investor-friendly professionals who can help you succeed in real estate investing at any stage of the investing journey.


Agents
Match with investor-friendly agents who can help you find, analyze, and close your next deal


Lenders
Get the best funding…find investor-friendly lenders who specialize in your deal strategy


Property Managers
Transition to passive investing. Find a trusted property management partnership that lasts.


Tax Pros & Accountants
Taxes and financial reporting made easy—find experts to create tax savings strategies, file taxes, and more
Location
Property Details
Parking
- Description: Carport
- Details: Covered, Driveway, Oversized
- Garage Spaces: 0
- Spaces Total: 0
Bedroom Information
- # of Bedrooms: 4
Bathroom Information
- # of Baths (Full): 4
- # of Baths (Total): 4.0
Interior Features
- # of Rooms: 8
Exterior Features
- Exterior Walls Materials: Concrete Block
- Foundation: Slab
- Roof Type: Hip
- Roof Material: Shingle
Land Information
- Land Use: Residential
- Land Use Subtype: Single Family Residential
Lot Information
- Parcel ID: 0430140049
- Lot Size: 10768 sqft
Property Information
- Property Type: Single Family Residence
- Style: Florida, Other, Ranch
- Year Built: 1974
Tax Information
- Annual Tax: $9,449
Utilities
- Water & Sewer: Public
- Heating: Central, Electric
- Cooling: Central Air
Location
- County: Sarasota
Listing Details
Investment Summary
- Monthly Cash Flow
- -$3,064
- Cap Rate
- 1.3%
- Cash-on-Cash Return
- -21.6%
- Debt Coverage Ratio
- 0.21
- Internal Rate of Return (5 years)
- -16.9%
Cash Flow
Net Operating Income (NOI) minus mortgage payments.
Calculation:
NOI - Mortgage Payments
Cap Rate (Market Value)
Capitalization Rate is a rate of return that compares the yearly Net Operating Income (NOI) to the market value.
Calculation:
NOI / Market Value
Cash-on-Cash Return (CoC)
Annual Cash Flow / Cash Invested
Calculation:
Annual cash flow divided by initial cash invested.
Debt Coverage Ratio (DCR)
Net Operating Income (NOI) divided by total debt payments.
Calculation:
NOI / Total Debt Payments
Internal Rate of Return (IRR)
A metric for assessing profitability over time. IRR is the discount rate at which the net present value (NPV) of all future cash flows (positive and negative) from an investment equals zero — including both periodic cash flow (such as rent) and a projected sale at the end of the holding period. It represents the expected annualized return, accounting for income, expenses, and the recovery of capital through a future sale.
Purchase Details
Purchase PriceThe price paid for the property. Purchase price:
| $740,000 |
|---|---|
Amount FinancedThe amount of the purchase financed through a loan. Amount financed:
| -$592,000 |
Down paymentThe initial payment made towards the purchase. Down payment:
| $148,000 |
Closing CostsFees and expenses associated with purchasing a property, typically ranging from 2% to 5% of the home’s purchase price, paid at the end of a home purchase to cover services like lending, title transfer, and taxes. Closing costs:
| $22,200 |
Rehab CostsCosts incurred to repair or improve the property, including: roof, flooring, exterior siding, kitchen, exterior paint, bathrooms, etc. Rehab costs:
| $0 |
Initial Cash InvestedThe total initial cash invested in the property. Calculation:Down payment + Buying costs + Rehab costs Initial cash invested:
| $170,200 |
Square Feet (SQFT)The total square footage of the property. Square feet:
| 2,248 |
Cost Per Square FootCost per square foot of the property. Calculation:Purchase Price / Square Feet Cost per square foot:
| $329 |
Monthly Rent Per Square FootMonthly rent divided by the number of square feet. This ratio helps investors compare rental income efficiency across properties, markets, and unit sizes Calculation:Monthly Rent / Square Feet Monthly rent per square foot:
| $1.02 |
Financing Details
Loan AmountThe total sum of money borrowed from a lender to finance a property purchase. Calculation:Purchase Price - Down Payment
Loan amount:
| $592,000 |
|---|---|
Loan to Value Ratio (LTV)Loan amount divided by the market value of the property. Calculation:Loan Amount / Market Value
Loan to value ratio:
| 80.0% |
Loan TypeThe type of loan (e.g., fixed, adjustable).
Loan type:
| Amortizing |
TermThe loan repayment period in years.
Term:
| 30 years |
Interest RateThe percentage a lender charges on the borrowed amount of a loan, determining the cost of borrowing money.
Interest rate:
| 6.810% |
Principal & Interest (PI)The principal is the portion of the loan payment that reduces the loan balance. The interest is the lender's charge for borrowing money. Calculation:(P * r * (1 + r) ** n) / ((1 + r) ** n - 1) Where:
P = Loan amount (principal)
Principal & interest:
| $3,863 |
Property TaxesAnnual taxes levied by local governments on real estate properties. These taxes fund public services like schools, roads, and emergency services.
Property tax:
| $788 |
InsuranceThe costs for insurance coverage to protect against financial losses due to risks like fire, natural disasters, theft, liability, or tenant-related damages. Calculation:Assumes 7% of gross rental income, unless insurance rates are specified.
Insurance:
| $161 |
Private Mortgage Insurance (PMI)A fee that borrowers pay when they take out a conventional loan with a loan-to-value (LTV) ratio above 80%.
Private mortgage insurance (PMI):
| $0 |
Monthly PaymentThe fixed amount a borrower pays each month to repay a loan. It typically includes principal and interest (P&I) and may also cover property taxes, insurance, HOA fees, and PMI if escrowed. Monthly payment:
| $4,812 |
Operating Income
| % Rent | Monthly | Yearly | |
|---|---|---|---|
Gross RentThe total rental income received from tenants before deducting any expenses. Includes base rent, late fees, pet fees, parking fees, and other recurring charges.
Gross rent:
| $2,300 | $27,600 | |
Vacancy LossExpected loss of rent due to vacancies.
Vacancy loss:
(6%)
| 6% | -$138 | -$1,656 |
Operating IncomeGross rental income minus vacancy loss. Calculation:Gross rent - Vacancy loss
Operating income:
| $2,162 | $25,944 |
Operating Expenses
| % Rent | Monthly | Yearly | |
|---|---|---|---|
Property TaxesAnnual taxes levied by local governments on real estate properties. These taxes fund public services like schools, roads, and emergency services. | 34% | -$788 | -$9,450 |
InsuranceThe costs for insurance coverage to protect against financial losses due to risks like fire, natural disasters, theft, liability, or tenant-related damages. Calculation:Assumes 7% of gross rental income, unless insurance rates are specified. | 7% | -$161 | -$1,932 |
Property ManagementThe costs associated with hiring a property manager to handle the day-to-day operations of a rental property. Includes management fees, leasing fes, eviction fees, etc. Calculation:Assumes 8% of gross rental income. | 8% | -$184 | -$2,208 |
Repairs & MaintenanceOngoing costs for routine upkeep and minor fixes needed to keep a property in good working condition. Calculation:Assumes 5% of gross rental income. Varies by property age and condition. | 5% | -$115 | -$1,380 |
Capital ExpensesLarge, infrequent costs for major improvements or replacements, like a new roof, HVAC system, or appliances. Calculation:Assumes 5% of gross rental income. Varies by property age. | 5% | -$115 | -$1,380 |
HOA FeesRegular dues paid to a Homeowners Association for community maintenance, amenities, and management. Similar fees include: Condo Association Fees, Co-op Maintenance Fees, etc. | n/a | n/a | n/a |
Operating ExpensesRecurring costs required to maintain and manage a rental property, including property taxes, insurance, maintenance, repairs, utilities (if paid by the owner), property management fees, and other day-to-day expenses. Calculation:Insurance + Property Taxes + Property Management + Repairs & Maintenance + Capital Expenditures + HOA Fees | 59% | -$1,363 | -$16,350 |
Cash Flow
| Monthly | Yearly | |
|---|---|---|
Net Operating Income (NOI)The income generated from a property after deducting all operating expenses but before deducting mortgage payments, taxes, and capital expenditures. Calculation:Gross Operating Income - Operating Expenses
Net operating income:
| $799 | $9,588 |
Mortgage PaymentThe fixed amount a borrower pays each month to repay a loan. It typically includes principal and interest (P&I) and may also cover property taxes, insurance, HOA fees, and PMI if escrowed. | -$3,863 | -$46,356 |
Cash FlowNet Operating Income (NOI) minus mortgage payments. Calculation:NOI - Mortgage Payments | $3,064 | $36,768 |