$615,000
Investment Summary
- Monthly Cash Flow
- -$1,035
- Cap Rate
- 4.1%
- Cash-on-Cash Return
- -8.8%
- Debt Coverage Ratio
- 0.67
- Internal Rate of Return (5 years)
- -4.5%
Cash Flow
Net Operating Income (NOI) minus mortgage payments.
Calculation:
NOI - Mortgage Payments
Cap Rate (Market Value)
Capitalization Rate is a rate of return that compares the yearly Net Operating Income (NOI) to the market value.
Calculation:
NOI / Market Value
Cash-on-Cash Return (CoC)
Annual Cash Flow / Cash Invested
Calculation:
Annual cash flow divided by initial cash invested.
Debt Coverage Ratio (DCR)
Net Operating Income (NOI) divided by total debt payments.
Calculation:
NOI / Total Debt Payments
Internal Rate of Return (IRR)
A metric for assessing profitability over time. IRR is the discount rate at which the net present value (NPV) of all future cash flows (positive and negative) from an investment equals zero — including both periodic cash flow (such as rent) and a projected sale at the end of the holding period. It represents the expected annualized return, accounting for income, expenses, and the recovery of capital through a future sale.
Property Description
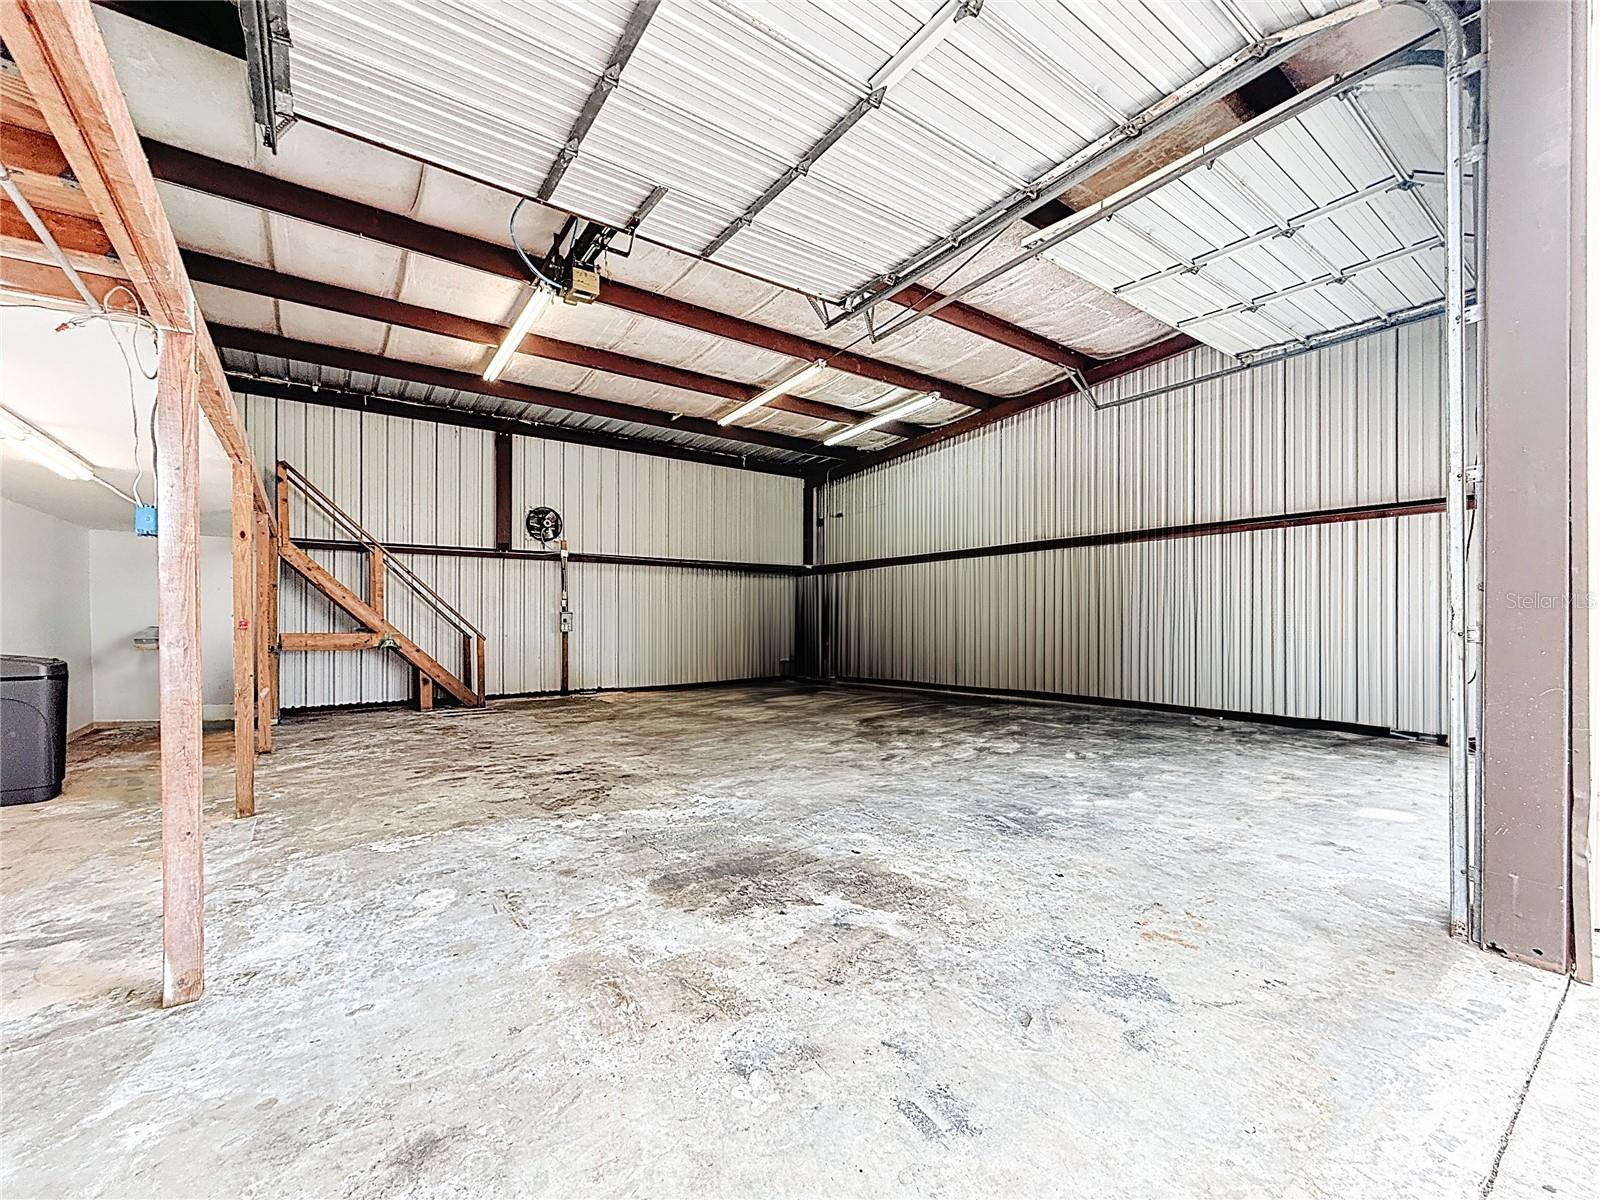
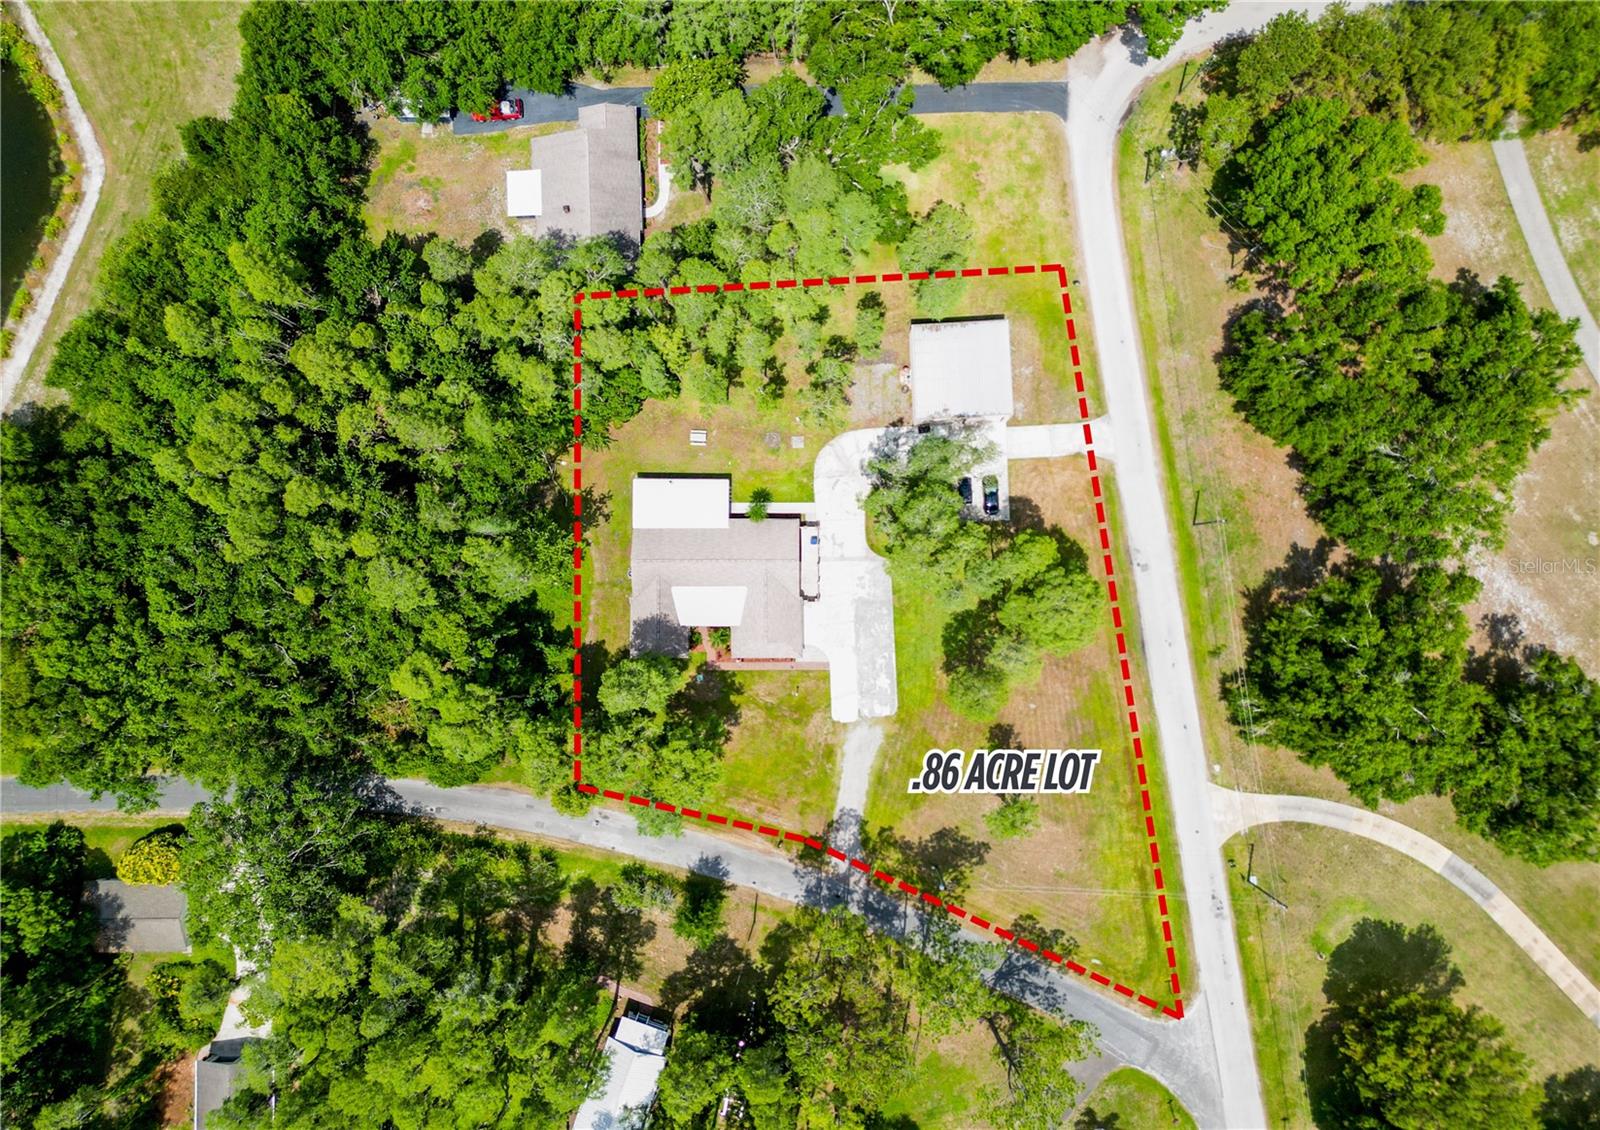
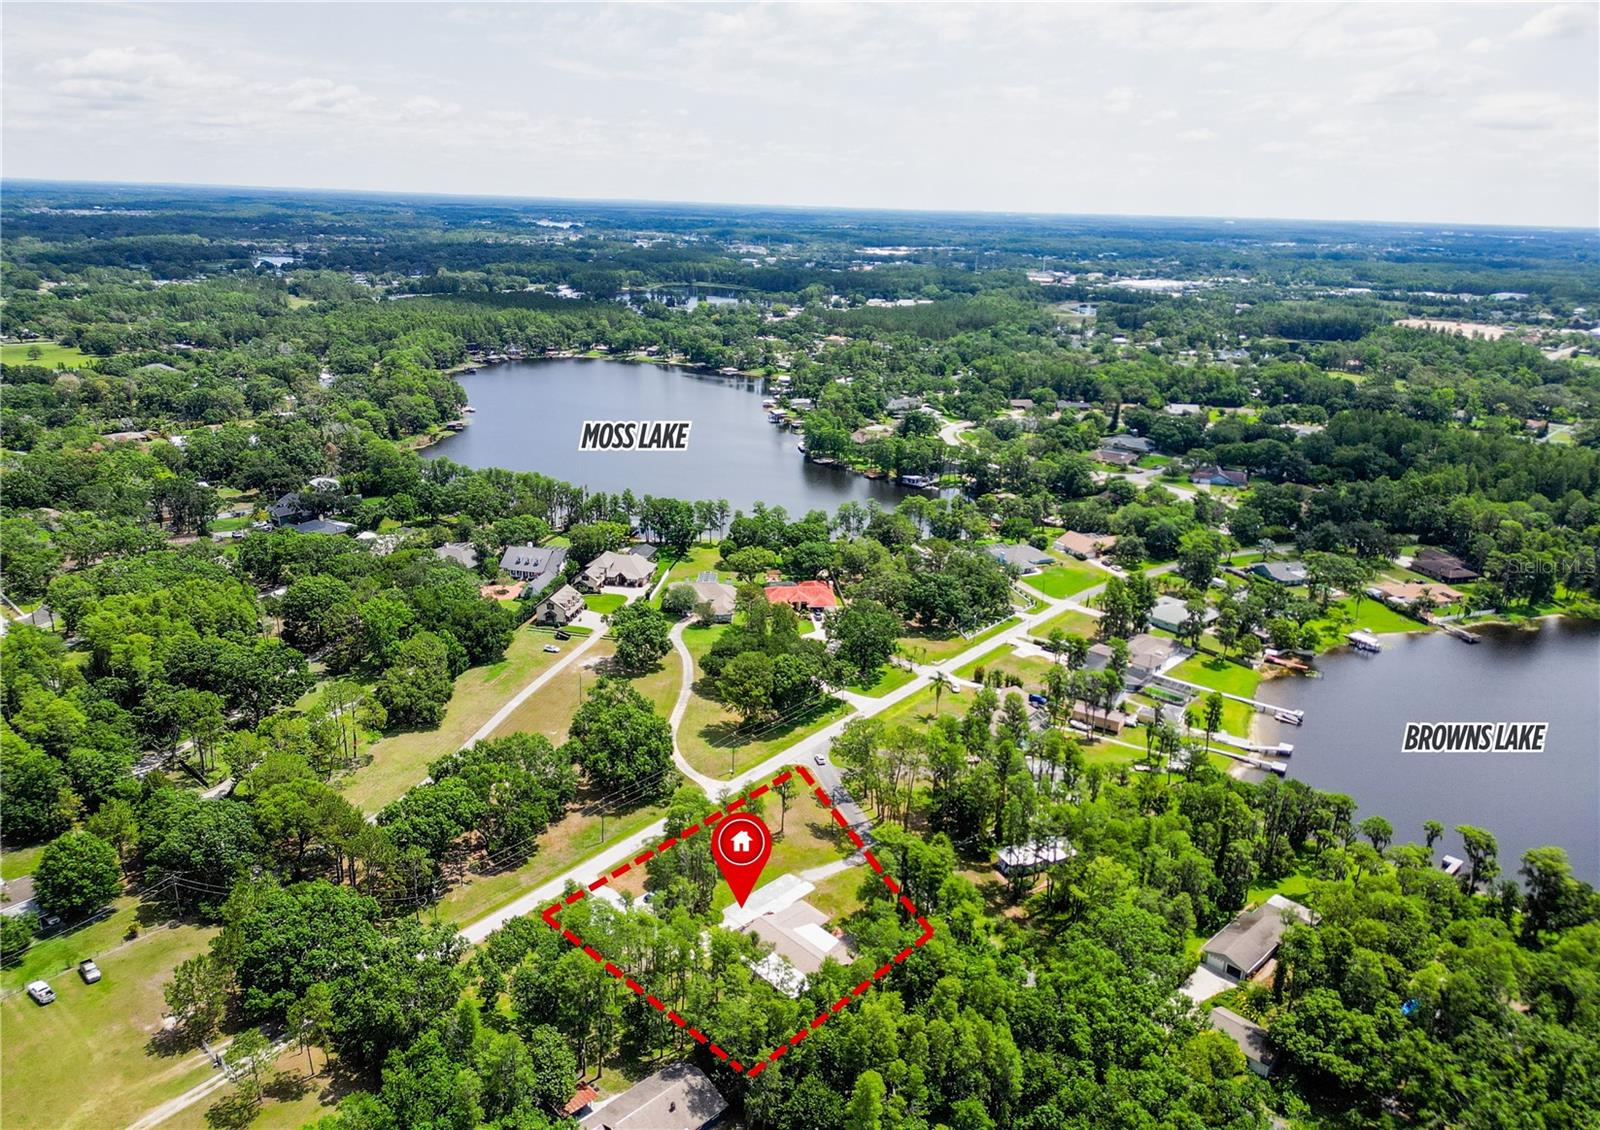
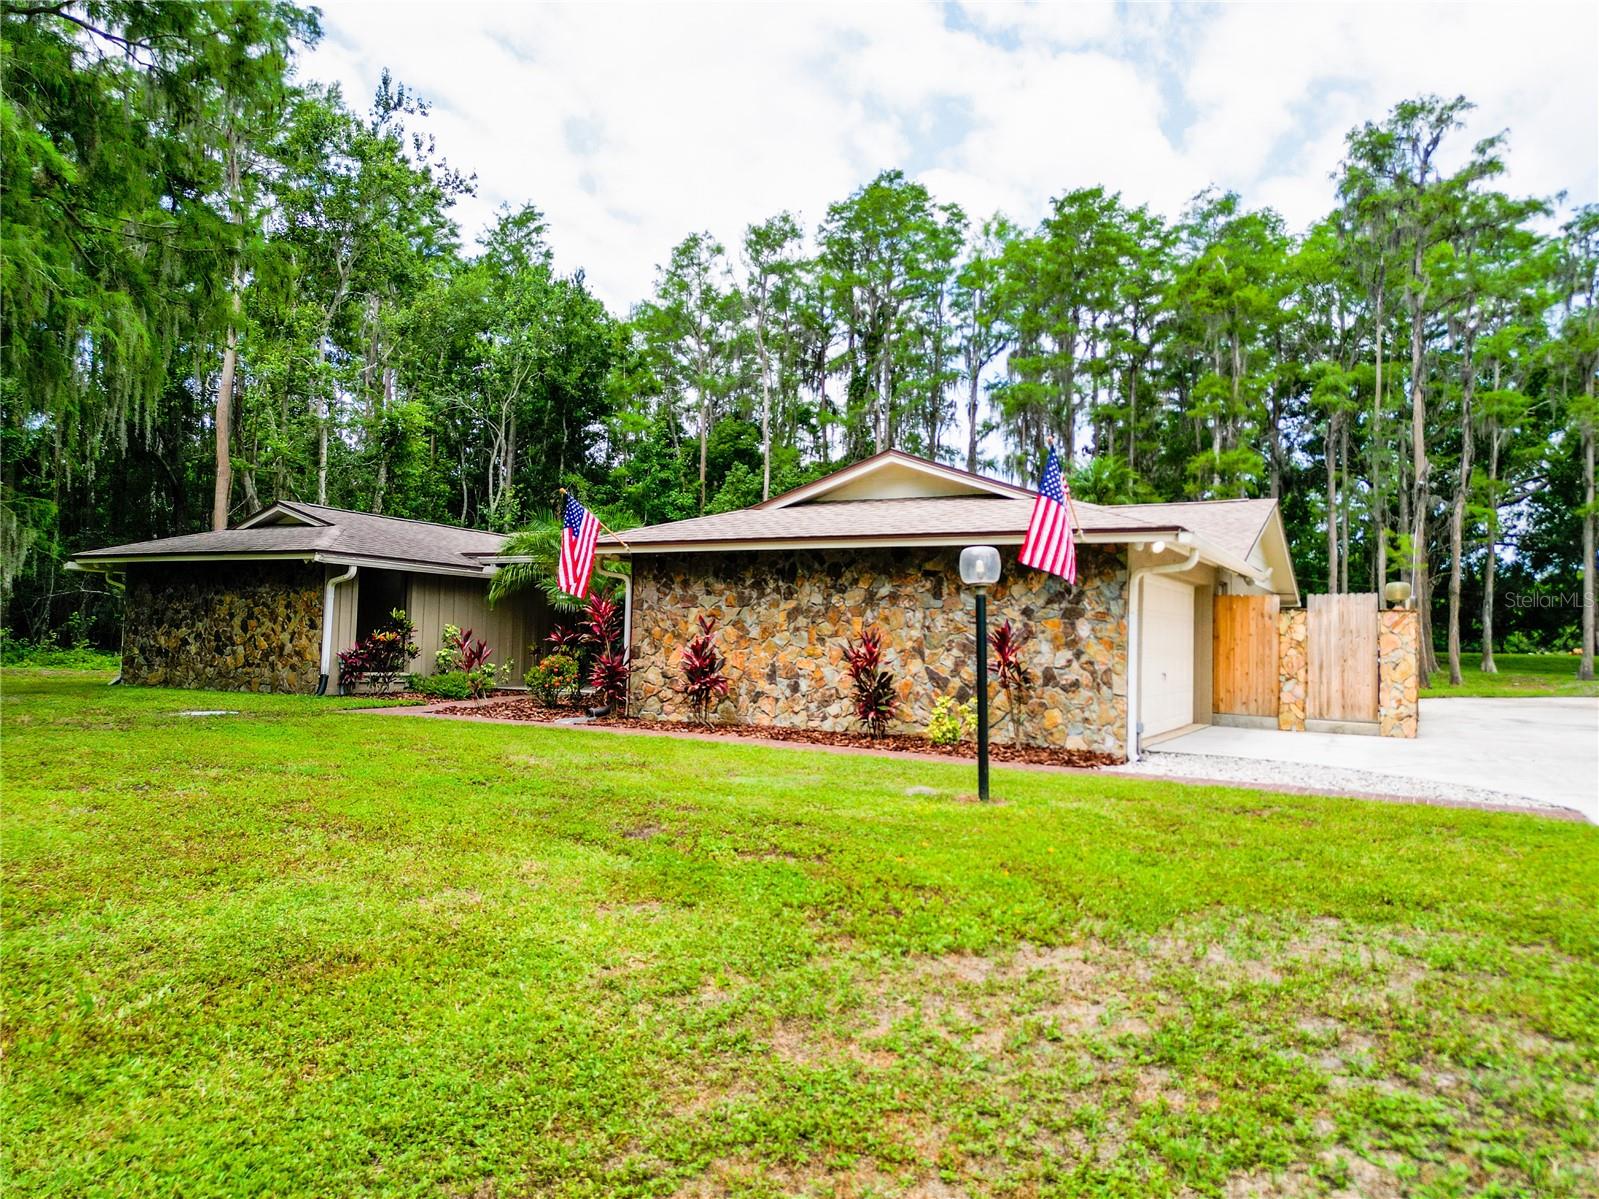
One or more photo(s) has been virtually staged. Welcome to the Ultimate Big Garage Dream Home in the Highly Sought-After Holly Lake Estates, Lutz! This exceptional, updated 1-story ranch-style home sits on an expansive .86-acre wooded lot, offering not just modern updates and timeless charm, but also a massive garage setup that’s a car enthusiast’s paradise. Step into the 1,908 sq ft main home, thoughtfully updated with brand-new ceramic tile and luxury vinyl plank flooring, all-new doors and hardware, and all-new can lights and ceiling fans throughout. The completely renovated primary bathroom features a stunning shower enclosure with rain fixtures, offering a spa-like retreat after a day in the garage. The renovated and bright laundry room features a sink, making everyday chores a breeze. The kitchen is a chef’s delight with shaker cabinets, granite countertops, a subway tile backsplash, a breakfast bar, a walk-in pantry, and a full suite of stainless-steel appliances. Sliding glass doors lead to a glass-enclosed Florida room with a wet bar and warm cedar-accented walls—and if you open the vents, the home expands to a generous 3,133 sq ft of climate-controlled space. Fill the room with potted plants, hanging baskets, and a vertical garden wall to create an indoor jungle. The glass enclosure provides great natural light for plant growth. Let’s talk about the 35x35x14 detached steel beam garage! Featuring two 14x12 overhead doors, with an over 12-foot ceiling height (even with the doors open!), this garage leaves plenty of clearance for installing a 2-post or 4-post lift. One door comes equipped with a powered opener, and the other has an opener ready to be installed. The building is powered by a 200-amp service panel with a 220-volt plug, perfect for welding or heavy-duty equipment. To help keep things cool, the ceiling is insulated against Florida’s sun, and there’s a stairway leading up to a 6.5x35 loft with built-in shelving for extra storage or a workshop. There’s also a 2 car attached garage with epoxy floors to keep your daily drivers in and to keep you dry during those Florida down pours. Outside, the U-shaped driveway with parking pad offers plenty of space for visitors and vehicles. The side yard features a fenced area with an outdoor shower, hot tub hookups, and a French drain system with a lift station for added convenience and peace of mind. Recent upgrades include a newer roof and A/C (2021), a new water softener (2024), and a septic system replacement (2019). Best of all, enjoy NO HOA and NO CDD, while being just minutes from major roads, shopping, dining, and medical facilities. This is more than just a home—it’s a lifestyle, designed for those who love their cars, boats, or RVs and need a space that matches their passion. Don’t wait—schedule your private tour today and make this Holly Lake Estates gem yours! See Interactive Matterport Walkthrough here --> https://my.matterport.com/show/?m=qorCZAo16gQ&brand=0&mls=1&
Build Your Team
Quickly find investor-friendly professionals who can help you succeed in real estate investing at any stage of the investing journey.


Agents
Match with investor-friendly agents who can help you find, analyze, and close your next deal


Lenders
Get the best funding…find investor-friendly lenders who specialize in your deal strategy


Property Managers
Transition to passive investing. Find a trusted property management partnership that lasts.


Tax Pros & Accountants
Taxes and financial reporting made easy—find experts to create tax savings strategies, file taxes, and more
Location
Property Details
Parking
- Description: Garage
- Details: Boat, Circular Driveway, Driveway, Garage Door Opener, Golf Cart Garage, Oversized, RV Carport, RV Garage, RV Access/Parking, Workshop in Garage, Attached
- Garage Spaces: 6
- Spaces Total: 0
Bedroom Information
- # of Bedrooms: 3
Bathroom Information
- # of Baths (Full): 2
- # of Baths (Total): 2.0
Interior Features
- # of Rooms: 6
- # of Stories: 1
Exterior Features
- Exterior Walls Materials: Concrete Block
- Foundation: Slab
- Roof Type: Gable
- Roof Material: Shingle
Land Information
- Land Use: Residential
- Land Use Subtype: Single Family Residential
Lot Information
- Parcel ID: 35261800100000000B0
- Lot Size: 37462 sqft
Property Information
- Property Type: Single Family Residence
- Style: Florida, Patio Home, Ranch, Traditional
- Year Built: 1975
Tax Information
- Annual Tax: $3,598
Utilities
- Water & Sewer: Private, Well
- Heating: Central, Electric
- Cooling: Central Air
Location
- County: Pasco
Listing Details
Investment Summary
- Monthly Cash Flow
- -$1,035
- Cap Rate
- 4.1%
- Cash-on-Cash Return
- -8.8%
- Debt Coverage Ratio
- 0.67
- Internal Rate of Return (5 years)
- -4.5%
Cash Flow
Net Operating Income (NOI) minus mortgage payments.
Calculation:
NOI - Mortgage Payments
Cap Rate (Market Value)
Capitalization Rate is a rate of return that compares the yearly Net Operating Income (NOI) to the market value.
Calculation:
NOI / Market Value
Cash-on-Cash Return (CoC)
Annual Cash Flow / Cash Invested
Calculation:
Annual cash flow divided by initial cash invested.
Debt Coverage Ratio (DCR)
Net Operating Income (NOI) divided by total debt payments.
Calculation:
NOI / Total Debt Payments
Internal Rate of Return (IRR)
A metric for assessing profitability over time. IRR is the discount rate at which the net present value (NPV) of all future cash flows (positive and negative) from an investment equals zero — including both periodic cash flow (such as rent) and a projected sale at the end of the holding period. It represents the expected annualized return, accounting for income, expenses, and the recovery of capital through a future sale.
Purchase Details
Purchase PriceThe price paid for the property. Purchase price:
| $615,000 |
|---|---|
Amount FinancedThe amount of the purchase financed through a loan. Amount financed:
| -$492,000 |
Down paymentThe initial payment made towards the purchase. Down payment:
| $123,000 |
Closing CostsFees and expenses associated with purchasing a property, typically ranging from 2% to 5% of the home’s purchase price, paid at the end of a home purchase to cover services like lending, title transfer, and taxes. Closing costs:
| $18,450 |
Rehab CostsCosts incurred to repair or improve the property, including: roof, flooring, exterior siding, kitchen, exterior paint, bathrooms, etc. Rehab costs:
| $0 |
Initial Cash InvestedThe total initial cash invested in the property. Calculation:Down payment + Buying costs + Rehab costs Initial cash invested:
| $141,450 |
Square Feet (SQFT)The total square footage of the property. Square feet:
| 1,908 |
Cost Per Square FootCost per square foot of the property. Calculation:Purchase Price / Square Feet Cost per square foot:
| $322 |
Monthly Rent Per Square FootMonthly rent divided by the number of square feet. This ratio helps investors compare rental income efficiency across properties, markets, and unit sizes Calculation:Monthly Rent / Square Feet Monthly rent per square foot:
| $1.83 |
Financing Details
Loan AmountThe total sum of money borrowed from a lender to finance a property purchase. Calculation:Purchase Price - Down Payment
Loan amount:
| $492,000 |
|---|---|
Loan to Value Ratio (LTV)Loan amount divided by the market value of the property. Calculation:Loan Amount / Market Value
Loan to value ratio:
| 80.0% |
Loan TypeThe type of loan (e.g., fixed, adjustable).
Loan type:
| Amortizing |
TermThe loan repayment period in years.
Term:
| 30 years |
Interest RateThe percentage a lender charges on the borrowed amount of a loan, determining the cost of borrowing money.
Interest rate:
| 6.625% |
Principal & Interest (PI)The principal is the portion of the loan payment that reduces the loan balance. The interest is the lender's charge for borrowing money. Calculation:(P * r * (1 + r) ** n) / ((1 + r) ** n - 1) Where:
P = Loan amount (principal)
Principal & interest:
| $3,150 |
Property TaxesAnnual taxes levied by local governments on real estate properties. These taxes fund public services like schools, roads, and emergency services.
Property tax:
| $300 |
InsuranceThe costs for insurance coverage to protect against financial losses due to risks like fire, natural disasters, theft, liability, or tenant-related damages. Calculation:Assumes 7% of gross rental income, unless insurance rates are specified.
Insurance:
| $245 |
Private Mortgage Insurance (PMI)A fee that borrowers pay when they take out a conventional loan with a loan-to-value (LTV) ratio above 80%.
Private mortgage insurance (PMI):
| $0 |
Monthly PaymentThe fixed amount a borrower pays each month to repay a loan. It typically includes principal and interest (P&I) and may also cover property taxes, insurance, HOA fees, and PMI if escrowed. Monthly payment:
| $3,695 |
Operating Income
| % Rent | Monthly | Yearly | |
|---|---|---|---|
Gross RentThe total rental income received from tenants before deducting any expenses. Includes base rent, late fees, pet fees, parking fees, and other recurring charges.
Gross rent:
| $3,500 | $42,000 | |
Vacancy LossExpected loss of rent due to vacancies.
Vacancy loss:
(6%)
| 6% | -$210 | -$2,520 |
Operating IncomeGross rental income minus vacancy loss. Calculation:Gross rent - Vacancy loss
Operating income:
| $3,290 | $39,480 |
Operating Expenses
| % Rent | Monthly | Yearly | |
|---|---|---|---|
Property TaxesAnnual taxes levied by local governments on real estate properties. These taxes fund public services like schools, roads, and emergency services. | 9% | -$300 | -$3,598 |
InsuranceThe costs for insurance coverage to protect against financial losses due to risks like fire, natural disasters, theft, liability, or tenant-related damages. Calculation:Assumes 7% of gross rental income, unless insurance rates are specified. | 7% | -$245 | -$2,940 |
Property ManagementThe costs associated with hiring a property manager to handle the day-to-day operations of a rental property. Includes management fees, leasing fes, eviction fees, etc. Calculation:Assumes 8% of gross rental income. | 8% | -$280 | -$3,360 |
Repairs & MaintenanceOngoing costs for routine upkeep and minor fixes needed to keep a property in good working condition. Calculation:Assumes 5% of gross rental income. Varies by property age and condition. | 5% | -$175 | -$2,100 |
Capital ExpensesLarge, infrequent costs for major improvements or replacements, like a new roof, HVAC system, or appliances. Calculation:Assumes 5% of gross rental income. Varies by property age. | 5% | -$175 | -$2,100 |
HOA FeesRegular dues paid to a Homeowners Association for community maintenance, amenities, and management. Similar fees include: Condo Association Fees, Co-op Maintenance Fees, etc. | n/a | n/a | n/a |
Operating ExpensesRecurring costs required to maintain and manage a rental property, including property taxes, insurance, maintenance, repairs, utilities (if paid by the owner), property management fees, and other day-to-day expenses. Calculation:Insurance + Property Taxes + Property Management + Repairs & Maintenance + Capital Expenditures + HOA Fees | 34% | -$1,175 | -$14,098 |
Cash Flow
| Monthly | Yearly | |
|---|---|---|
Net Operating Income (NOI)The income generated from a property after deducting all operating expenses but before deducting mortgage payments, taxes, and capital expenditures. Calculation:Gross Operating Income - Operating Expenses
Net operating income:
| $2,115 | $25,380 |
Mortgage PaymentThe fixed amount a borrower pays each month to repay a loan. It typically includes principal and interest (P&I) and may also cover property taxes, insurance, HOA fees, and PMI if escrowed. | -$3,150 | -$37,800 |
Cash FlowNet Operating Income (NOI) minus mortgage payments. Calculation:NOI - Mortgage Payments | $1,035 | $12,420 |