
$3,500,000
Investment Summary
- Monthly Cash Flow
- -$13,641
- Cap Rate
- 1.5%
- Cash-on-Cash Return
- -20.3%
- Debt Coverage Ratio
- 0.24
- Internal Rate of Return (5 years)
- -15.6%
Cash Flow
Net Operating Income (NOI) minus mortgage payments.
Calculation:
NOI - Mortgage Payments
Cap Rate (Market Value)
Capitalization Rate is a rate of return that compares the yearly Net Operating Income (NOI) to the market value.
Calculation:
NOI / Market Value
Cash-on-Cash Return (CoC)
Annual Cash Flow / Cash Invested
Calculation:
Annual cash flow divided by initial cash invested.
Debt Coverage Ratio (DCR)
Net Operating Income (NOI) divided by total debt payments.
Calculation:
NOI / Total Debt Payments
Internal Rate of Return (IRR)
A metric for assessing profitability over time. IRR is the discount rate at which the net present value (NPV) of all future cash flows (positive and negative) from an investment equals zero — including both periodic cash flow (such as rent) and a projected sale at the end of the holding period. It represents the expected annualized return, accounting for income, expenses, and the recovery of capital through a future sale.
Property Description
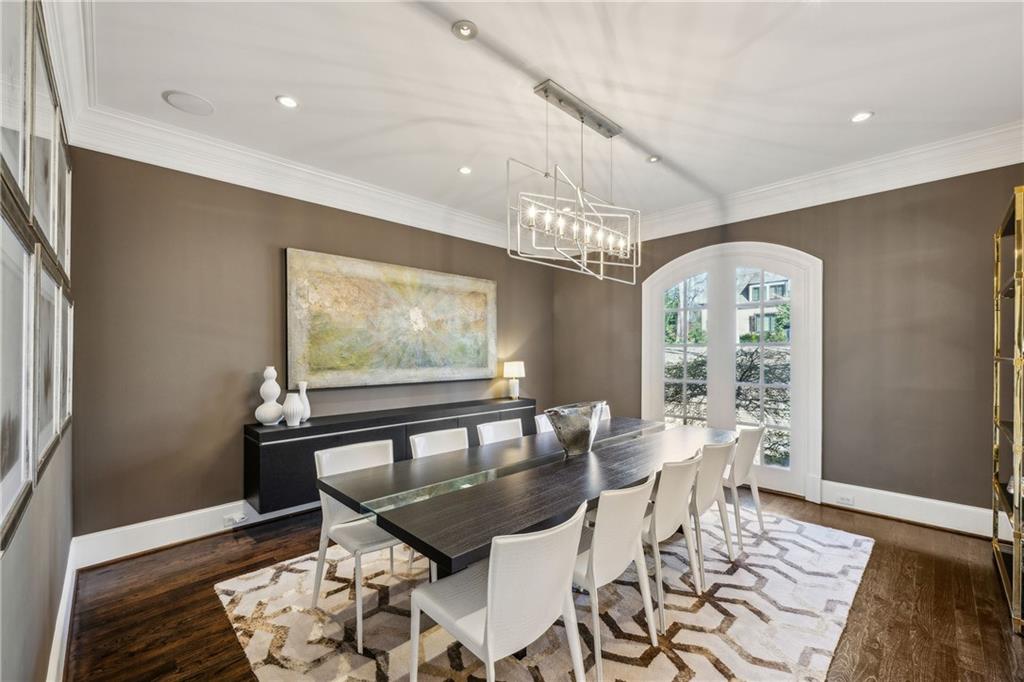
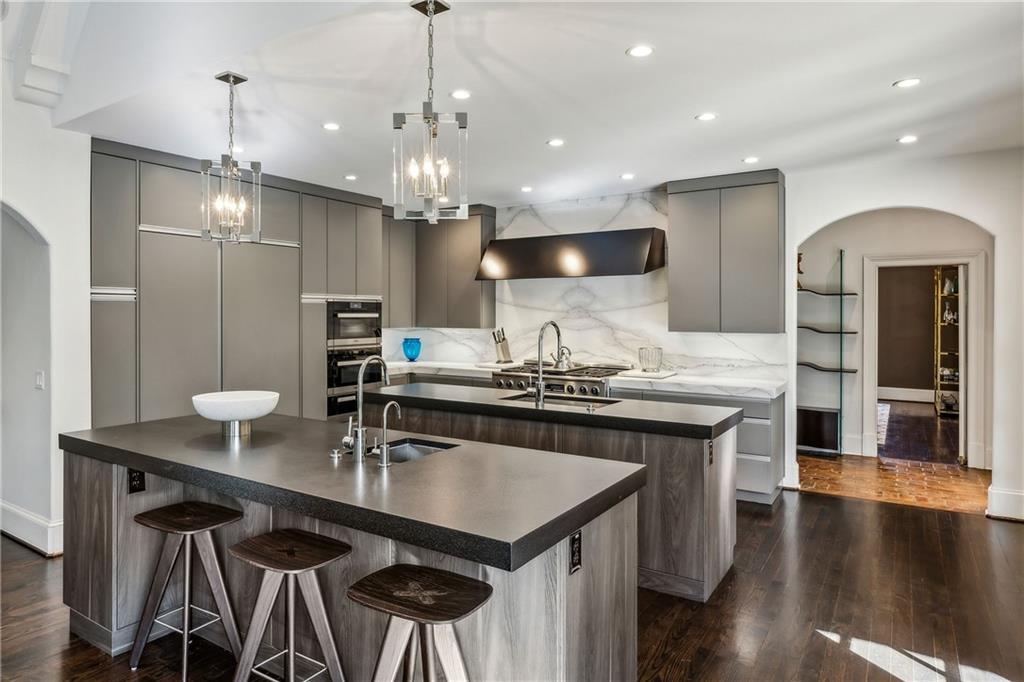
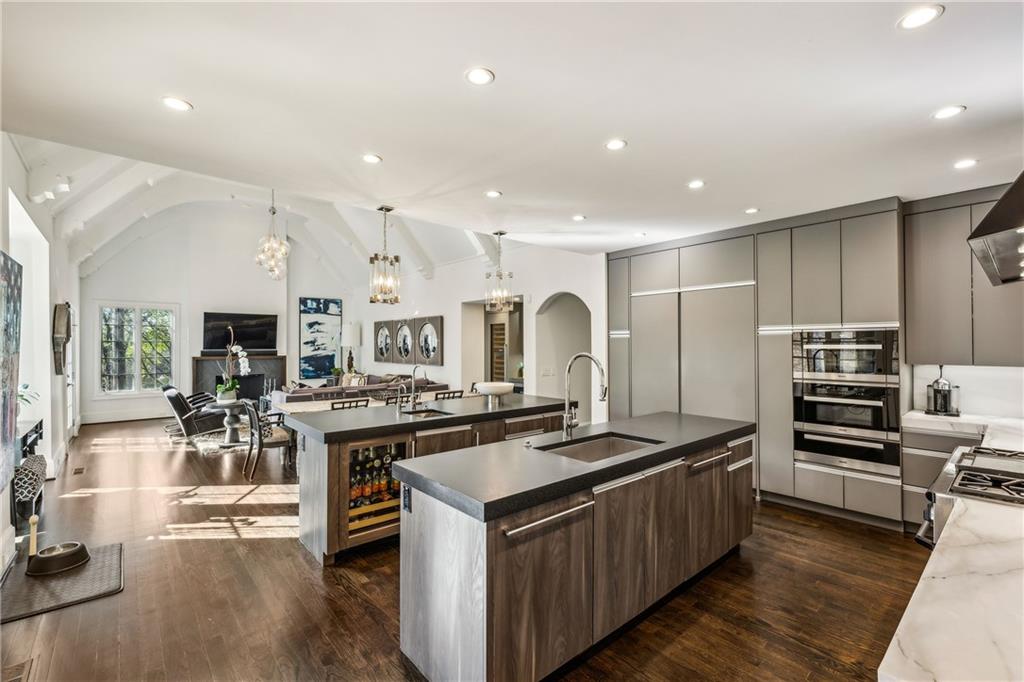
Tucked away on a tranquil cul-de-sac in a premier Sandy Springs location, this sophisticated estate sits on a beautifully landscaped private 1-acre lot. Thoughtfully reimagined from top to bottom, this timeless, French Country exterior exudes luxury, comfort, and seamless indoor-outdoor living, offering a perfect balance for both everyday life and grand-scale entertaining. A true foyer entry welcomes you into the stunning main level, where soaring 10-foot ceilings and elegant design set the tone. The vaulted fireside family room creates a warm and inviting atmosphere, while the formal dining room—with seating for 12+—sets the stage for unforgettable gatherings. The heart of the home is the showstopping chef’s kitchen, fully redesigned with custom cabinetry, dual leathered granite islands, marble countertops and backsplash, and top-tier appliances from Miele, Dacor, Bosch, and SubZero. A sunlit breakfast room and cozy keeping room enhance the space, complemented by a wet bar, mudroom, and direct access to the oversized 3-car garage. The main-level primary suite is a serene retreat, featuring a dramatic picture window overlooking the lush backyard and spa, and a luxurious Italian bath. Indulge in designer Porcelanosa vanities, a freestanding soaking tub, an oversized double-head, marble-tiled shower, and a custom walk-in dressing room, newly completed in 2023 with floor-to-ceiling custom cabinetry. Upstairs, two distinct wings offer both privacy and flexibility, boasting four spacious bedrooms—each with en-suite baths and custom closets—as well as versatile bonus room spaces ideal for playrooms, offices, labs or lounges. The finished terrace level is designed for both relaxation and recreation, complete with a second full kitchen featuring SubZero appliances, a state-of-the-art digital media room with THX projector and new theater seating, a fitness studio, custom home office, salon with built-ins, guest accommodations, and abundant storage throughout. Step outside to your own private resort-style oasis. Enjoy a covered porch with a fireplace, a charming stone courtyard with a fountain, an expansive patio, and lush landscaping throughout. The heated pool—with a removable child safety fence—and hot tub offer the perfect setting for year-round enjoyment. Additional highlights include a Crestron whole-home automation system (updated in 2019), designer lighting throughout, invisible pet fencing, a 3-car garage with built-in cabinetry and non-slip flooring, an extra parking pad for 3+ vehicles, and a circular driveway. The grounds are fully irrigated, featuring seasonal blooms and mature trees that enhance the home's natural beauty and privacy. This extraordinary estate offers impeccable design, exceptional functionality, and unmatched privacy—just minutes from top-rated schools, parks, medical centers, shopping, and dining.
Build Your Team
Quickly find investor-friendly professionals who can help you succeed in real estate investing at any stage of the investing journey.


Agents
Match with investor-friendly agents who can help you find, analyze, and close your next deal


Lenders
Get the best funding…find investor-friendly lenders who specialize in your deal strategy


Property Managers
Transition to passive investing. Find a trusted property management partnership that lasts.


Tax Pros & Accountants
Taxes and financial reporting made easy—find experts to create tax savings strategies, file taxes, and more
Location
Property Details
Parking
- Description: Attached, Garage, Garage Door Opener, Kitchen Level, Level Driveway
- Details: Attached, Driveway, Garage, Garage Faces Side, Kitchen Level, Parking Pad
- Garage Spaces: 3
- Spaces Total: 0
Bedroom Information
- # of Bedrooms: 7
Bathroom Information
- # of Baths (Full): 7
- # of Baths (Total): 10.0
Interior Features
- # of Rooms: 12
- # of Stories: 2
- Basement: Yes
- Basement Description: Daylight, Exterior Entry, Finished, Full, Interior Entry, Walk-Out Access
- Fireplace: Yes
Exterior Features
- Exterior Walls Materials: Rock, Stone
- Foundation: None
- Roof Material: Composition, Shingle
- Pool: Yes
HOA
- Has HOA: Yes
- HOA Fee: $500/semi-annually
Land Information
- Land Use: Residential
- Land Use Subtype: Single Family Residential
Lot Information
- Parcel ID: 17001500040268
- Lot Size: 0 sqft
Property Information
- Property Type: Single Family Residence
- Style: European, Traditional
- Year Built: 2000
Tax Information
- Annual Tax: $19,580
Utilities
- Water & Sewer: Public
- Heating: Central, Natural Gas, Zoned
- Cooling: Ceiling Fan(s), Central Air, Zoned
Location
- County: Fulton
Listing Details
Investment Summary
- Monthly Cash Flow
- -$13,641
- Cap Rate
- 1.5%
- Cash-on-Cash Return
- -20.3%
- Debt Coverage Ratio
- 0.24
- Internal Rate of Return (5 years)
- -15.6%
Cash Flow
Net Operating Income (NOI) minus mortgage payments.
Calculation:
NOI - Mortgage Payments
Cap Rate (Market Value)
Capitalization Rate is a rate of return that compares the yearly Net Operating Income (NOI) to the market value.
Calculation:
NOI / Market Value
Cash-on-Cash Return (CoC)
Annual Cash Flow / Cash Invested
Calculation:
Annual cash flow divided by initial cash invested.
Debt Coverage Ratio (DCR)
Net Operating Income (NOI) divided by total debt payments.
Calculation:
NOI / Total Debt Payments
Internal Rate of Return (IRR)
A metric for assessing profitability over time. IRR is the discount rate at which the net present value (NPV) of all future cash flows (positive and negative) from an investment equals zero — including both periodic cash flow (such as rent) and a projected sale at the end of the holding period. It represents the expected annualized return, accounting for income, expenses, and the recovery of capital through a future sale.
Purchase Details
Purchase PriceThe price paid for the property. Purchase price:
| $3,500,000 |
|---|---|
Amount FinancedThe amount of the purchase financed through a loan. Amount financed:
| -$2,800,000 |
Down paymentThe initial payment made towards the purchase. Down payment:
| $700,000 |
Closing CostsFees and expenses associated with purchasing a property, typically ranging from 2% to 5% of the home’s purchase price, paid at the end of a home purchase to cover services like lending, title transfer, and taxes. Closing costs:
| $105,000 |
Rehab CostsCosts incurred to repair or improve the property, including: roof, flooring, exterior siding, kitchen, exterior paint, bathrooms, etc. Rehab costs:
| $0 |
Initial Cash InvestedThe total initial cash invested in the property. Calculation:Down payment + Buying costs + Rehab costs Initial cash invested:
| $805,000 |
Square Feet (SQFT)The total square footage of the property. Square feet:
| 9,325 |
Cost Per Square FootCost per square foot of the property. Calculation:Purchase Price / Square Feet Cost per square foot:
| $375 |
Monthly Rent Per Square FootMonthly rent divided by the number of square feet. This ratio helps investors compare rental income efficiency across properties, markets, and unit sizes Calculation:Monthly Rent / Square Feet Monthly rent per square foot:
| $0.93 |
Financing Details
Loan AmountThe total sum of money borrowed from a lender to finance a property purchase. Calculation:Purchase Price - Down Payment
Loan amount:
| $2,800,000 |
|---|---|
Loan to Value Ratio (LTV)Loan amount divided by the market value of the property. Calculation:Loan Amount / Market Value
Loan to value ratio:
| 80.0% |
Loan TypeThe type of loan (e.g., fixed, adjustable).
Loan type:
| Amortizing |
TermThe loan repayment period in years.
Term:
| 30 years |
Interest RateThe percentage a lender charges on the borrowed amount of a loan, determining the cost of borrowing money.
Interest rate:
| 6.625% |
Principal & Interest (PI)The principal is the portion of the loan payment that reduces the loan balance. The interest is the lender's charge for borrowing money. Calculation:(P * r * (1 + r) ** n) / ((1 + r) ** n - 1) Where:
P = Loan amount (principal)
Principal & interest:
| $17,929 |
Property TaxesAnnual taxes levied by local governments on real estate properties. These taxes fund public services like schools, roads, and emergency services.
Property tax:
| $1,632 |
InsuranceThe costs for insurance coverage to protect against financial losses due to risks like fire, natural disasters, theft, liability, or tenant-related damages. Calculation:Assumes 7% of gross rental income, unless insurance rates are specified.
Insurance:
| $609 |
Private Mortgage Insurance (PMI)A fee that borrowers pay when they take out a conventional loan with a loan-to-value (LTV) ratio above 80%.
Private mortgage insurance (PMI):
| $0 |
Monthly PaymentThe fixed amount a borrower pays each month to repay a loan. It typically includes principal and interest (P&I) and may also cover property taxes, insurance, HOA fees, and PMI if escrowed. Monthly payment:
| $20,170 |
Operating Income
| % Rent | Monthly | Yearly | |
|---|---|---|---|
Gross RentThe total rental income received from tenants before deducting any expenses. Includes base rent, late fees, pet fees, parking fees, and other recurring charges.
Gross rent:
| $8,700 | $104,400 | |
Vacancy LossExpected loss of rent due to vacancies.
Vacancy loss:
(6%)
| 6% | -$522 | -$6,264 |
Operating IncomeGross rental income minus vacancy loss. Calculation:Gross rent - Vacancy loss
Operating income:
| $8,178 | $98,136 |
Operating Expenses
| % Rent | Monthly | Yearly | |
|---|---|---|---|
Property TaxesAnnual taxes levied by local governments on real estate properties. These taxes fund public services like schools, roads, and emergency services. | 19% | -$1,632 | -$19,580 |
InsuranceThe costs for insurance coverage to protect against financial losses due to risks like fire, natural disasters, theft, liability, or tenant-related damages. Calculation:Assumes 7% of gross rental income, unless insurance rates are specified. | 7% | -$609 | -$7,308 |
Property ManagementThe costs associated with hiring a property manager to handle the day-to-day operations of a rental property. Includes management fees, leasing fes, eviction fees, etc. Calculation:Assumes 8% of gross rental income. | 8% | -$696 | -$8,352 |
Repairs & MaintenanceOngoing costs for routine upkeep and minor fixes needed to keep a property in good working condition. Calculation:Assumes 5% of gross rental income. Varies by property age and condition. | 5% | -$435 | -$5,220 |
Capital ExpensesLarge, infrequent costs for major improvements or replacements, like a new roof, HVAC system, or appliances. Calculation:Assumes 5% of gross rental income. Varies by property age. | 5% | -$435 | -$5,220 |
HOA FeesRegular dues paid to a Homeowners Association for community maintenance, amenities, and management. Similar fees include: Condo Association Fees, Co-op Maintenance Fees, etc. | 1% | -$83 | -$996 |
Operating ExpensesRecurring costs required to maintain and manage a rental property, including property taxes, insurance, maintenance, repairs, utilities (if paid by the owner), property management fees, and other day-to-day expenses. Calculation:Insurance + Property Taxes + Property Management + Repairs & Maintenance + Capital Expenditures + HOA Fees | 45% | -$3,890 | -$46,676 |
Cash Flow
| Monthly | Yearly | |
|---|---|---|
Net Operating Income (NOI)The income generated from a property after deducting all operating expenses but before deducting mortgage payments, taxes, and capital expenditures. Calculation:Gross Operating Income - Operating Expenses
Net operating income:
| $4,288 | $51,456 |
Mortgage PaymentThe fixed amount a borrower pays each month to repay a loan. It typically includes principal and interest (P&I) and may also cover property taxes, insurance, HOA fees, and PMI if escrowed. | -$17,929 | -$215,148 |
Cash FlowNet Operating Income (NOI) minus mortgage payments. Calculation:NOI - Mortgage Payments | $13,641 | $163,692 |