$11,100,000
Investment Summary
- Monthly Cash Flow
- -$57,418
- Cap Rate
- -0.1%
- Cash-on-Cash Return
- -27.0%
- Debt Coverage Ratio
- -0.01
- Internal Rate of Return (5 years)
- -22.0%
Cash Flow
Net Operating Income (NOI) minus mortgage payments.
Calculation:
NOI - Mortgage Payments
Cap Rate (Market Value)
Capitalization Rate is a rate of return that compares the yearly Net Operating Income (NOI) to the market value.
Calculation:
NOI / Market Value
Cash-on-Cash Return (CoC)
Annual Cash Flow / Cash Invested
Calculation:
Annual cash flow divided by initial cash invested.
Debt Coverage Ratio (DCR)
Net Operating Income (NOI) divided by total debt payments.
Calculation:
NOI / Total Debt Payments
Internal Rate of Return (IRR)
A metric for assessing profitability over time. IRR is the discount rate at which the net present value (NPV) of all future cash flows (positive and negative) from an investment equals zero — including both periodic cash flow (such as rent) and a projected sale at the end of the holding period. It represents the expected annualized return, accounting for income, expenses, and the recovery of capital through a future sale.
Property Description
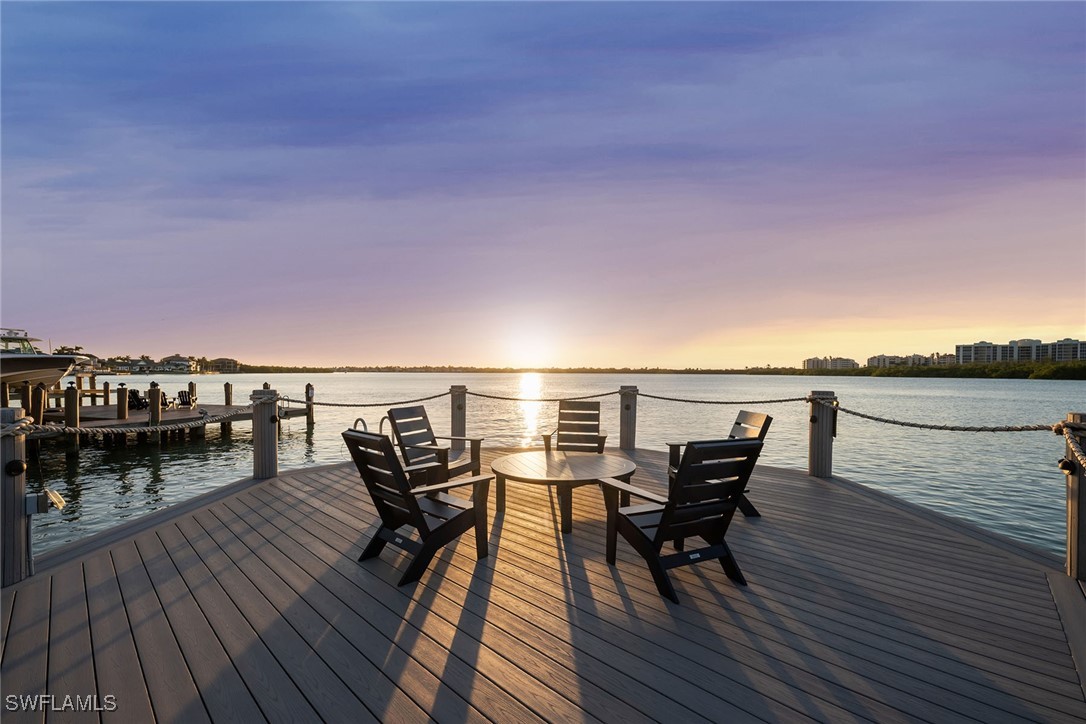
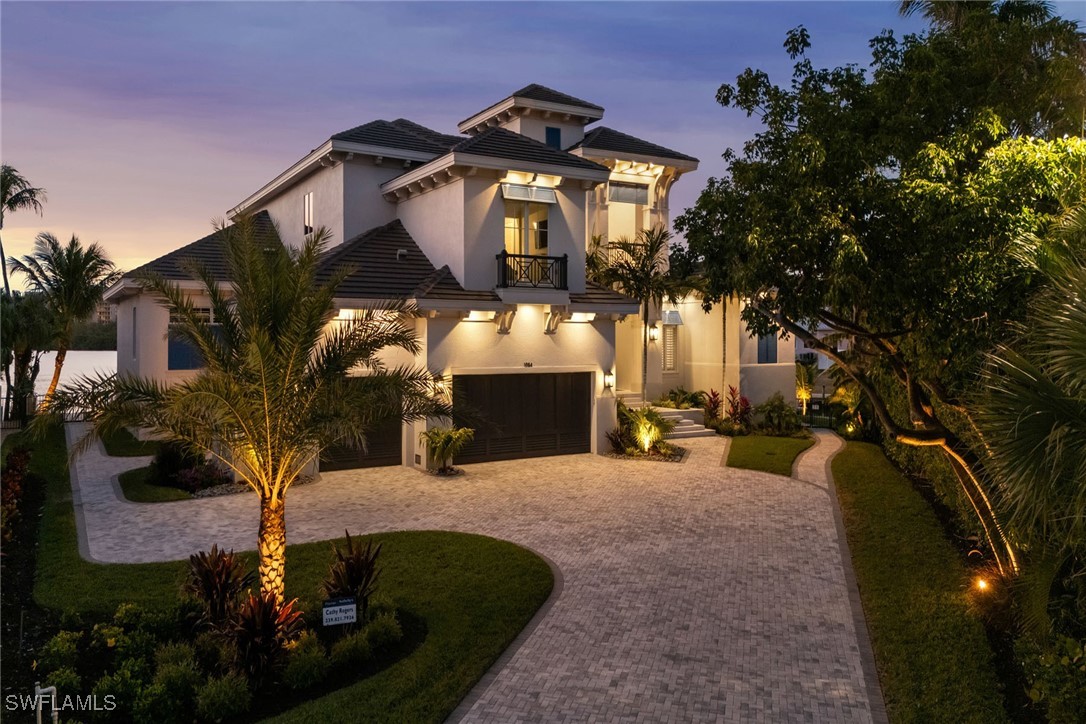
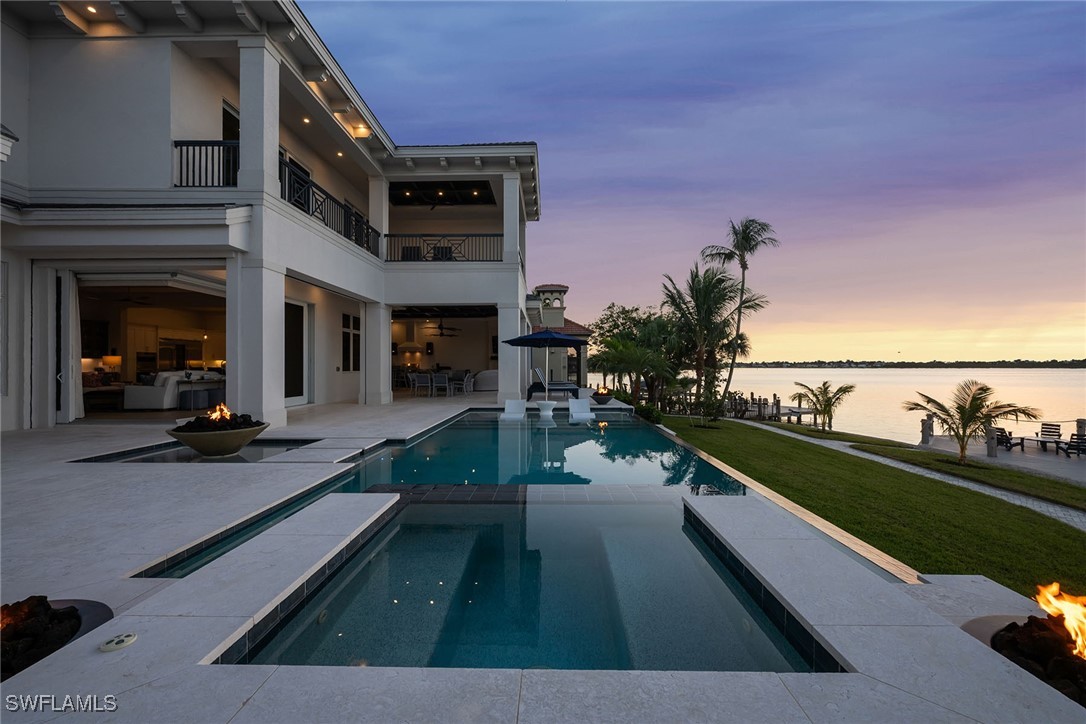
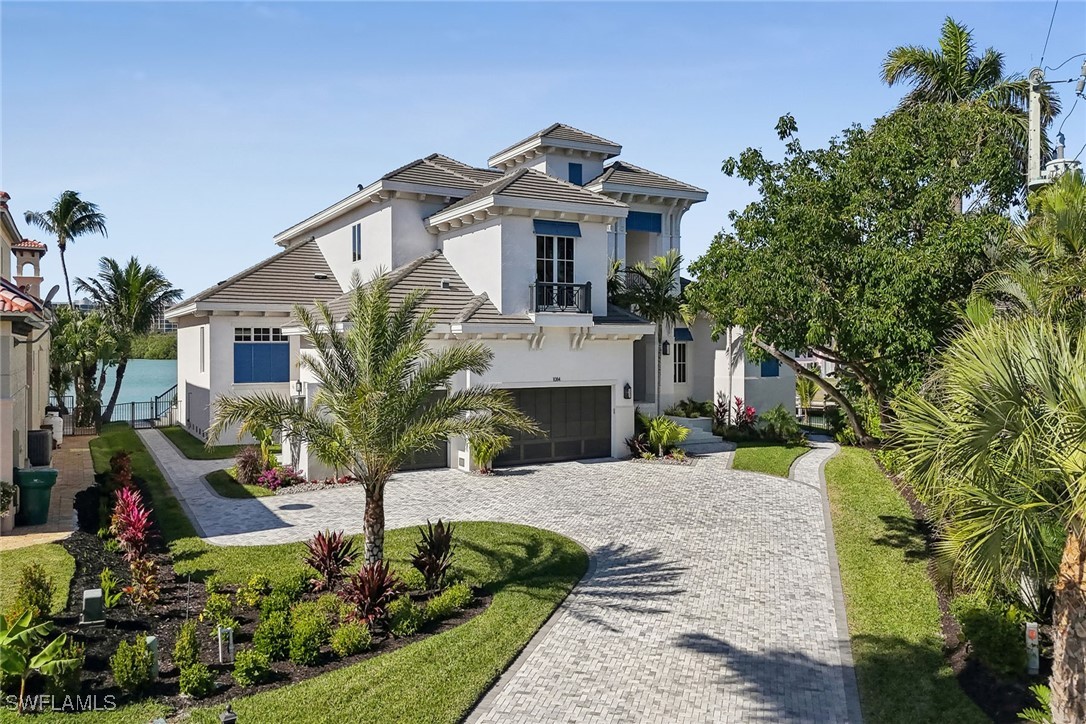
Jaw-dropping, extraordinary waterfront custom estate perfectly situated on one of Marco Island's most coveted tip lots, located on Collier Bay within five minutes of the Gulf! With over 200 feet of direct access seawall, designer finishes, breathtaking views and newly built in 2020, this home sets a new standard for luxury living! Encompassing just under 5,000 square feet of refined air-conditioned living space, a total of 7,200 square feet, this home will wow you from the moment you walk in! Designer finishes and unparalleled craftsmanship flow seamlessly throughout, ensuring this home captivates even the most discerning buyer! The moment you enter, the striking custom European white oak staircase and soaring designer ceilings create an unforgettable first impression. Expansive glass doors and windows throughout the home invite the outdoors in, offering a seamless transition to the stunning waterfront setting. The thoughtfully planned layout includes 5 en-suite bedrooms, as well as a convenient half bath! The main level features a great room and cozy sitting area, a designated den and primary bedroom all with porcelain wood flooring. The mid-level consists of a secondary suite with white oak flooring, the third level consists of 3 en-suite bedrooms (one of which is a charming bunkroom), all with white oak flooring and a family or media room that opens to an upstairs lanai with incredible vistas! The heart of the home is a stunning designer gourmet kitchen, featuring Sub-Zero and Wolf appliances, exquisite quartzite countertops, custom shaker cabinets and a professional grade gas stove with a Sub-Zero wine cooler. A great feature is a hidden walk-in pantry with a built-in Meile coffee bar and an incredible temperature-controlled wine room with a humidor, for an added touch of sophistication for collectors and connoisseurs. The stunning first-floor primary suite boasts an incredible primary bath with porcelain floors and combination quartz and porcelain walls, dual designer vanities, soaking tub, separate shower and oversized closets, all opening to the resort-style lanai that is an entertainer's dream! The resort-style pool and lanai are magnificent! It features a massive 180-foot dock, around the property! A 24,000-pound boat lift, two Jet Ski lifts making this home a true waterfront paradise! A stunning saltwater pool and spa with fire bowls! The lanai boasts a fully equipped outdoor kitchen, a cozy fireplace, with ample room for alfresco dining complete with shutters and screens! Making this home a true waterfront paradise! Additional features include upstairs and downstairs laundry room, a spacious three-car garage (room for lifts for the car collectors) and a 24kW generator for peace of mind! Being sold fully furnished, this property offers a seamless and convenient transition to a life of luxury! This is a rare opportunity to own a true work of art on Marco Island, blending breathtaking vistas with timeless elegance and modern amenities!
Build Your Team
Quickly find investor-friendly professionals who can help you succeed in real estate investing at any stage of the investing journey.


Agents
Match with investor-friendly agents who can help you find, analyze, and close your next deal


Lenders
Get the best funding…find investor-friendly lenders who specialize in your deal strategy


Property Managers
Transition to passive investing. Find a trusted property management partnership that lasts.


Tax Pros & Accountants
Taxes and financial reporting made easy—find experts to create tax savings strategies, file taxes, and more
Location
Property Details
Parking
- Description: Attached, Driveway, Garage, Paved, GarageDoorOpener
- Details: Attached, Driveway, Garage, Paved, Garage Door Opener
- Garage Spaces: 3
- Spaces Total: 0
Bedroom Information
- # of Bedrooms: 5
Bathroom Information
- # of Baths (Full): 5
- # of Baths (Partial): 1
- # of Baths (Total): 6.0
Interior Features
- # of Rooms: 9
- # of Stories: 3
- Fireplace: Yes
Exterior Features
- Roof Material: Tile
- Pool: Yes
Land Information
- Land Use: Residential
- Land Use Subtype: Single Family Residential
Lot Information
- Parcel ID: 64614200009
- Lot Size: 0 sqft
Property Information
- Property Type: Single Family Residence
- Style: Multi Level, See Remarks
- Year Built: 2020
Tax Information
- Annual Tax: $82,874
Utilities
- Water & Sewer: Public
- Heating: Central, Electric
- Cooling: Central Air, Ceiling Fan(s), Electric
Location
- County: Collier
Listing Details
Investment Summary
- Monthly Cash Flow
- -$57,418
- Cap Rate
- -0.1%
- Cash-on-Cash Return
- -27.0%
- Debt Coverage Ratio
- -0.01
- Internal Rate of Return (5 years)
- -22.0%
Cash Flow
Net Operating Income (NOI) minus mortgage payments.
Calculation:
NOI - Mortgage Payments
Cap Rate (Market Value)
Capitalization Rate is a rate of return that compares the yearly Net Operating Income (NOI) to the market value.
Calculation:
NOI / Market Value
Cash-on-Cash Return (CoC)
Annual Cash Flow / Cash Invested
Calculation:
Annual cash flow divided by initial cash invested.
Debt Coverage Ratio (DCR)
Net Operating Income (NOI) divided by total debt payments.
Calculation:
NOI / Total Debt Payments
Internal Rate of Return (IRR)
A metric for assessing profitability over time. IRR is the discount rate at which the net present value (NPV) of all future cash flows (positive and negative) from an investment equals zero — including both periodic cash flow (such as rent) and a projected sale at the end of the holding period. It represents the expected annualized return, accounting for income, expenses, and the recovery of capital through a future sale.
Purchase Details
Purchase PriceThe price paid for the property. Purchase price:
| $11,100,000 |
|---|---|
Amount FinancedThe amount of the purchase financed through a loan. Amount financed:
| -$8,880,000 |
Down paymentThe initial payment made towards the purchase. Down payment:
| $2,220,000 |
Closing CostsFees and expenses associated with purchasing a property, typically ranging from 2% to 5% of the home’s purchase price, paid at the end of a home purchase to cover services like lending, title transfer, and taxes. Closing costs:
| $333,000 |
Rehab CostsCosts incurred to repair or improve the property, including: roof, flooring, exterior siding, kitchen, exterior paint, bathrooms, etc. Rehab costs:
| $0 |
Initial Cash InvestedThe total initial cash invested in the property. Calculation:Down payment + Buying costs + Rehab costs Initial cash invested:
| $2,553,000 |
Square Feet (SQFT)The total square footage of the property. Square feet:
| 4,728 |
Cost Per Square FootCost per square foot of the property. Calculation:Purchase Price / Square Feet Cost per square foot:
| $2,348 |
Monthly Rent Per Square FootMonthly rent divided by the number of square feet. This ratio helps investors compare rental income efficiency across properties, markets, and unit sizes Calculation:Monthly Rent / Square Feet Monthly rent per square foot:
| $1.95 |
Financing Details
Loan AmountThe total sum of money borrowed from a lender to finance a property purchase. Calculation:Purchase Price - Down Payment
Loan amount:
| $8,880,000 |
|---|---|
Loan to Value Ratio (LTV)Loan amount divided by the market value of the property. Calculation:Loan Amount / Market Value
Loan to value ratio:
| 80.0% |
Loan TypeThe type of loan (e.g., fixed, adjustable).
Loan type:
| Amortizing |
TermThe loan repayment period in years.
Term:
| 30 years |
Interest RateThe percentage a lender charges on the borrowed amount of a loan, determining the cost of borrowing money.
Interest rate:
| 6.625% |
Principal & Interest (PI)The principal is the portion of the loan payment that reduces the loan balance. The interest is the lender's charge for borrowing money. Calculation:(P * r * (1 + r) ** n) / ((1 + r) ** n - 1) Where:
P = Loan amount (principal)
Principal & interest:
| $56,860 |
Property TaxesAnnual taxes levied by local governments on real estate properties. These taxes fund public services like schools, roads, and emergency services.
Property tax:
| $6,906 |
InsuranceThe costs for insurance coverage to protect against financial losses due to risks like fire, natural disasters, theft, liability, or tenant-related damages. Calculation:Assumes 7% of gross rental income, unless insurance rates are specified.
Insurance:
| $644 |
Private Mortgage Insurance (PMI)A fee that borrowers pay when they take out a conventional loan with a loan-to-value (LTV) ratio above 80%.
Private mortgage insurance (PMI):
| $0 |
Monthly PaymentThe fixed amount a borrower pays each month to repay a loan. It typically includes principal and interest (P&I) and may also cover property taxes, insurance, HOA fees, and PMI if escrowed. Monthly payment:
| $64,410 |
Operating Income
| % Rent | Monthly | Yearly | |
|---|---|---|---|
Gross RentThe total rental income received from tenants before deducting any expenses. Includes base rent, late fees, pet fees, parking fees, and other recurring charges.
Gross rent:
| $9,200 | $110,400 | |
Vacancy LossExpected loss of rent due to vacancies.
Vacancy loss:
(6%)
| 6% | -$552 | -$6,624 |
Operating IncomeGross rental income minus vacancy loss. Calculation:Gross rent - Vacancy loss
Operating income:
| $8,648 | $103,776 |
Operating Expenses
| % Rent | Monthly | Yearly | |
|---|---|---|---|
Property TaxesAnnual taxes levied by local governments on real estate properties. These taxes fund public services like schools, roads, and emergency services. | 75% | -$6,906 | -$82,874 |
InsuranceThe costs for insurance coverage to protect against financial losses due to risks like fire, natural disasters, theft, liability, or tenant-related damages. Calculation:Assumes 7% of gross rental income, unless insurance rates are specified. | 7% | -$644 | -$7,728 |
Property ManagementThe costs associated with hiring a property manager to handle the day-to-day operations of a rental property. Includes management fees, leasing fes, eviction fees, etc. Calculation:Assumes 8% of gross rental income. | 8% | -$736 | -$8,832 |
Repairs & MaintenanceOngoing costs for routine upkeep and minor fixes needed to keep a property in good working condition. Calculation:Assumes 5% of gross rental income. Varies by property age and condition. | 5% | -$460 | -$5,520 |
Capital ExpensesLarge, infrequent costs for major improvements or replacements, like a new roof, HVAC system, or appliances. Calculation:Assumes 5% of gross rental income. Varies by property age. | 5% | -$460 | -$5,520 |
HOA FeesRegular dues paid to a Homeowners Association for community maintenance, amenities, and management. Similar fees include: Condo Association Fees, Co-op Maintenance Fees, etc. | n/a | n/a | n/a |
Operating ExpensesRecurring costs required to maintain and manage a rental property, including property taxes, insurance, maintenance, repairs, utilities (if paid by the owner), property management fees, and other day-to-day expenses. Calculation:Insurance + Property Taxes + Property Management + Repairs & Maintenance + Capital Expenditures + HOA Fees | 100% | -$9,206 | -$110,474 |
Cash Flow
| Monthly | Yearly | |
|---|---|---|
Net Operating Income (NOI)The income generated from a property after deducting all operating expenses but before deducting mortgage payments, taxes, and capital expenditures. Calculation:Gross Operating Income - Operating Expenses
Net operating income:
| -$558 | -$6,696 |
Mortgage PaymentThe fixed amount a borrower pays each month to repay a loan. It typically includes principal and interest (P&I) and may also cover property taxes, insurance, HOA fees, and PMI if escrowed. | -$56,860 | -$682,320 |
Cash FlowNet Operating Income (NOI) minus mortgage payments. Calculation:NOI - Mortgage Payments | $57,418 | $689,016 |