$2,399,000
Investment Summary
- Monthly Cash Flow
- -$9,754
- Cap Rate
- 0.8%
- Cash-on-Cash Return
- -21.2%
- Debt Coverage Ratio
- 0.14
- Internal Rate of Return (5 years)
- -16.5%
Cash Flow
Net Operating Income (NOI) minus mortgage payments.
Calculation:
NOI - Mortgage Payments
Cap Rate (Market Value)
Capitalization Rate is a rate of return that compares the yearly Net Operating Income (NOI) to the market value.
Calculation:
NOI / Market Value
Cash-on-Cash Return (CoC)
Annual Cash Flow / Cash Invested
Calculation:
Annual cash flow divided by initial cash invested.
Debt Coverage Ratio (DCR)
Net Operating Income (NOI) divided by total debt payments.
Calculation:
NOI / Total Debt Payments
Internal Rate of Return (IRR)
A metric for assessing profitability over time. IRR is the discount rate at which the net present value (NPV) of all future cash flows (positive and negative) from an investment equals zero — including both periodic cash flow (such as rent) and a projected sale at the end of the holding period. It represents the expected annualized return, accounting for income, expenses, and the recovery of capital through a future sale.
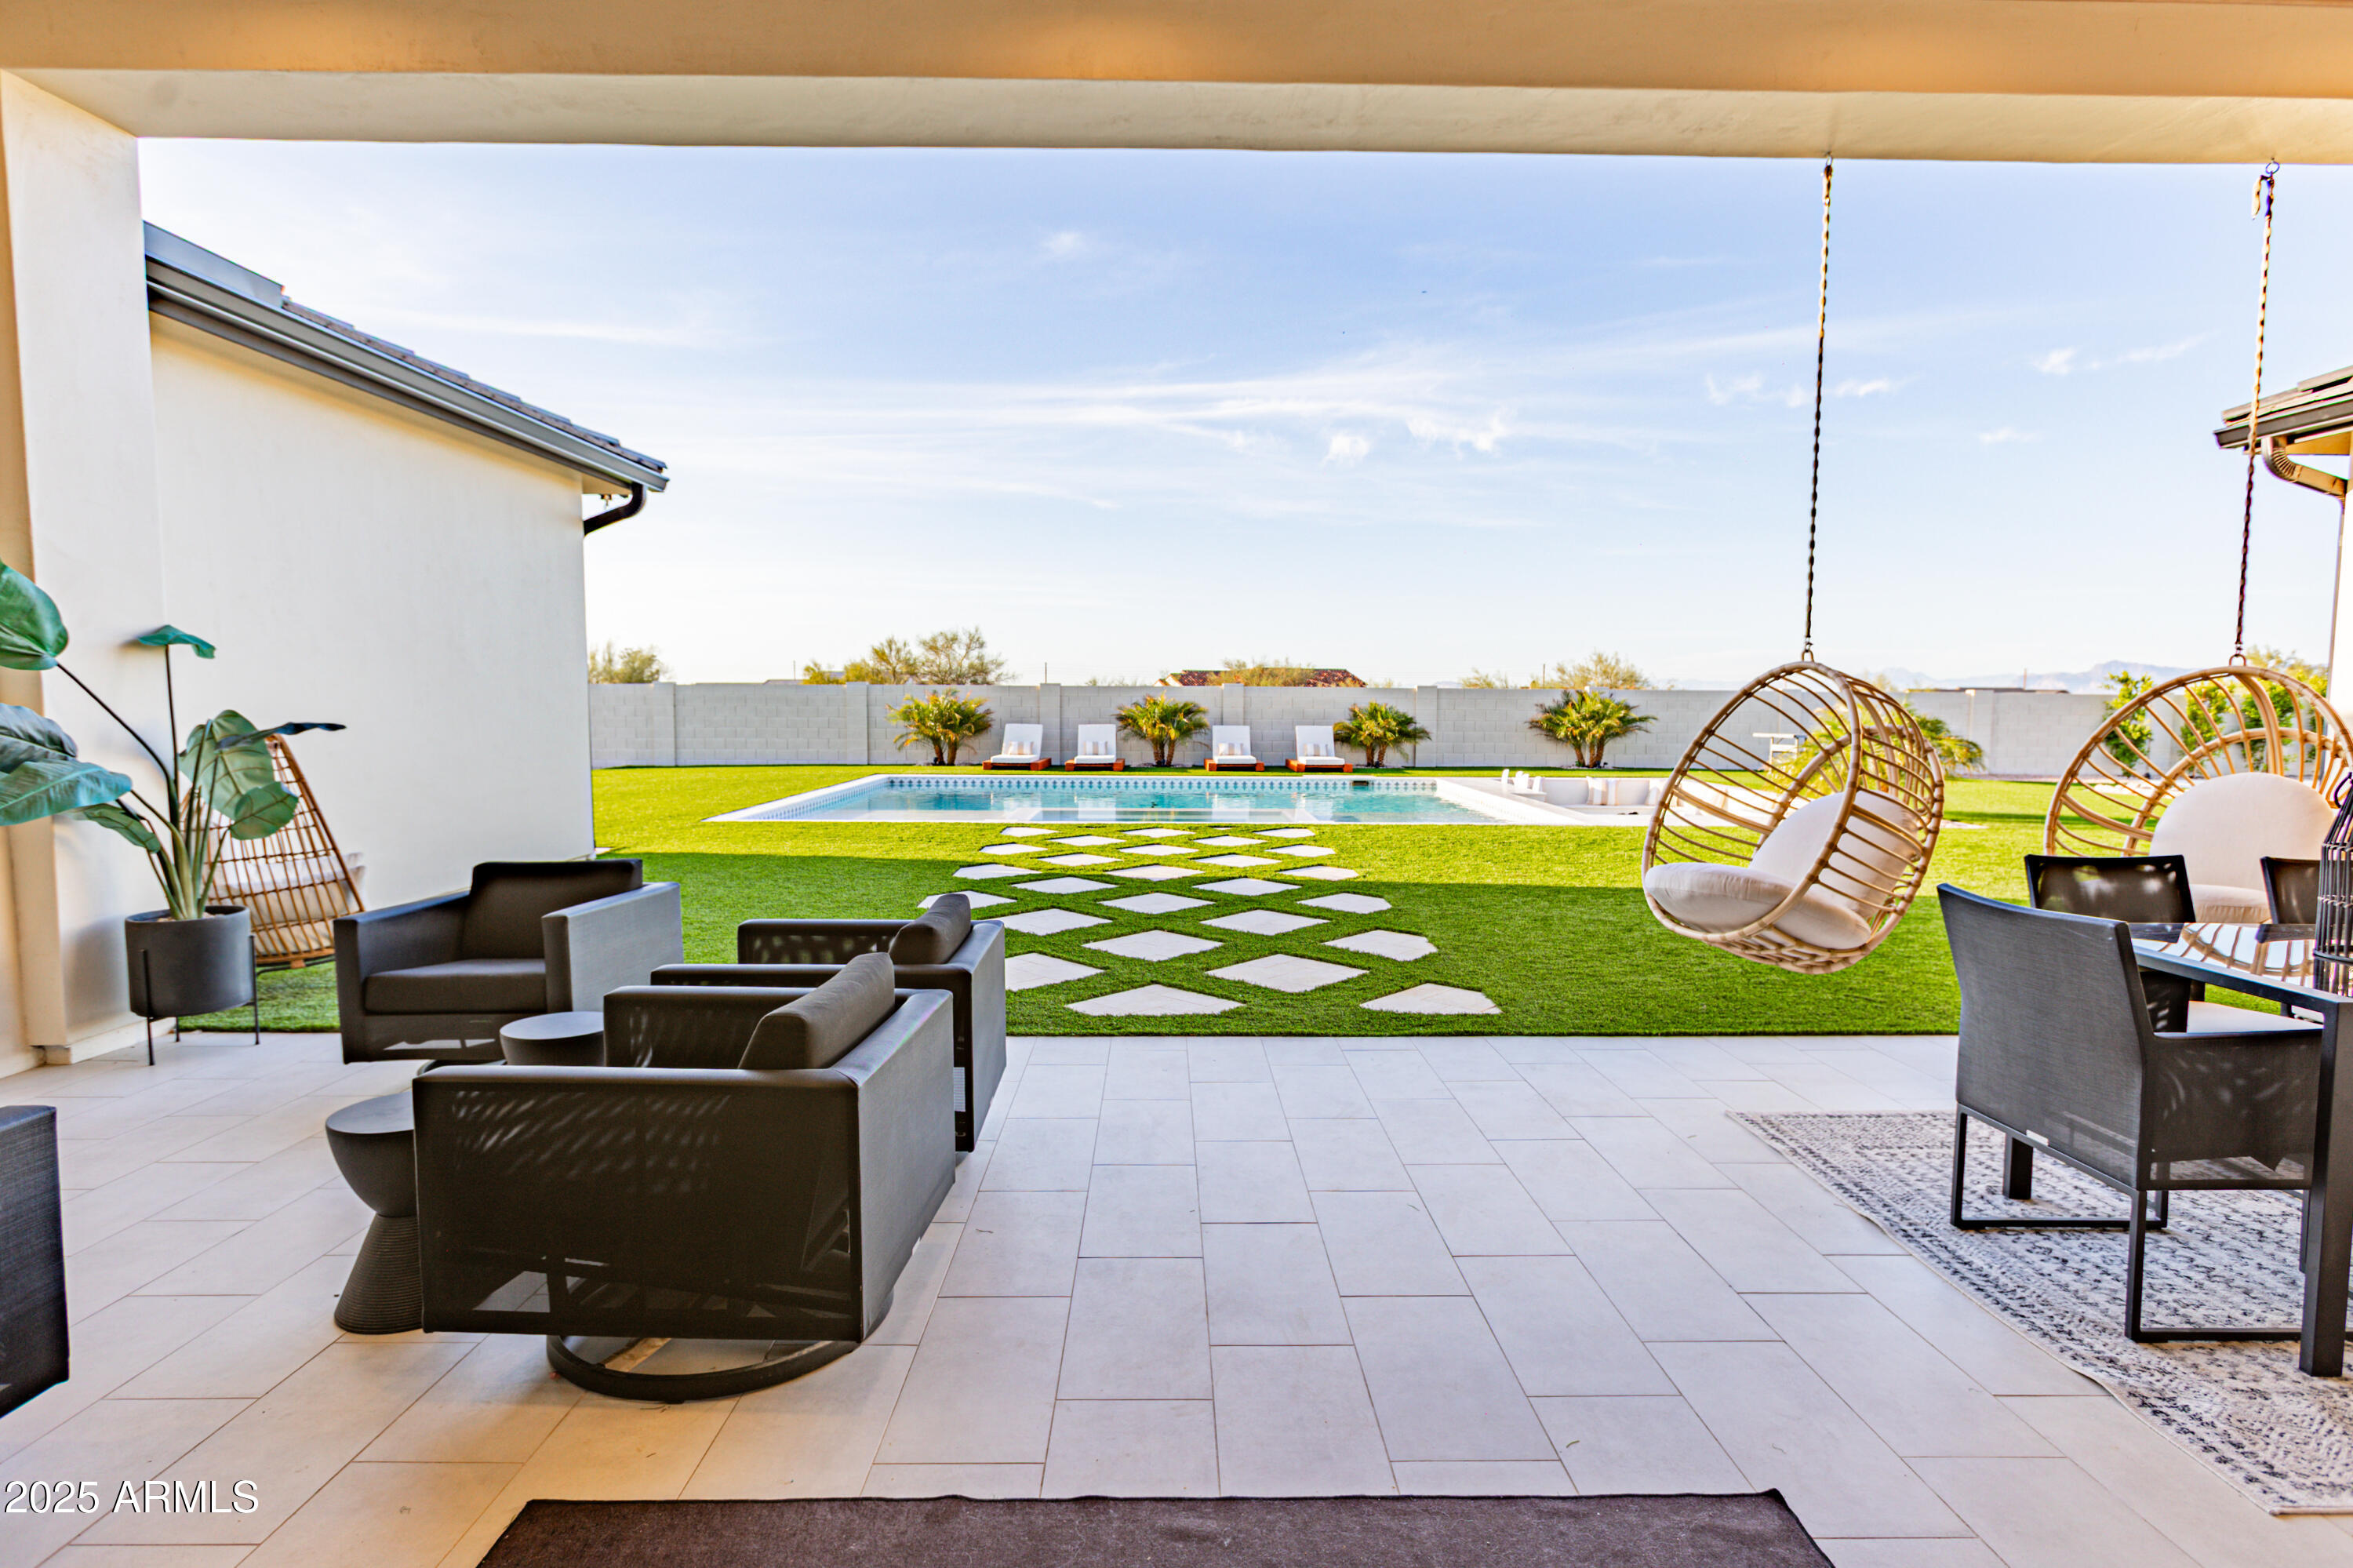
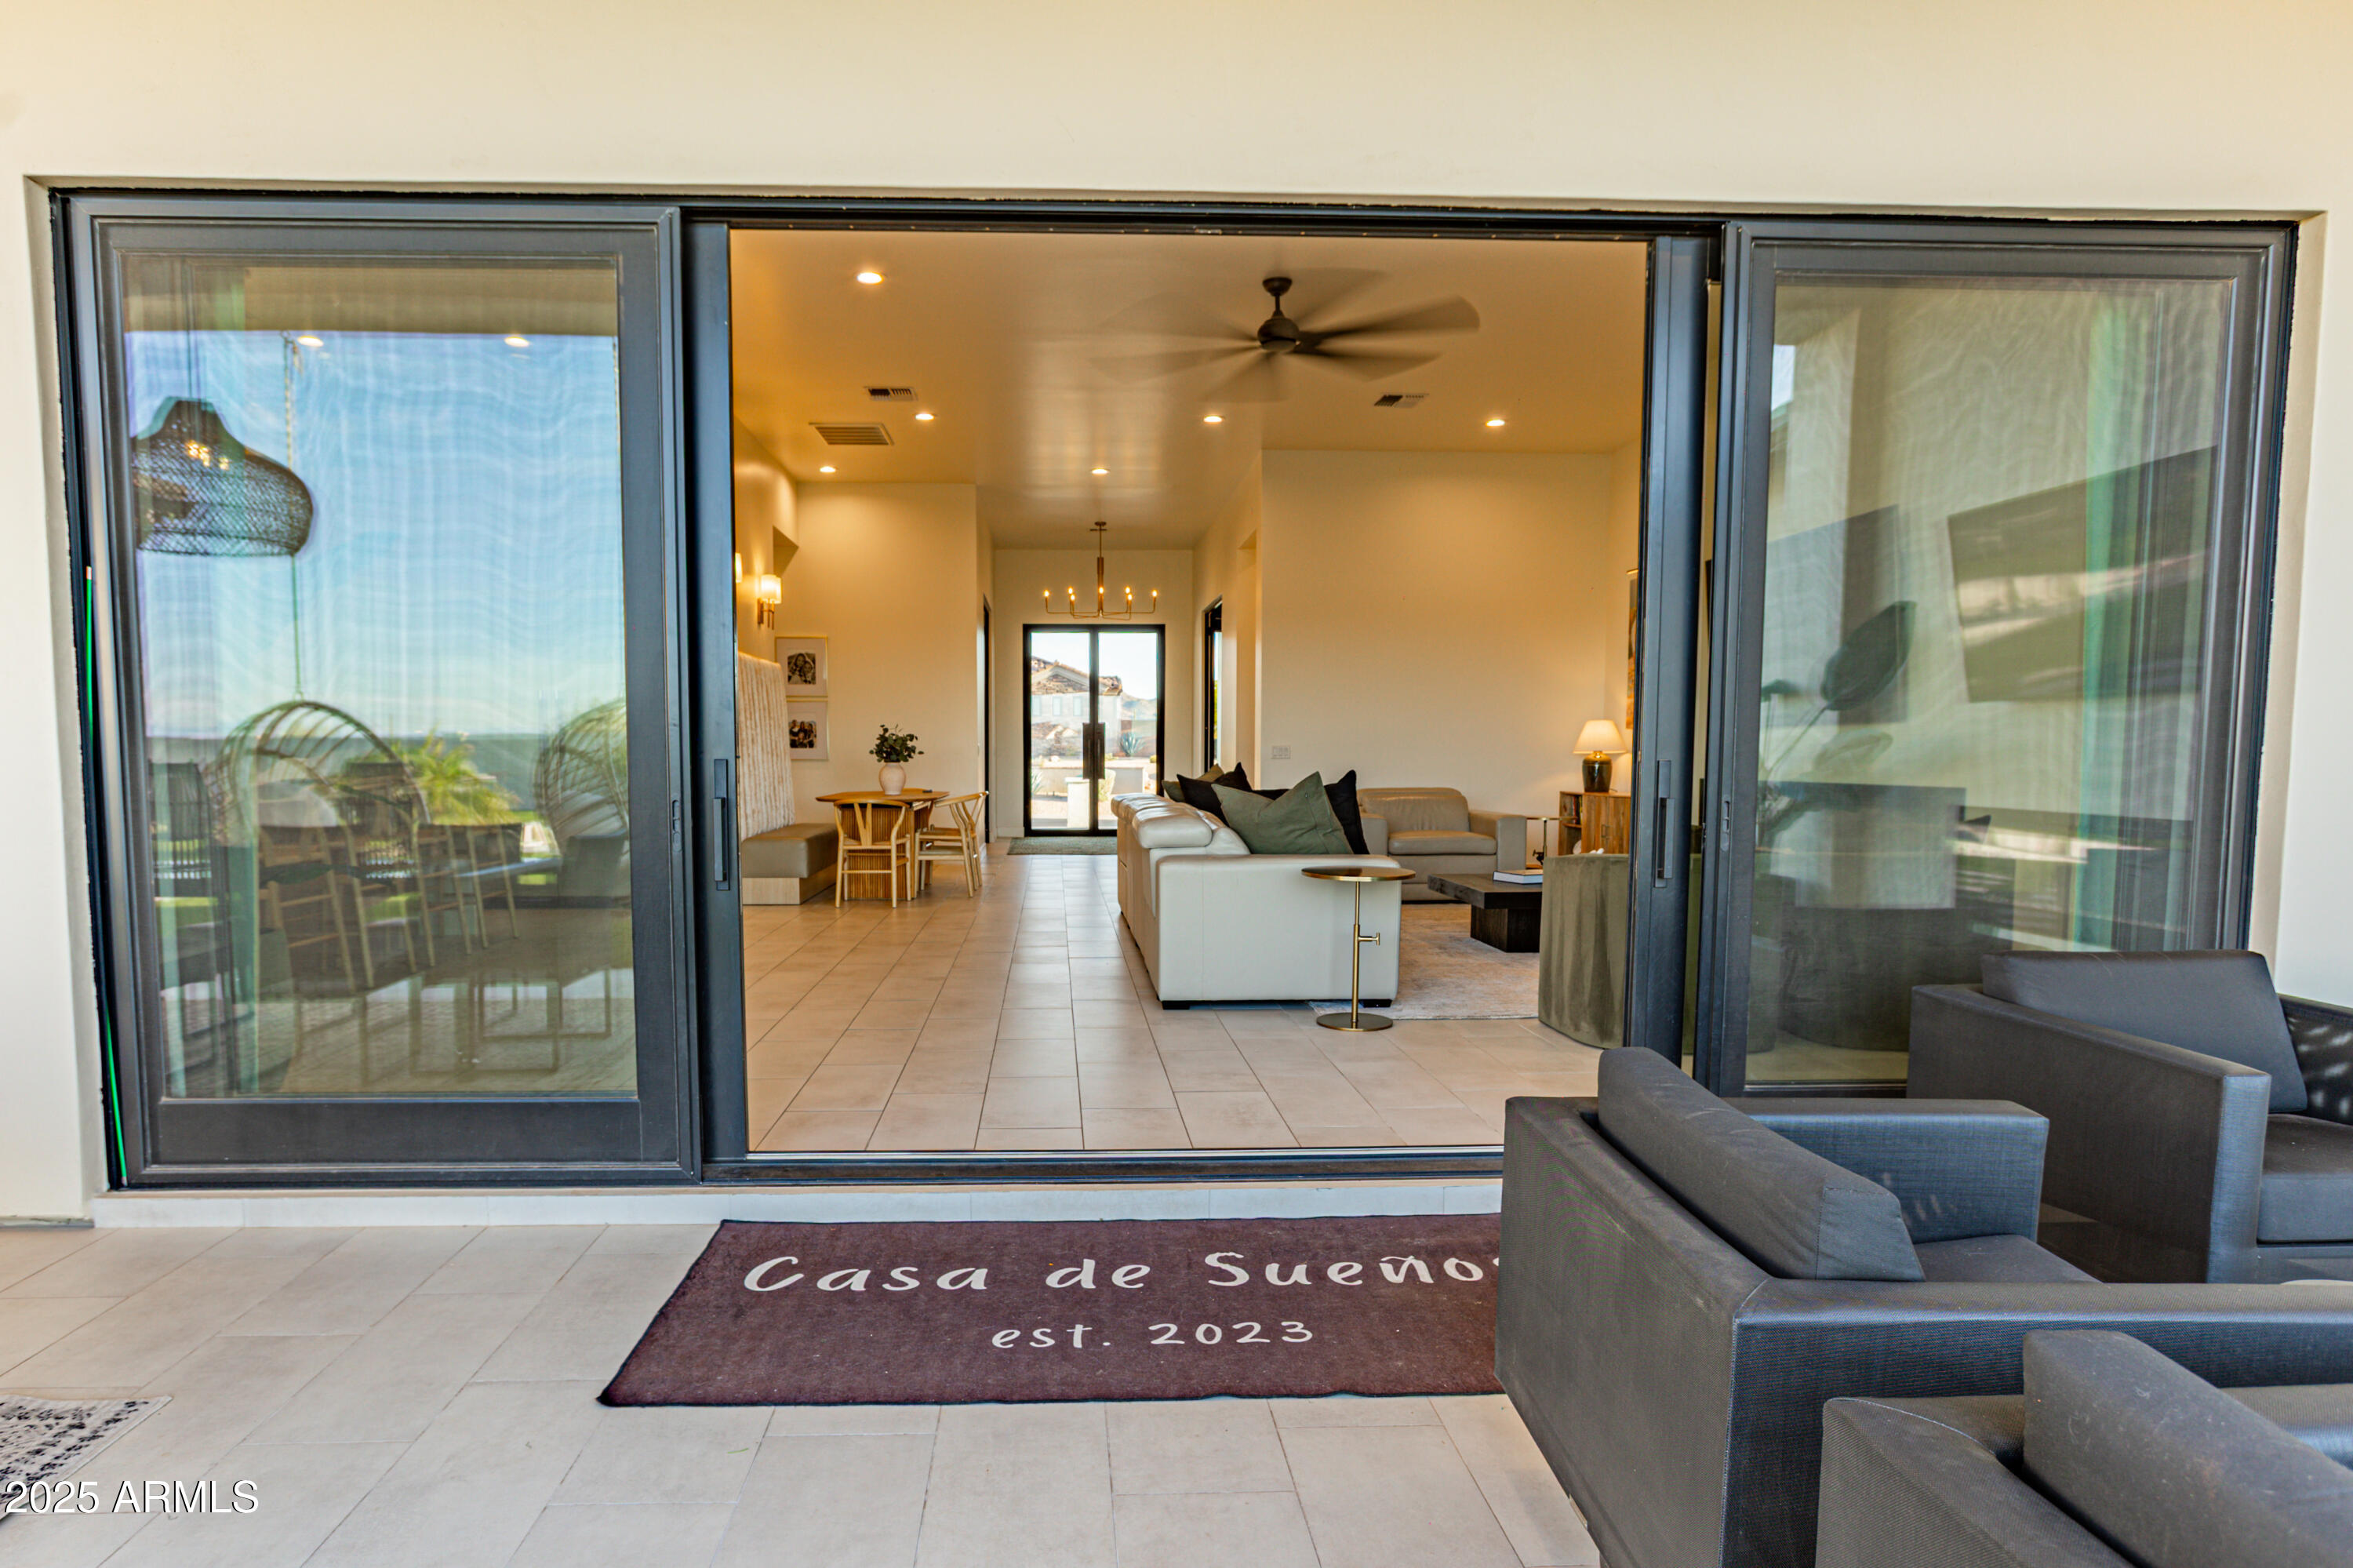
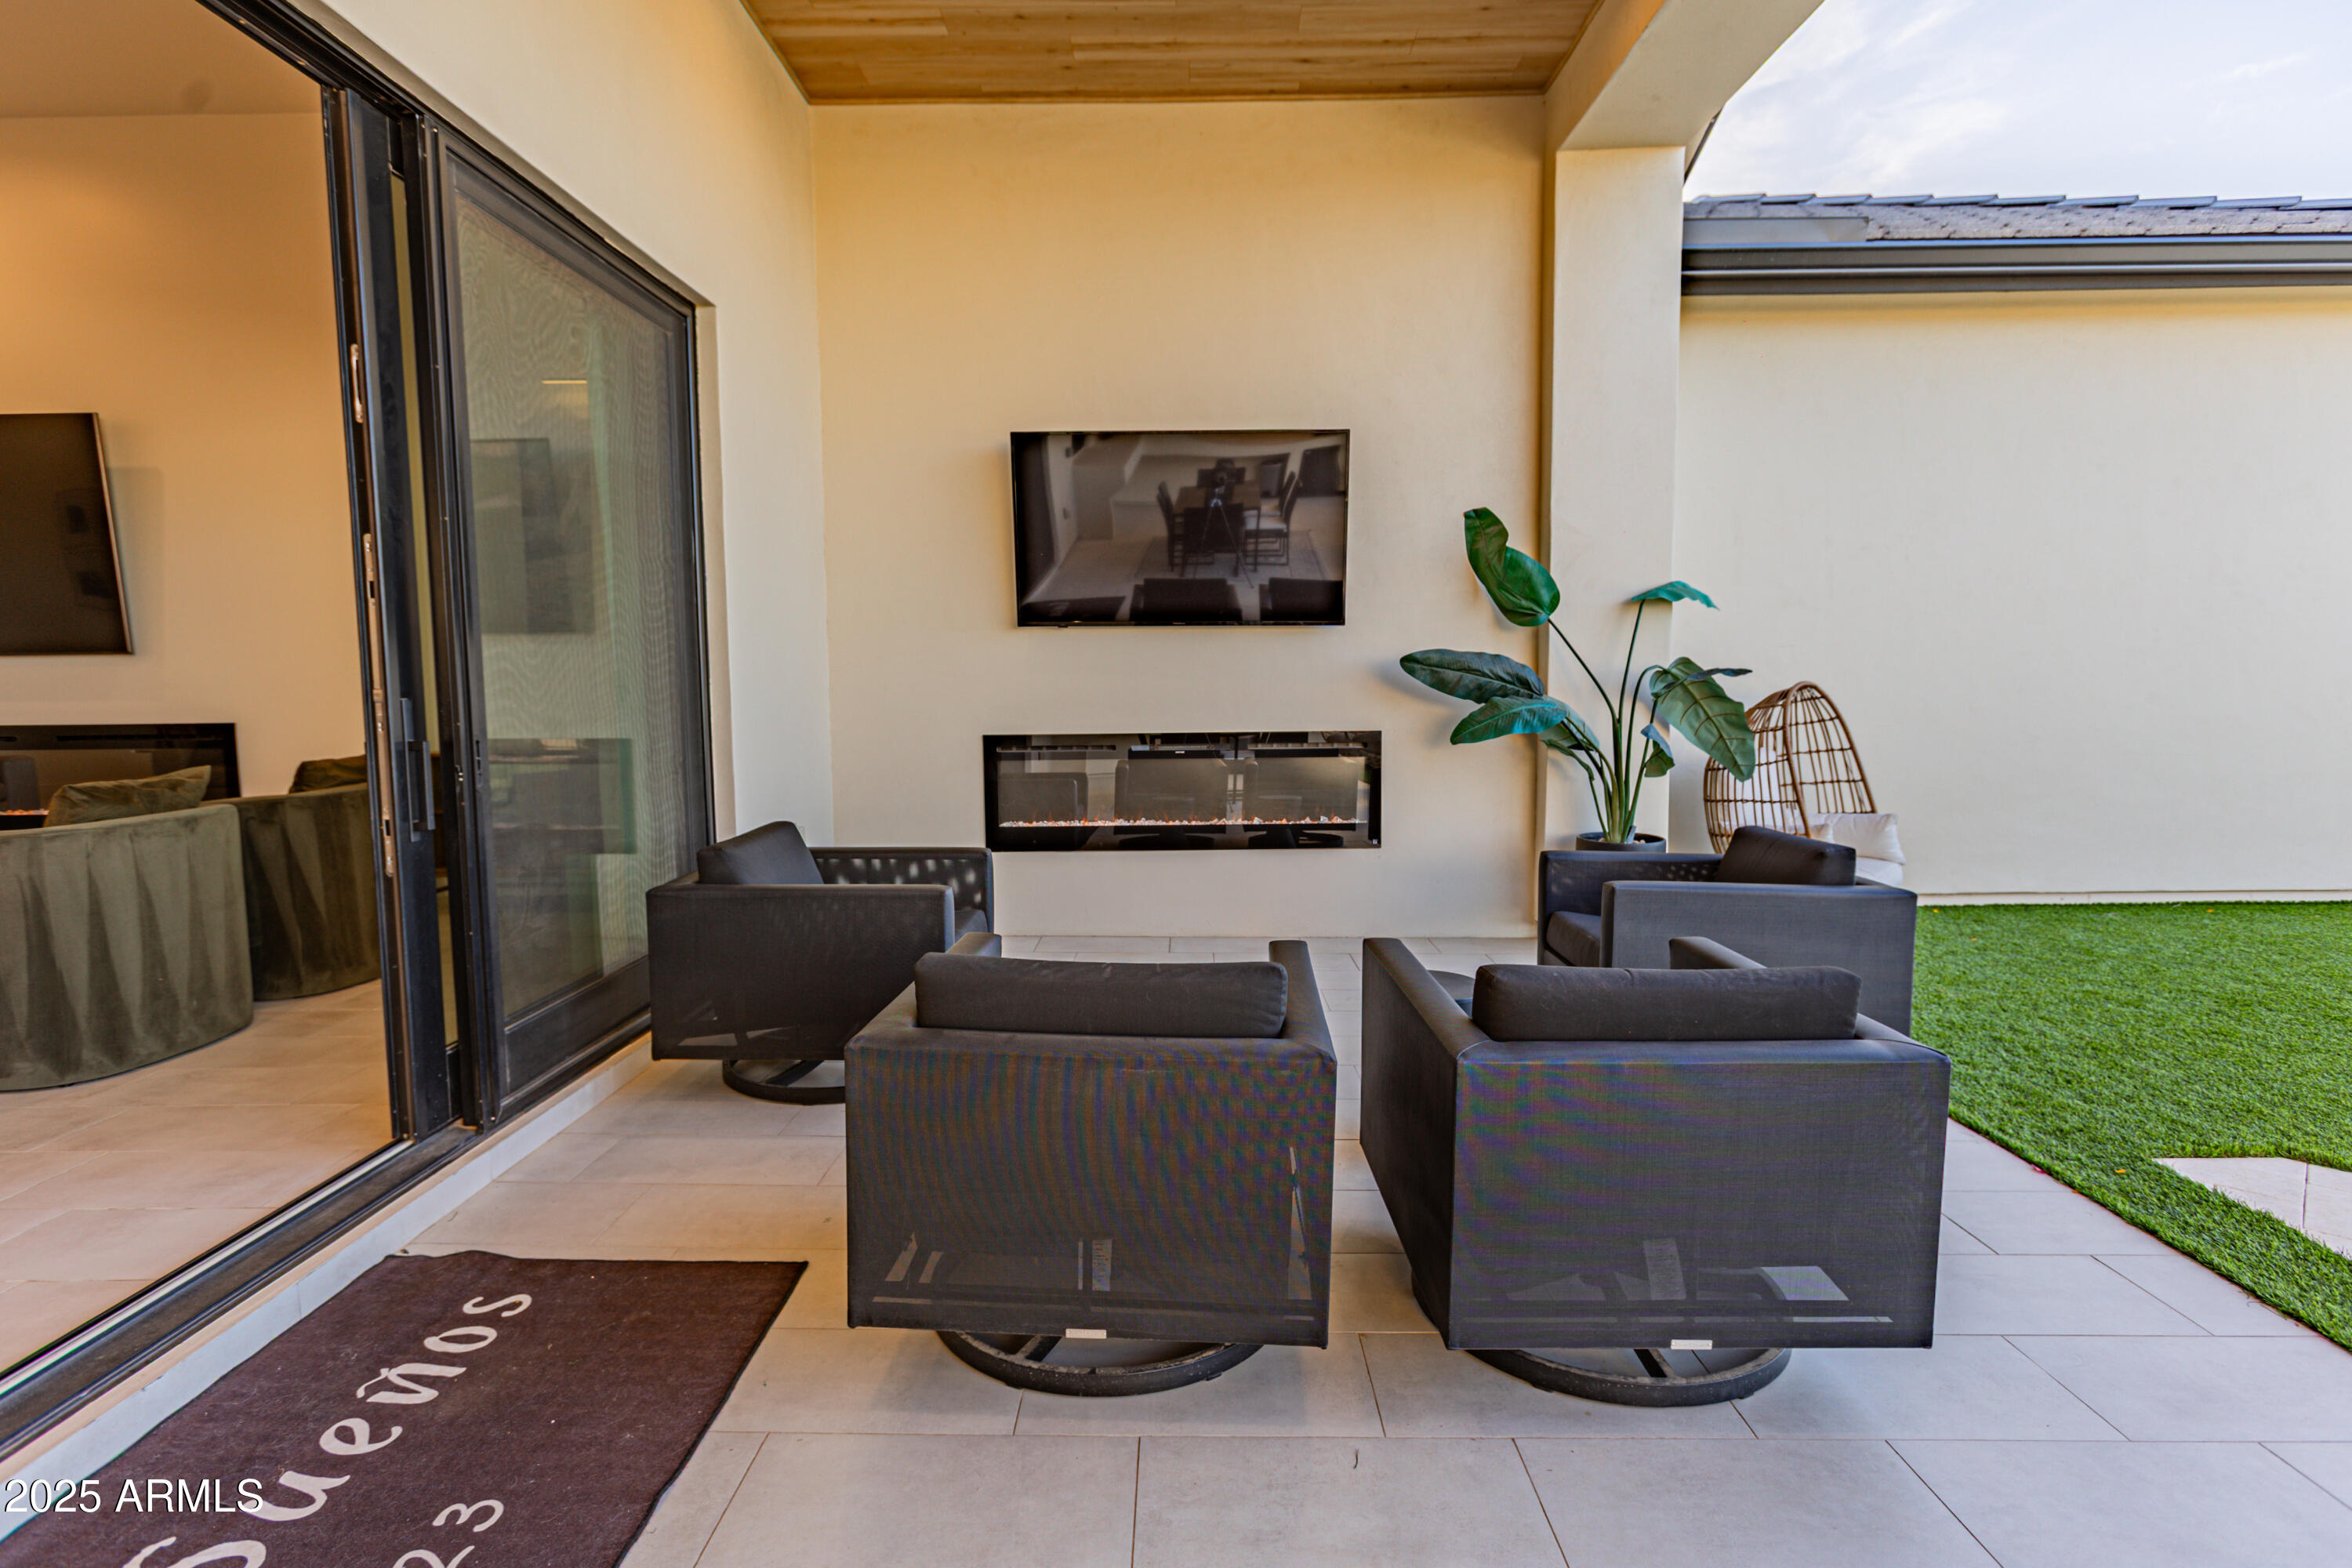
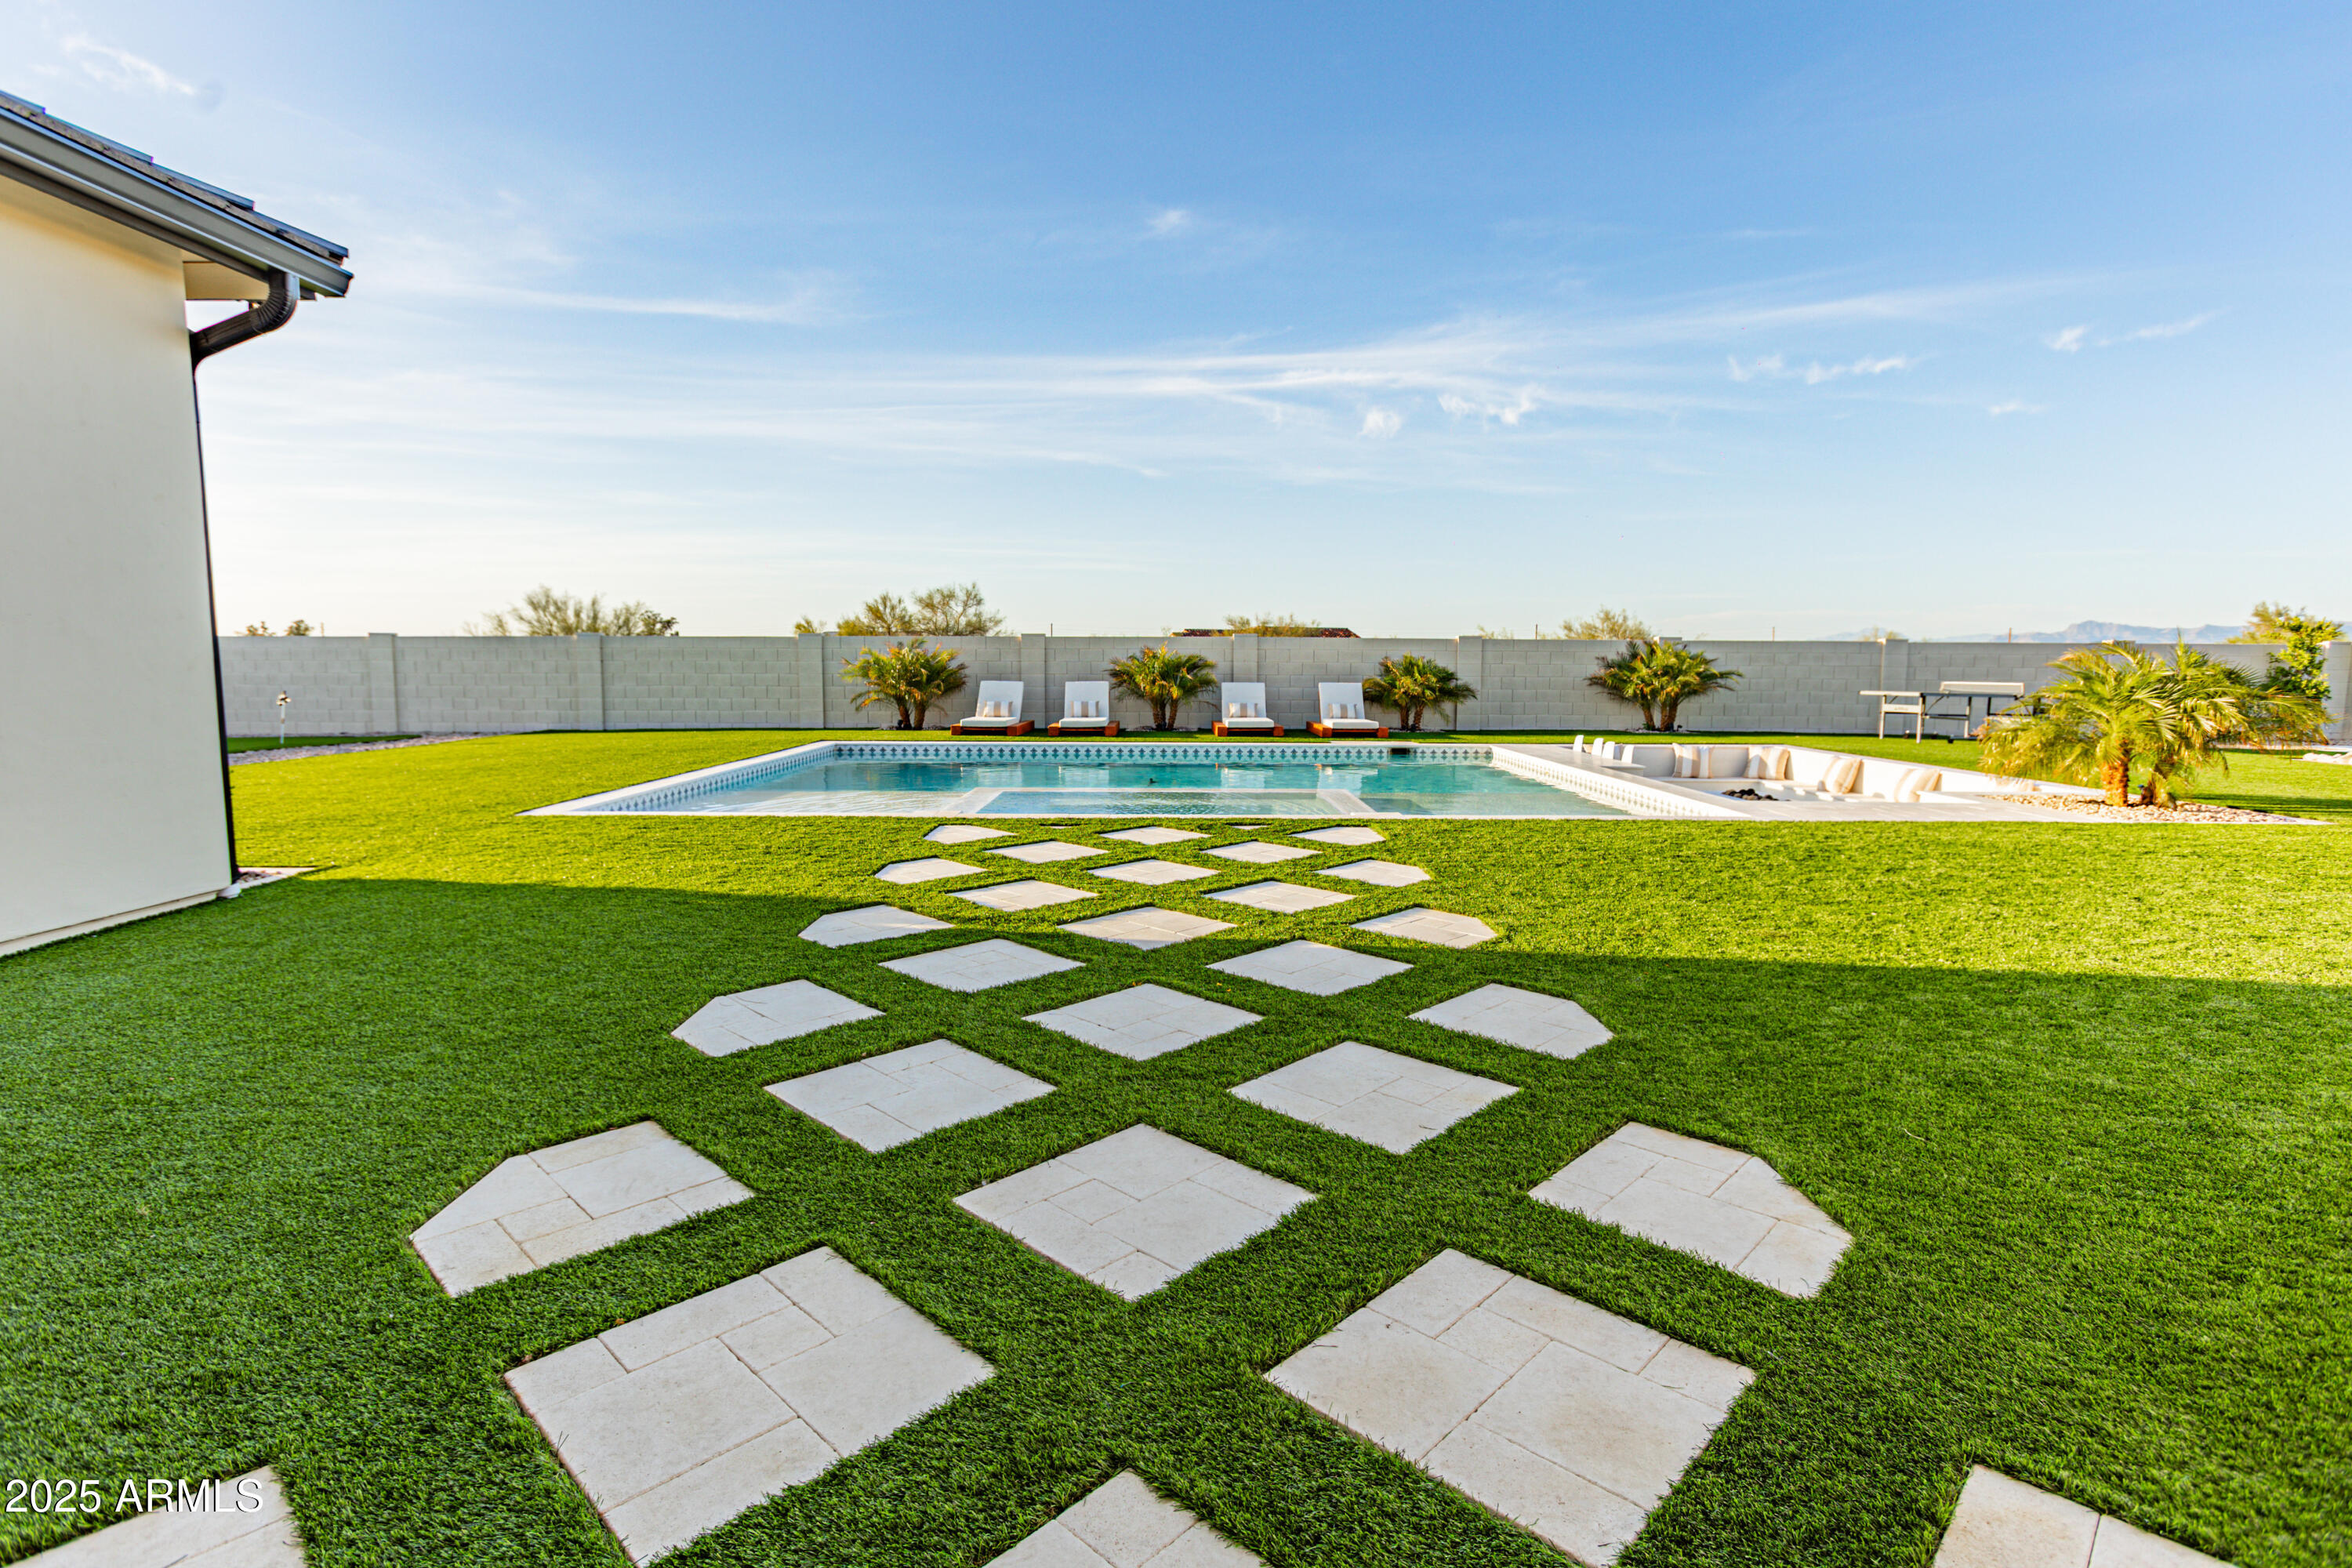
Property Description
Welcome to Casa de Sueños, elevated desert living in Santo Vallarta. This remarkable residence offers privacy and breathtaking panoramic mountain views, all just moments from Queen Creek's vibrant city center. Located on a prime corner lot along a quiet back street, this property impresses with a stunning stamped concrete half-circle driveway and a massive limestone pillar entry. An oversized side driveway provides ample parking for guests and recreational vehicles. As you step through the impressive 10 by 6 ft. glass door, you'll immediately notice the beautiful Sierra Pacific casement windows throughout the home. The interior features a versatile floor plan, allowing for easy customization to suit your lifestyle. Two front rooms with large picture windows can function perfectly as an office, a cozy lounge, or a formal dining room. The heart of the home is an expansive, open floor plan that seamlessly connects the living spaces. A neutral color palette throughout creates a calming atmosphere, while TNG ceilings add a touch of architectural detail and warmth. This design makes it easy to decorate and personalize the space to your taste. This home is designed for both luxurious living and unforgettable entertaining. The kitchen is a chef's dream, featuring custom sleek modern oak cabinetry and top-of-the-line Thermador appliances, including a 60" built-in fridge and a 48" range with a griddle and pot filler. A stunning waterfall island with quartz countertops and a pass-through kitchen sink window to the outdoor bar make hosting an absolute delight. The thoughtful layout separates the master bedroom and a secondary master retreat for guests on opposite sides of the home. A separate hallway leads to additional bedrooms and the famous "bunk room," which houses four queen-size built-in bunks. This versatile space could easily transform into a gym, theatre, game room, or additional bedroom to suit your needs. Throughout the home, designer details abound, including raised floating vanities, upgraded custom sleek cabinetry, quartz countertops, faucets built into the wall, and toe-kick lighting. The garage offers exceptional functionality and space, with an extended height door and length to accommodate oversized vehicles, gym equipment, and sporting gear. Custom built-in storage, built in lighting making it appear like a showroom, locker storage for sporting equipment, epoxy flooring, and two electric car charging plug-ins complete this space. The backyard is an entertainer's paradise. Enjoy a massive heated pool, a sunken spa with glow-in-the-dark tile, an oversized 5 hole putting green with stunning mountain views, and a sunken travertine fire pit area with seating to the swim-up bar. The backyard adds more dimension with a sunken sport court with lighted travertine steps to pickleball, basketball, or hockey enthusiasts. If sports aren't your focus, architectural plans for a 2-bedroom guest house are included and for ease of access, there is an RV gate right off the multi-purpose court. This is more than a home; it's a lifestyle of elevated desert luxury living and unparalleled convenience.
Build Your Team
Quickly find investor-friendly professionals who can help you succeed in real estate investing at any stage of the investing journey.


Agents
Match with investor-friendly agents who can help you find, analyze, and close your next deal


Lenders
Get the best funding…find investor-friendly lenders who specialize in your deal strategy


Property Managers
Transition to passive investing. Find a trusted property management partnership that lasts.


Tax Pros & Accountants
Taxes and financial reporting made easy—find experts to create tax savings strategies, file taxes, and more
Location
Property Details
Parking
- Description: Attached Garage
- Details: Garage Door Opener, Direct Access, Circular Driveway, Electric Vehicle Charging Station(s), Garage Faces Side
- Garage Spaces: 4
- Spaces Total: 10
Bedroom Information
- # of Bedrooms: 4
Bathroom Information
- # of Baths (Total): 5.0
Interior Features
- # of Stories: 1
- Fireplace: Yes
Exterior Features
- Exterior Walls Materials: Other
- Roof Material: Tile
- Pool: Yes
HOA
- Has HOA: Yes
- Association: Santo Vallarta
- HOA Fee: $425/quarterly
Land Information
- Land Use: Residential
- Land Use Subtype: Rural/Agricultural
Lot Information
- Parcel ID: 509071440
- Lot Size: 30056 sqft
Property Information
- Property Type: Single Family Residence
- Style: Ranch
- Year Built: 2023
Tax Information
- Annual Tax: $5,602
Utilities
- Water & Sewer: Public
- Heating: Electric
- Cooling: Central Air, Ceiling Fan(s)
Location
- County: Pinal
Listing Details
Investment Summary
- Monthly Cash Flow
- -$9,754
- Cap Rate
- 0.8%
- Cash-on-Cash Return
- -21.2%
- Debt Coverage Ratio
- 0.14
- Internal Rate of Return (5 years)
- -16.5%
Cash Flow
Net Operating Income (NOI) minus mortgage payments.
Calculation:
NOI - Mortgage Payments
Cap Rate (Market Value)
Capitalization Rate is a rate of return that compares the yearly Net Operating Income (NOI) to the market value.
Calculation:
NOI / Market Value
Cash-on-Cash Return (CoC)
Annual Cash Flow / Cash Invested
Calculation:
Annual cash flow divided by initial cash invested.
Debt Coverage Ratio (DCR)
Net Operating Income (NOI) divided by total debt payments.
Calculation:
NOI / Total Debt Payments
Internal Rate of Return (IRR)
A metric for assessing profitability over time. IRR is the discount rate at which the net present value (NPV) of all future cash flows (positive and negative) from an investment equals zero — including both periodic cash flow (such as rent) and a projected sale at the end of the holding period. It represents the expected annualized return, accounting for income, expenses, and the recovery of capital through a future sale.
Purchase Details
Purchase PriceThe price paid for the property. Purchase price:
| $2,399,000 |
|---|---|
Amount FinancedThe amount of the purchase financed through a loan. Amount financed:
| -$1,919,200 |
Down paymentThe initial payment made towards the purchase. Down payment:
| $479,800 |
Closing CostsFees and expenses associated with purchasing a property, typically ranging from 2% to 5% of the home’s purchase price, paid at the end of a home purchase to cover services like lending, title transfer, and taxes. Closing costs:
| $71,970 |
Rehab CostsCosts incurred to repair or improve the property, including: roof, flooring, exterior siding, kitchen, exterior paint, bathrooms, etc. Rehab costs:
| $0 |
Initial Cash InvestedThe total initial cash invested in the property. Calculation:Down payment + Buying costs + Rehab costs Initial cash invested:
| $551,770 |
Square Feet (SQFT)The total square footage of the property. Square feet:
| 4,250 |
Cost Per Square FootCost per square foot of the property. Calculation:Purchase Price / Square Feet Cost per square foot:
| $564 |
Monthly Rent Per Square FootMonthly rent divided by the number of square feet. This ratio helps investors compare rental income efficiency across properties, markets, and unit sizes Calculation:Monthly Rent / Square Feet Monthly rent per square foot:
| $0.75 |
Financing Details
Loan AmountThe total sum of money borrowed from a lender to finance a property purchase. Calculation:Purchase Price - Down Payment
Loan amount:
| $1,919,200 |
|---|---|
Loan to Value Ratio (LTV)Loan amount divided by the market value of the property. Calculation:Loan Amount / Market Value
Loan to value ratio:
| 80.0% |
Loan TypeThe type of loan (e.g., fixed, adjustable).
Loan type:
| Amortizing |
TermThe loan repayment period in years.
Term:
| 30 years |
Interest RateThe percentage a lender charges on the borrowed amount of a loan, determining the cost of borrowing money.
Interest rate:
| 5.875% |
Principal & Interest (PI)The principal is the portion of the loan payment that reduces the loan balance. The interest is the lender's charge for borrowing money. Calculation:(P * r * (1 + r) ** n) / ((1 + r) ** n - 1) Where:
P = Loan amount (principal)
Principal & interest:
| $11,353 |
Property TaxesAnnual taxes levied by local governments on real estate properties. These taxes fund public services like schools, roads, and emergency services.
Property tax:
| $467 |
InsuranceThe costs for insurance coverage to protect against financial losses due to risks like fire, natural disasters, theft, liability, or tenant-related damages. Calculation:Assumes 7% of gross rental income, unless insurance rates are specified.
Insurance:
| $224 |
Private Mortgage Insurance (PMI)A fee that borrowers pay when they take out a conventional loan with a loan-to-value (LTV) ratio above 80%.
Private mortgage insurance (PMI):
| $0 |
Monthly PaymentThe fixed amount a borrower pays each month to repay a loan. It typically includes principal and interest (P&I) and may also cover property taxes, insurance, HOA fees, and PMI if escrowed. Monthly payment:
| $12,044 |
Operating Income
| % Rent | Monthly | Yearly | |
|---|---|---|---|
Gross RentThe total rental income received from tenants before deducting any expenses. Includes base rent, late fees, pet fees, parking fees, and other recurring charges.
Gross rent:
| $3,200 | $38,400 | |
Vacancy LossExpected loss of rent due to vacancies.
Vacancy loss:
(6%)
| 6% | -$192 | -$2,304 |
Operating IncomeGross rental income minus vacancy loss. Calculation:Gross rent - Vacancy loss
Operating income:
| $3,008 | $36,096 |
Operating Expenses
| % Rent | Monthly | Yearly | |
|---|---|---|---|
Property TaxesAnnual taxes levied by local governments on real estate properties. These taxes fund public services like schools, roads, and emergency services. | 15% | -$467 | -$5,602 |
InsuranceThe costs for insurance coverage to protect against financial losses due to risks like fire, natural disasters, theft, liability, or tenant-related damages. Calculation:Assumes 7% of gross rental income, unless insurance rates are specified. | 7% | -$224 | -$2,688 |
Property ManagementThe costs associated with hiring a property manager to handle the day-to-day operations of a rental property. Includes management fees, leasing fes, eviction fees, etc. Calculation:Assumes 8% of gross rental income. | 8% | -$256 | -$3,072 |
Repairs & MaintenanceOngoing costs for routine upkeep and minor fixes needed to keep a property in good working condition. Calculation:Assumes 5% of gross rental income. Varies by property age and condition. | 5% | -$160 | -$1,920 |
Capital ExpensesLarge, infrequent costs for major improvements or replacements, like a new roof, HVAC system, or appliances. Calculation:Assumes 5% of gross rental income. Varies by property age. | 5% | -$160 | -$1,920 |
HOA FeesRegular dues paid to a Homeowners Association for community maintenance, amenities, and management. Similar fees include: Condo Association Fees, Co-op Maintenance Fees, etc. | 4% | -$142 | -$1,704 |
Operating ExpensesRecurring costs required to maintain and manage a rental property, including property taxes, insurance, maintenance, repairs, utilities (if paid by the owner), property management fees, and other day-to-day expenses. Calculation:Insurance + Property Taxes + Property Management + Repairs & Maintenance + Capital Expenditures + HOA Fees | 44% | -$1,409 | -$16,906 |
Cash Flow
| Monthly | Yearly | |
|---|---|---|
Net Operating Income (NOI)The income generated from a property after deducting all operating expenses but before deducting mortgage payments, taxes, and capital expenditures. Calculation:Gross Operating Income - Operating Expenses
Net operating income:
| $1,599 | $19,188 |
Mortgage PaymentThe fixed amount a borrower pays each month to repay a loan. It typically includes principal and interest (P&I) and may also cover property taxes, insurance, HOA fees, and PMI if escrowed. | -$11,353 | -$136,236 |
Cash FlowNet Operating Income (NOI) minus mortgage payments. Calculation:NOI - Mortgage Payments | $9,754 | $117,048 |