
$850,000
Investment Summary
- Monthly Cash Flow
- -$2,193
- Cap Rate
- 3.1%
- Cash-on-Cash Return
- -13.5%
- Debt Coverage Ratio
- 0.50
- Internal Rate of Return (5 years)
- -9.0%
Cash Flow
Net Operating Income (NOI) minus mortgage payments.
Calculation:
NOI - Mortgage Payments
Cap Rate (Market Value)
Capitalization Rate is a rate of return that compares the yearly Net Operating Income (NOI) to the market value.
Calculation:
NOI / Market Value
Cash-on-Cash Return (CoC)
Annual Cash Flow / Cash Invested
Calculation:
Annual cash flow divided by initial cash invested.
Debt Coverage Ratio (DCR)
Net Operating Income (NOI) divided by total debt payments.
Calculation:
NOI / Total Debt Payments
Internal Rate of Return (IRR)
A metric for assessing profitability over time. IRR is the discount rate at which the net present value (NPV) of all future cash flows (positive and negative) from an investment equals zero — including both periodic cash flow (such as rent) and a projected sale at the end of the holding period. It represents the expected annualized return, accounting for income, expenses, and the recovery of capital through a future sale.
Property Description
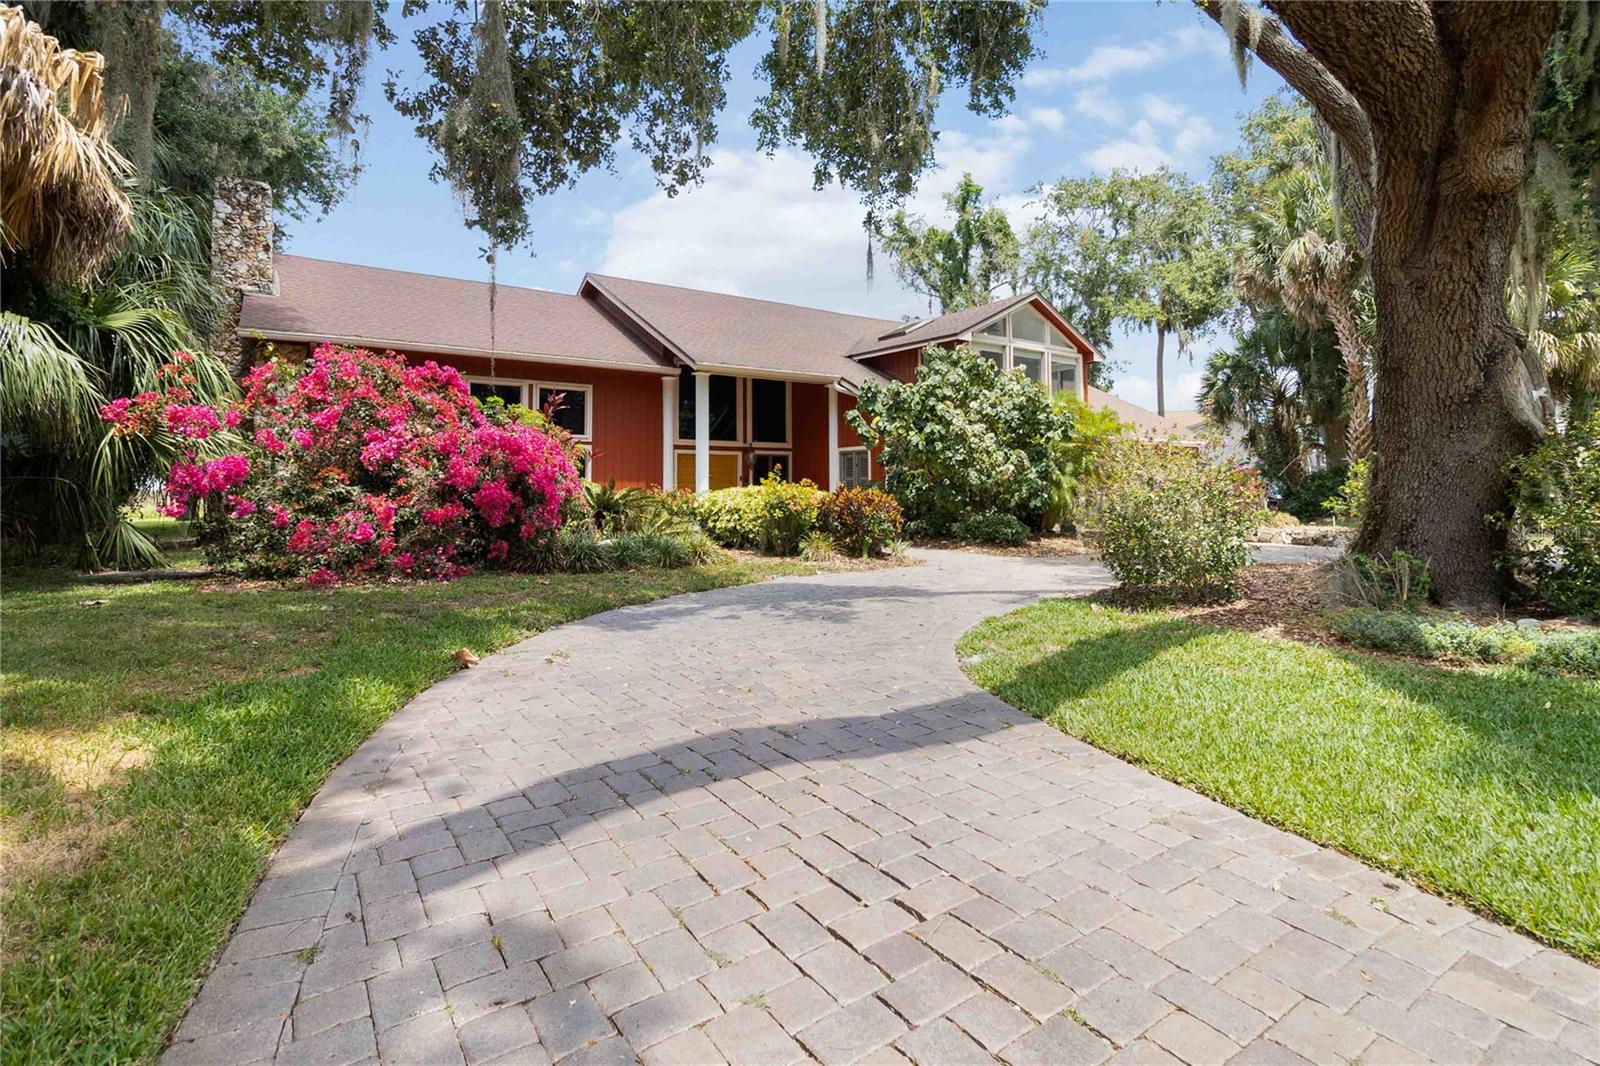
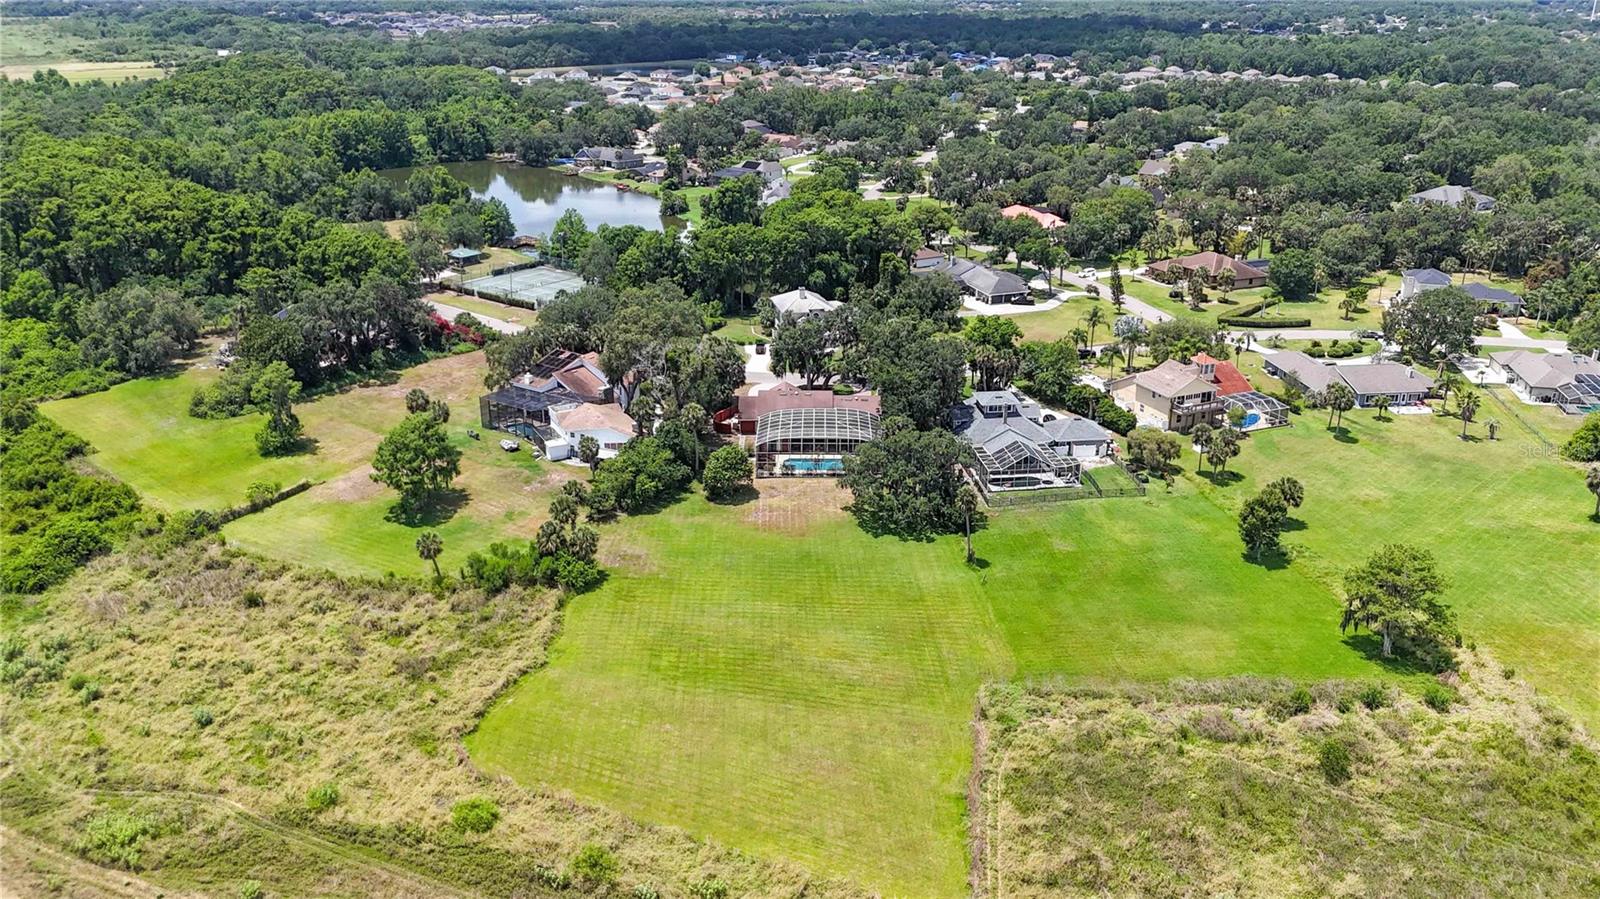
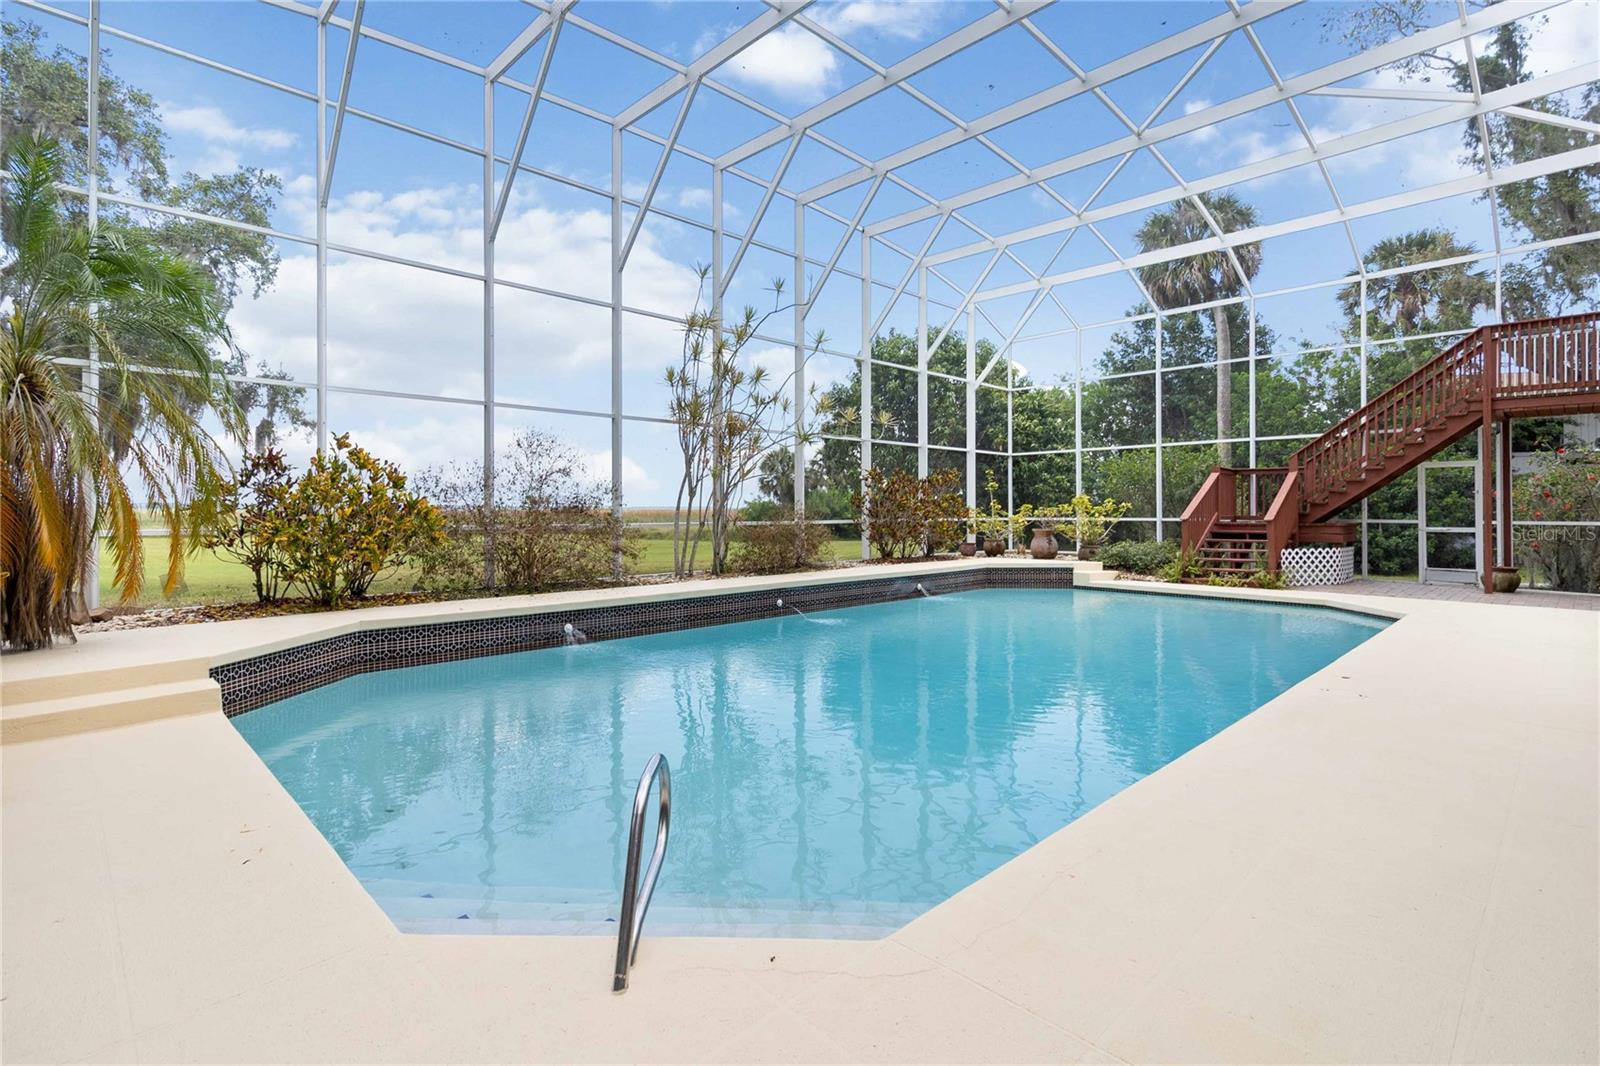
Experience the epitome of luxury living in this stunning estate located in the heart of Kissimmee, Florida. Nestled on a pristine half-acre lakefront lot, this 5-bedroom, 3.5-bathroom masterpiece offers 3,438 square feet of refined elegance and unparalleled craftsmanship. A grand circular driveway welcomes you to this impressive residence, where timeless architectural design meets modern living. Upon entering, you’ll be captivated by soaring vaulted ceilings, gleaming marble flooring, and exquisite high-end finishes that exude opulence throughout every room. The expansive living room serves as a true showpiece with its dramatic floor-to-ceiling stone fireplace—perfect for intimate gatherings or grand entertaining. The chef’s kitchen is a culinary dream, boasting top-of-the-line stainless steel appliances, rich solid wood cabinetry, a generous center island, breakfast bar, and a cozy eat-in nook. Sliding glass windows in the kitchen open fully to the screened pool area—an entertainer’s dream, ideal for parties and gatherings. A formal dining room offers an elegant setting for upscale dinners and celebrations. Designed for versatility and comfort, the main level also features a spacious guest suite—ideal as a second primary bedroom—with a built-in office nook, custom closet, and direct access to a full bathroom. Ascend the custom-crafted wooden spiral staircase or ride the sleek glass elevator to the upper level, where the primary retreat awaits. This private sanctuary features tray ceilings, French doors leading to a sprawling balcony with lake views, and an indulgent spa-inspired en suite bath with a dual-sink vanity, elevated soaking tub, and walk-in shower—creating a true escape from the everyday. Step outside to your private resort-style oasis: a screened-in lanai featuring a heated inground pool, custom bar area, and expansive backyard. Four of the five bedrooms have private exits to the pool area, offering seamless indoor-outdoor living. Fruit trees on the property provide a charming and sustainable touch. The home includes a whole-house generator, has been re-piped within the last five years, and features noise cancellation enhancements that ensure peace and quiet throughout. The REME HALO in-duct air purifier was installed with the air conditioner to improve air quality, and the ducts for the upstairs AC were sealed during the installation of the new unit. Situated in a gated community with surveillance cameras at the entrances, residents also enjoy access to a private tennis court. Recent enhancements include a brand-new upstairs AC unit, new pool pump and filter system, and a new washer and dryer. With impeccable attention to detail and every modern amenity, this one-of-a-kind residence offers a lifestyle of elegance, comfort, and sophistication. Welcome to your luxurious lakefront haven.
Build Your Team
Quickly find investor-friendly professionals who can help you succeed in real estate investing at any stage of the investing journey.


Agents
Match with investor-friendly agents who can help you find, analyze, and close your next deal


Lenders
Get the best funding…find investor-friendly lenders who specialize in your deal strategy


Property Managers
Transition to passive investing. Find a trusted property management partnership that lasts.


Tax Pros & Accountants
Taxes and financial reporting made easy—find experts to create tax savings strategies, file taxes, and more
Location
Property Details
Parking
- Description: Bath In Garage, Circular Driveway, Driveway, Garage Door Opener, Oversized, Parking Pad
- Details: Circular Driveway, Driveway, Garage, Attached
- Garage Spaces: 2
- Spaces Total: 0
Bedroom Information
- # of Bedrooms: 5
Bathroom Information
- # of Baths (Full): 3
- # of Baths (Total): 4.0
Interior Features
- # of Rooms: 4
- # of Stories: 2
- Fireplace: Yes
Exterior Features
- Exterior Walls Materials: Aluminum siding,N,8/17/20
- Foundation: Slab
- Roof Type: Gable or Hip
- Roof Material: Shingle
- Pool: Yes
HOA
- Has HOA: Yes
- Association: Smaly Lantigua
- HOA Fee: $440/quarterly
Land Information
- Land Use: Residential
- Land Use Subtype: Single Family Residential
Lot Information
- Parcel ID: 092629331100010400
- Lot Size: 21998 sqft
Property Information
- Property Type: Single Family Residence
- Year Built: 1985
Tax Information
- Annual Tax: $7,905
Utilities
- Water & Sewer: Public
- Heating: Central
- Cooling: Central Air
Location
- County: Osceola
Listing Details
Investment Summary
- Monthly Cash Flow
- -$2,193
- Cap Rate
- 3.1%
- Cash-on-Cash Return
- -13.5%
- Debt Coverage Ratio
- 0.50
- Internal Rate of Return (5 years)
- -9.0%
Cash Flow
Net Operating Income (NOI) minus mortgage payments.
Calculation:
NOI - Mortgage Payments
Cap Rate (Market Value)
Capitalization Rate is a rate of return that compares the yearly Net Operating Income (NOI) to the market value.
Calculation:
NOI / Market Value
Cash-on-Cash Return (CoC)
Annual Cash Flow / Cash Invested
Calculation:
Annual cash flow divided by initial cash invested.
Debt Coverage Ratio (DCR)
Net Operating Income (NOI) divided by total debt payments.
Calculation:
NOI / Total Debt Payments
Internal Rate of Return (IRR)
A metric for assessing profitability over time. IRR is the discount rate at which the net present value (NPV) of all future cash flows (positive and negative) from an investment equals zero — including both periodic cash flow (such as rent) and a projected sale at the end of the holding period. It represents the expected annualized return, accounting for income, expenses, and the recovery of capital through a future sale.
Purchase Details
Purchase PriceThe price paid for the property. Purchase price:
| $850,000 |
|---|---|
Amount FinancedThe amount of the purchase financed through a loan. Amount financed:
| -$680,000 |
Down paymentThe initial payment made towards the purchase. Down payment:
| $170,000 |
Closing CostsFees and expenses associated with purchasing a property, typically ranging from 2% to 5% of the home’s purchase price, paid at the end of a home purchase to cover services like lending, title transfer, and taxes. Closing costs:
| $25,500 |
Rehab CostsCosts incurred to repair or improve the property, including: roof, flooring, exterior siding, kitchen, exterior paint, bathrooms, etc. Rehab costs:
| $0 |
Initial Cash InvestedThe total initial cash invested in the property. Calculation:Down payment + Buying costs + Rehab costs Initial cash invested:
| $195,500 |
Square Feet (SQFT)The total square footage of the property. Square feet:
| 3,438 |
Cost Per Square FootCost per square foot of the property. Calculation:Purchase Price / Square Feet Cost per square foot:
| $247 |
Monthly Rent Per Square FootMonthly rent divided by the number of square feet. This ratio helps investors compare rental income efficiency across properties, markets, and unit sizes Calculation:Monthly Rent / Square Feet Monthly rent per square foot:
| $1.25 |
Financing Details
Loan AmountThe total sum of money borrowed from a lender to finance a property purchase. Calculation:Purchase Price - Down Payment
Loan amount:
| $680,000 |
|---|---|
Loan to Value Ratio (LTV)Loan amount divided by the market value of the property. Calculation:Loan Amount / Market Value
Loan to value ratio:
| 80.0% |
Loan TypeThe type of loan (e.g., fixed, adjustable).
Loan type:
| Amortizing |
TermThe loan repayment period in years.
Term:
| 30 years |
Interest RateThe percentage a lender charges on the borrowed amount of a loan, determining the cost of borrowing money.
Interest rate:
| 6.625% |
Principal & Interest (PI)The principal is the portion of the loan payment that reduces the loan balance. The interest is the lender's charge for borrowing money. Calculation:(P * r * (1 + r) ** n) / ((1 + r) ** n - 1) Where:
P = Loan amount (principal)
Principal & interest:
| $4,354 |
Property TaxesAnnual taxes levied by local governments on real estate properties. These taxes fund public services like schools, roads, and emergency services.
Property tax:
| $659 |
InsuranceThe costs for insurance coverage to protect against financial losses due to risks like fire, natural disasters, theft, liability, or tenant-related damages. Calculation:Assumes 7% of gross rental income, unless insurance rates are specified.
Insurance:
| $301 |
Private Mortgage Insurance (PMI)A fee that borrowers pay when they take out a conventional loan with a loan-to-value (LTV) ratio above 80%.
Private mortgage insurance (PMI):
| $0 |
Monthly PaymentThe fixed amount a borrower pays each month to repay a loan. It typically includes principal and interest (P&I) and may also cover property taxes, insurance, HOA fees, and PMI if escrowed. Monthly payment:
| $5,314 |
Operating Income
| % Rent | Monthly | Yearly | |
|---|---|---|---|
Gross RentThe total rental income received from tenants before deducting any expenses. Includes base rent, late fees, pet fees, parking fees, and other recurring charges.
Gross rent:
| $4,300 | $51,600 | |
Vacancy LossExpected loss of rent due to vacancies.
Vacancy loss:
(6%)
| 6% | -$258 | -$3,096 |
Operating IncomeGross rental income minus vacancy loss. Calculation:Gross rent - Vacancy loss
Operating income:
| $4,042 | $48,504 |
Operating Expenses
| % Rent | Monthly | Yearly | |
|---|---|---|---|
Property TaxesAnnual taxes levied by local governments on real estate properties. These taxes fund public services like schools, roads, and emergency services. | 15% | -$659 | -$7,905 |
InsuranceThe costs for insurance coverage to protect against financial losses due to risks like fire, natural disasters, theft, liability, or tenant-related damages. Calculation:Assumes 7% of gross rental income, unless insurance rates are specified. | 7% | -$301 | -$3,612 |
Property ManagementThe costs associated with hiring a property manager to handle the day-to-day operations of a rental property. Includes management fees, leasing fes, eviction fees, etc. Calculation:Assumes 8% of gross rental income. | 8% | -$344 | -$4,128 |
Repairs & MaintenanceOngoing costs for routine upkeep and minor fixes needed to keep a property in good working condition. Calculation:Assumes 5% of gross rental income. Varies by property age and condition. | 5% | -$215 | -$2,580 |
Capital ExpensesLarge, infrequent costs for major improvements or replacements, like a new roof, HVAC system, or appliances. Calculation:Assumes 5% of gross rental income. Varies by property age. | 5% | -$215 | -$2,580 |
HOA FeesRegular dues paid to a Homeowners Association for community maintenance, amenities, and management. Similar fees include: Condo Association Fees, Co-op Maintenance Fees, etc. | 3% | -$147 | -$1,764 |
Operating ExpensesRecurring costs required to maintain and manage a rental property, including property taxes, insurance, maintenance, repairs, utilities (if paid by the owner), property management fees, and other day-to-day expenses. Calculation:Insurance + Property Taxes + Property Management + Repairs & Maintenance + Capital Expenditures + HOA Fees | 44% | -$1,881 | -$22,569 |
Cash Flow
| Monthly | Yearly | |
|---|---|---|
Net Operating Income (NOI)The income generated from a property after deducting all operating expenses but before deducting mortgage payments, taxes, and capital expenditures. Calculation:Gross Operating Income - Operating Expenses
Net operating income:
| $2,161 | $25,932 |
Mortgage PaymentThe fixed amount a borrower pays each month to repay a loan. It typically includes principal and interest (P&I) and may also cover property taxes, insurance, HOA fees, and PMI if escrowed. | -$4,354 | -$52,248 |
Cash FlowNet Operating Income (NOI) minus mortgage payments. Calculation:NOI - Mortgage Payments | $2,193 | $26,316 |